DOI: http://dx.doi.org/10.1590/2446-4740.0321
*e-mail: [email protected]
Received: 02 August 2013 / Accepted: 15 January 2015
Biochemical imaging of normal, adenoma, and colorectal
adenocarcinoma tissues by Fourier transform infrared spectroscopy
(FTIR) and morphological correlation by histopathological analysis:
preliminary results
Juliana Aparecida de Almeida Chaves Piva, João Lucas Rangel Silva, Leandro José Raniero, Carmen Silvia Passos Lima, Emilia Angela Loschiavo Arisawa, Cristiane de Oliveira, Renata de Azevedo Canevari, Juliana Ferreira, Airton Abrahão Martin*
Abstract Introduction: The colorectal cancer is a major health problem worldwide. Histology is considered the gold standard for differential diagnosis. However, it depends on the observer’s experience, which can lead to discrepancies and poor results. Spectroscopic imaging by Fourier transform infrared (FTIR) is a technique that may be able to improve the diagnosis, because it is based on biochemical differences of the structural constituents of tissue. Therefore, the main goal of this study was to explore the use of FTIR imaging technique in normal colon tissue, colorectal adenoma, and adenocarcinoma in order to correlate their morphological structures with their biochemical imaging. Methods: Samples were collected from normal (n = 4), adenoma (n = 4), and adenocarcinoma human colorectal tissue (n = 4) from patients undergoing colonoscopy or surgical resection of colon lesions. The samples were sectioned with a cryostat in sequential sections; the i rst slice was placed on CaF2 slide and the second slice was placed on glass slide for histological analysis (HE staining). The cluster analyses were performed by the software Cytospec (1.4.02). Results: In normal samples, biochemical analysis
classii ed six different structures, namely the lamina propria of mucous glands (epithelial cells and goblet cells), central lumen of the gland, mucin, and conjunctive tissue. In samples with adenoma and adenocarcinoma, altered regions could also be identii ed with high sensitivity and specii city. Conclusion: The results of this study demonstrate the potential and viability of using infrared spectroscopy to identify and classify colorectal tissues.
Keywords: Infrared imaging, Artii cial neural network, Human colon cancer, Biochemical correlation, Tissue classii cation, FTIR.
Introduction
Colorectal cancer is a major public health problem and is the third most common type of cancer and the
fourth leading cause of cancer death worldwide. Based
on demographic trends of annual incidences, a substantial increase of approximately 80% (2.2 million new cases) is expected in the next two decades, especially in less developed regions with an expected percentage of 62% in these regions (Karsa et al., 2010). According to the American Cancer Society, 102,480 new cases of colon cancer, 40,340 new cases of rectal cancer, and 50,830 deaths from these diseases were expected to occur in 2013 (American…, 2013). Thus, the consensus is that the control of colorectal cancer is
crucial and of global signii cance, and it should be
based on a balance between prevention, diagnosis, and treatment (Karsa et al., 2010).
Overall, colorectal cancer is asymptomatic and
is diagnosed late with the appearance of the i rst
symptoms. The main clinical manifestations consist of bleeding, pain, and changes in bowel habits. Thus,
the preventative tracking is necessary, involving the removal of polyps or tumors, for early identii cation, which could signii cantly increase the chance of a
cure (American…, 2011).
Colorectal lesions usually present as polyps, defined as any tissue mass protruding into the intestine, and depending on their characteristics are
classii ed in non-neoplastic, adenomatous (adenoma),
and adenocarcinoma. Non-neoplastic polyps could be a result of abnormal maturation of mucosa,
inl ammation, or alteration of cellular architecture.
Adenomatous polyps are premalignant lesions that may precede colorectal cancer (Torres et al., 2011), thus their detection is very important for clinical diagnosis. Colorectal adenocarcinoma originates
from epithelial cells that are able to ini ltrate into the
underlying layers, submucosa, and muscle of colon and rectum (Petibois and Déléris, 2006).
The diagnostic methods conventionally used for the detection of colorectal cancer are the examination of occult fecal blood, sigmoidoscopy, colonoscopy, barium enema with double contrast, digital rectal examination, and surgical biopsy for histopathological analysis. The latter is considered the gold standard to diagnose and classify the disease (Winawer, 2007). Histopathological analysis consists of the evaluation of the collected material by staining and traditional histological techniques. However, traditional histological
techniques present signiicant problems, which include
undetected lesions and unsatisfactory levels of inter and intra-observer agreement (Bird et al., 2008; Kallenbach-Thieltges et al., 2013; Stone, 2004). Thus, there is a need to develop new diagnostic technologies that are simple, objective, and sensitive (Fernandez et al., 2005).
Currently, optical techniques have been studied to diagnosis cancer. They do not use an approach based on morphological changes, which is the principle of histopathological studies (Fernandez et al., 2005). Automated optical analysis, based on the detection of biochemical alterations in tumor tissues is applied (Andrade et al., 2007). Fourier transform infrared (FTIR) spectroscopy is one of optical techniques that can effectively provide information on the structure and biochemical composition of the tissue (Cohenford et al., 2012; Kallenbach-Thieltges et al., 2013; Krafft et al., 2008; Lasch et al., 2004, 2006).
Krafft et al. (2008) carried out a comparative study of Raman and FTIR imaging techniques in
four tissue groups that make up the colon: muscle,
connective, epithelial, and nerve cells. The images
obtained by Raman and FTIR techniques identiied the
muscle, connective, and epithelial tissues, as well as nerve cells. Raman and FTIR images in hierarchical clustering showed coincidences, despite the fundamental differences between the techniques. According to the authors, the advantages of FTIR imaging were the lower acquisition time and the higher spectral quality, while the Raman technique allowed greater lateral and spectral resolution.
FTIR technique is based on direct absorption of light and thus analyzes the interaction of electromagnetic radiation with matter, determining the energy levels of atoms and molecules (Sala, 2008). The method provides an absorption spectrum due to vibrations of chemical bonds of biochemical components, such as proteins, nucleic acids, carbohydrates, and lipids. The infrared absorption band of most molecules is in the spectral region between 400 and 4000 cm–1, known as
the ingerprint region of the molecule. In this region,
small changes in the structure and constitution of a
molecule result in signiicant changes in the form
and distribution of spectrum absorption bands related to the structure of the molecule. FTIR spectroscopy has several advantages, including a high molecular sensitivity combined with a spatial resolution of a few micrometers, the analysis of samples without pretreatment, the ability to identify and discriminate healthy and tumor areas (Petibois and Déléris, 2006).
Furthermore, by avoiding the use of dyes or markers
to obtain FTIR images, this technique has advantages over conventional histology (Bird et al., 2008).
FTIR spectroscopy has been used as a supportive tool to histopathological techniques to differentiate of normal tissue changes and identify the stages of
tumor development. By eliminating the subjectivity
and ensuring greater accuracy of diagnosis, FTIR has established itself as an effective and reproducible technique (Bird et al., 2008; Colagar et al., 2011; Di Giambattista et al., 2011; Kallenbach-Thieltges et al., 2013; Mostaço-Guidolin and Bachmann, 2011; Piva et al., 2011). Thus, combining the precision of FTIR technique with histopathology allows a more accurate diagnosis, which is independent of experience inter-observers (Bird et al., 2008; Kallenbach-Thieltges et al., 2013; Lasch et al., 2006).
In view of the large data set produced by FTIR
imaging, the techniques of artiicial neural networks are used (Artiicial Neural Network - ANN) for
supervised image analysis (Lasch et al., 2006; Udelhoven et al., 2000).
The studies cited above demonstrate the need to perform a number of tests on colon samples by FTIR spectroscopy to obtain a more comprehensive database
that enables identiication of the various structures
in the different analyzed tissues. Therefore, given the advantages of optical spectroscopy, their future
relevance in the medical ield, and the need to build
a larger spectral database, this study aimed to apply the infrared spectroscopy technique for differential diagnosis of the normal colorectal tissue, adenomatous, and adenocarcinoma by histological correlation of these tissues with the corresponding biochemical images obtained by FTIR.
Methods
Sample preparation
This study followed the guidelines and regulatory standards for research involving human subjects
according to Resolution 196/96 of the Brazilian National
the samples, and the Research Ethics Committee of Universidade do Vale do Paraíba, Protocol H083 / CEP / 2009, approved the development of the entire experiment. This study used 12 samples of human
colorectal tissue taken from patients undergoing
colonoscopy or resection in Gastrocentro and Surgical Center of Hospital of the State University of Campinas, SP. The specimens were sourced from seven men and
ive women, Caucasian, mean age 53 years ± 13.57 and 25% coeficient of variation. Of these 12 samples,
four are of normal tissue; one of a tubular adenoma; three hyperplastic adenomas, and four moderately differentiated adenocarcinoma.
The samples were sectioned on Cryostat (Leica
CM 1100) at –23 °C, ixed to the cutting table using
Tissue Freezing Medium (Leica Instruments GmbH,
Nussloch, Germany). This ixer at temperatures below –10 °C instantly solidiies around the sample
without any interaction or invasion of the freezing medium within the sample, and consequently without interfering in the absorption bands of the compounds present in the tissue. The specimens were positioned for
subsequent cutting into sequential sections of 12 μm. The irst section of the cutting pair was positioned
on a slide with an optical window made of calcium
luoride (CaF2) for FTIR spectroscopic analysis, and
the second section of the respective pair was placed on a common histological slide. This was stained, using standard protocol staining by hematoxylin and eosin (HE), and subsequently analyzed in order to identify and classify the structures present in samples of normal tissue, adenomatous, and adenocarcinoma.
Data collection by FTIR spectroscopy
The infrared images were collected in transmittance mode in four different regions of each sample, the total was 48 images. We used the microscope imaging
Spotlight 400 (Perkin-Elmer) equipped with the MCT
detector (Mercury Cadmium Telluride), operating at liquid nitrogen temperature and connected to a
spectrometer (Spectrum 400 - Perkin-Elmer). The
images were obtained in the range of 4000-900 cm–1
with 32 scans per pixel (pixel size 6.25 μm2) and
resolution of 4 cm–1. After the FTIR measurements,
the iles were imported using Cytospec software (version 1.4.02) to analyze the spectral matrix, which formed the infrared image.
Statistical analysis
The raw spectra of biochemical maps were imported by Cytospec software and converted from transmittance spectra to absorbance spectra. Then, the spectral quality test was made, which consists of three
steps: amount of water vapor, signal/noise ratio, and
sample thickness (Cytospec, 2010; Lasch et al., 2006).
After the quality test, the irst derivative was calculated (Savitsky Golay algorithm with nine points
of smoothing) to evidence the minimum differences between the spectra and remove noise interference. Additionally, a vector normalization was applied in the region of 4000 - 900 cm-1 in all infrared spectra
of the image.
First, biochemically different spectra regions were selected from the visual analysis. The selected regions were in accordance with the results of Lasch et al. (2006) and Krafft et al. (2008), and were used to select the regions that possibly have higher spectral differences between groups. Then, these regions were tested statistically by Hierarchical Cluster Analysis – HCA, using the Cytospec software. This software allowed the construction of a dendrogram to visualize
the correct separation of the spectra, which relect the
different structures of the biological tissue. For the HCA analysis, the spectral distances were calculated by
the Pearson linear correlation coeficient. The Pearson correlation coeficient is deined by measuring linear
association between variables and is based on the covariance of the data. This covariance was measured by common variability of two variables (growth of both or growth of one and decrease of the other).
After using the Pearson coeficient, the second part
of the HCA was applied, the Ward’s algorithm, to minimize the heterogeneity between the elements of each group, thus creating more homogeneous groups (Díaz and López, 2007).
After the HCA analysis, it was possible to determine the regions with greater biochemical variations. In this study, two discriminant regions were selected - 3000-2800 cm–1, which is characteristic for vibrational
modes of the CH2 and CH3, assigned to lipids, proteins, and carbohydrates, and the region of 1450-950 cm–1,
called ingerprint, which has the spectral signature
of each type of structure and/or tissue.
Hierarchical clustering analysis was applied again in order to mathematically reconstruct the infrared
image, taking into account previously selected
discriminant spectral regions. The result of this analysis represents the biochemical changes in the tissue, which could be seen by the different colors that constitute the biochemical map. After reconstruction
of the biochemical images, we evaluated the eficiency
of the FTIR technique to provide information on the tissue structures in order to distinguish and classify them. For this reason, we applied to all spectral data
the supervised test Artiicial Neural Networks - ANN
NeuroDeveloper 2.5 routine combines modules for selecting spectral characteristics, development of neural
models, and classiication based on neural networks.
A detailed description of this technique is found in the literature (Lasch et al., 2006; NeuroDeveloper, 2010; CytoSpec, 2010).
The use of neural network allowed the construction
of a new image based on comparing the spectra obtained by FTIR with the database. A database of the spectral reference of the tissue structures, which were
used as the trained spectra of neural network, made it
possible to compare the trained spectra with the spectra obtained by FTIR imaging technique, with consequent
classiication thereof (Lasch et al., 2006). The general
strategy to analyze artiicial neural networks in this
study included the process of teaching and optimize the MLP model - multilayer perceptron, by the tests
of classiiers with independent validation of the data
set. Teaching and internal validation was carried out
based on infrared spectra with known biochemical
assignment, which was the spectra of samples of colon database. External validation (testing) of the
classiiers was made by generating images of neural networks from the infrared spectra matrix. Thus, the classiiers were created from the database, while the
model assessment was made by comparing the images
of neural networks and equivalent photomicrographs
of samples stained with H&E technique. For teaching spectra of colon database, they were primiraly pre-processed as described above. Then, the effective spectral resolution was reduced by a factor of 6 (averaging) and then 60-85 spectral characteristics were chosen by a covariance analysis procedure
implemented in the NeuroDeveloper software package
(Udelhoven et al., 2000). In this work, we chose the
neural network model MLP - feed-forward, which used three connected layers, where each input, hidden, and output layer was constituted by neurons. Teaching
of neural network was performed using a resilient back-propagation (Rprop) algorithm (Riedmiller
and Braun, 1993). The number of neurons in the input layer corresponds to the length of the standard input, ranging between 60 and 85. In addition, the
number of hidden neurons was generally deined as
4, and the number of output neurons is equal to the number of classes in MLP. In this study, a hierarchical
system of neural networks was applied. The main
advantage of this method is the ability to separately
train and validate small and lexible neural network
which can be combined afterwards to build up large
modular systems of neural networks (Marques de Sá, 2001; Auda and Kamel, 1998). Furthermore, the use
of modular network speciically permitted the use of
optimised combinations of spectral characteristics for
each neural network module separately.
Several criteria were used when performed this
comparison. The irst criterion used was Winner Takes All - WTA which means that the classiication
depends on the highest output activation. A spectrum
will only be classiied if its output is greater than the deined minimum activation of the winner neuron
and the minimum distance to the next activation.
Otherwise, the classiication will not be considered correct and the spectrum remains unclassiied, represented in biochemical image by a black pixel.
The second criterion was the activation 406040, which states that the activation of one neuron has to exceed 0.6 (default, above 60% of the activation range). All other activations of further classes have to be below 0.4 (below 40% percent of the activation
range). Otherwise, the pattern remains unclassiied.
The latter criterion used the extrapolation, which is based on a distance value derived from the training and validation dataset to determine an extrapolation problem. The maximum distance of a standard to its corresponding class is calculated and set to 100.
During the classiication of a new standard by the neural network, the distance of the new standard is
calculated and set into relation. For example, if the
calculated extrapolation value of the class identiied
by the neural exceeds 100, an extrapolation occurs. This last criterion is of utmost importance when the validation data set does not contain all classes (NeuroDeveloper, 2010). Additionally, the neural
network allows determination of the percentage of
the different structures that compose the tissue. After statistical analysis, biochemical images obtained were qualitatively compared with the histological images. This procedure was carried
out in two stages. The irst stage consisted of visual
comparison of the area analyzed by FTIR technique with its corresponding region in histological slide in order to validate the effectiveness of the technique
in the identiication of the major tissue structures.
The second phase consisted of correlation of results,
obtained from the neural network technique, with
histopathological results for the purpose of proving the
eficiency of the neural networks technique associated
with infrared imaging for the diagnosis of colorectal cancer. These comparisons are presented in results and discussion sections.
Results
of the Gastrocentro of the Universidade Estadual de Campinas. Figures 1(a), 2(a), and 3(a) show the complex histoarchitecture of the colorectal tissue. The normal mucosa is shown in Figure 1(a) where it is possible to observe the cross-sectioned crypt (CR), composed of epithelial cells (EC), and the lamina propria (LP). Figures 1(b) and 1(c) show the sample in CaF2 slides and their biochemical image obtained by FTIR imaging, respectively. The latter is used to generate the biochemical images shown in Figure 1(d). This igure refers to the classiication by
neural networks, where each color was determined by
the routine on Cytospec software and represents the different structure or region of the sample. Table 1 shows the correlation of morphological (Figures 1(a) and 1(b)) and biochemical data (Figure 1(d)), which
was obtained through the neural network computational
routine by calculating the percentage of each type of structure or tissue present in the image.
Table 1 shows that the structures of the carcinoma, necrosis, and lamina propria, respectively, 0.25%,
0.14%, and 1.98% of the analyzed area. This low
percentage is justiied by the fact that these structures
are not characteristic of a normal tissue, and the fact that the small database available does not include all spectral variations of the tissue. This explains the absence of color in the biochemical image shown in Figure 1(d). Approximately 13.07% of the spectra
could not be identiied by the neural network due to
Figure 1. Tissue sample of normal colon (a) HE staining – (CR: Cripts; EC: Epithelial Cells; LP: Lamina Propria); (b) CaF2 slide; (c) Image/ biochemistry obtained by FT-IR; (d) Processed image obtained by ANN.
Figure 2. Samples of polyp (severe dysplasia) (a) HE staining (LM: Lumen; CR: Cripts; F: Fusion of glandular structures); (b) CaF2 slide; (c) Image/biochemistry obtained by FT-IR; (d) Processed image obtained by ANN.
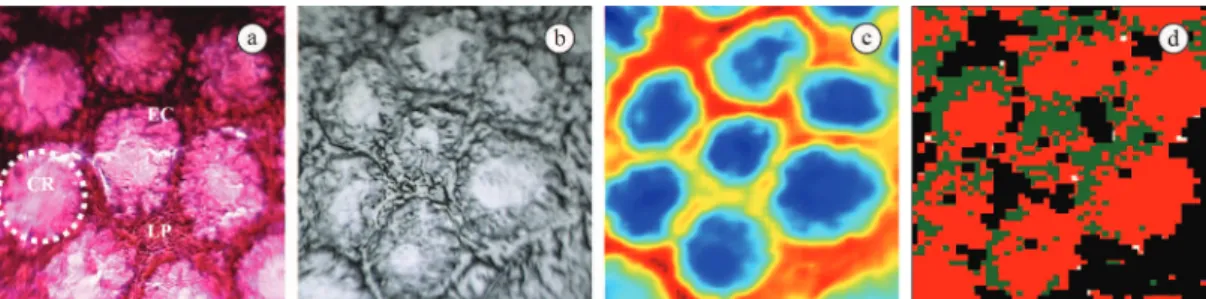
Figure 3. Samples of adenocarcinoma. (a) HE staining (CR: Cripts; LP: Lamina Propria; PH: Cellular and nuclear pleomorphism, and hyperchromatic nuclear); (b) CaF2 slide; (c) Image/biochemistry obtained by FT-IR; (d) Processed image obtained by ANN.
Table 1. Correlation of biochemical versus morphological normal
colon tissue, obtained using routine computational neural networks.
COLOR STRUCTURE/
TISSUE PERCENTAGE
Blue Carcinoma 0.25%
Red Cripts 62.46%
Dark green Mucin 22.1%
Salmon Necrosis 0.14%
Light yellow Lamina propria 1.98%
Black Not identiied 13.07%
the small database that makes up the neural network
for identifying the biochemical structures. However using information obtained through the histology, we
can identify these structures in black as connective
tissue, present in normal colorectal tissues. Other structures such as crypts and mucin, which are the morphological structures of this tissue, were correctly
identiied, corresponding to 62.46% and 22.1%,
respectively.
Figure 2(a) shows the colorectal tissue slide, stained with H&E, where histologically moderate dysplasia features with increased lumen (LM), dilated crypts (CR), and the pattern of fusion of glandular structures
in some histological ields (F) could be observed.
This tissue is also characteristic of the presence of hyperchromic and increased cell nuclei, as well as the duplication of layers. Figures 2(b) and 2(c) show the tissue sample in CaF2 slides and their biochemical image obtained by FTIR imaging, respectively. The latter is used to generate the biochemical images represented in Figure 2(d). Figure 2(d) and Table 2
refer to the classiication by neural networks: the image was colored in ive different colors. The predominant black color in this igure represents the spectra of
constituents, which not present yet in the database,
and therefore could not be classiied (68.8%). The histological analysis classiied this region as connective
tissue. The second predominant region, in blue, was
classiied as carcinoma and represents 11.58% of the
analyzed image. The red color represents the crypts
(9.67%); dark green, mucin (3.99%); and the light
yellow, lamina propria (5.95%).
Figure 3(a) shows the adenocarcinoma, which has typical morphological signs of malignancy, showing
a disorganized architecture with tumor iniltrating
the submucosa and atypical glands. These signals are characterized by atypical histoarchitecture, with several layers of cells, which show cell and nuclear pleomorphism and nuclear hipercromatism (PH). Figures 3(b) and 3(c) represent sample of the CaF2 slices and their biochemical image obtained by FTIR imaging, respectively. The latter is used to generate the biochemical image represented in Figure 3(d). Figure 3(d) and Table 3 presents results according to
the neural networks classiication. In this case, the
image was colored in seven different shades, four
being displayed: black, red, dark blue, and green. The predominant color (black) again represents the
region where the vibrational spectra are not present
in the database and therefore could not be identiied
(71.84%); the second predominant (59.54%) color
(Blue) is the region identiied as adenocarcinoma, conirmed by the sample stained with H&E.
Discussion
A large number of studies have been proposed for using the FTIR imaging technique in tissues, using multivariate methods such as principal component analysis (PCA) (Lasch and Naumann, 1998) and hierarchical cluster analysis (HCA) (Diem et al., 2000; Jackson et al., 1998; Schultz and Mantsch, 1998), K-means cluster analysis (KM), fuzzy C-means clustering analysis (FCM) (Mansfield et al., 1997; Zhang et al., 2003), and linear discriminant analysis (LDA) (Mansfield et al., 1999). However, more recently
the artiicial neural networks analysis (ANN) has
emerged as a new effective methodology to analyze biochemical images (Lasch and Naumann, 1998; Lasch et al., 2002), because it offers more precise information about the biochemical structures that compose the tissue and thus distinguish them.
Because the use of neural network analysis is recent, to our knowledge there are few studies in the
literature that have used it as a method to differentiate colon tissue in humans (Argov, 2002; Kallenbach-Thieltges et al., 2013; Lasch et al., 2004, 2006; Piva et al., 2011) and rats (Cohenford et al., 2012).
Argov (2002) conducted the irst study using
the FTIR technique and neural network analysis in colon tissues. The authors used biological markers
derived of the spectrum to differentiate the types of the tissue, such as phosphatase and DNA/RNA of pathological normal tissue, adenomatous polyps, and Table 2. Correlation of biochemical versus morphological colon
polyps (moderate dysplasia), obtained using routine computational
neural networks.
COLOR STRUCTURE/
TISSUE PERCENTAGE
Blue Carcinoma 11.58%
Red Cripts 9.67%
Dark green Mucin 3.99%
Light yellow Lamina propria 5.95%
Black Not identiied 68.8%
Total 99.99%
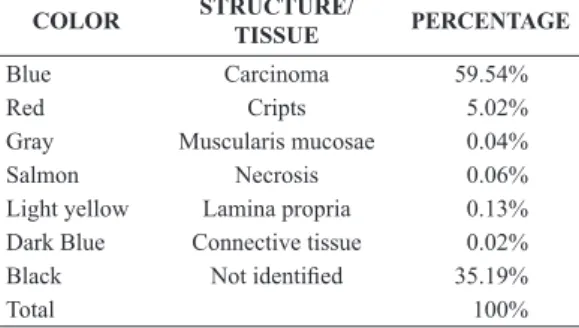
Table 3. Correlation of biochemical versus morphological colon
adenocarcinoma, obtained using routine computational neural networks.
COLOR STRUCTURE/
TISSUE PERCENTAGE
Blue Carcinoma 59.54%
Red Cripts 5.02%
Gray Muscularis mucosae 0.04%
Salmon Necrosis 0.06%
Light yellow Lamina propria 0.13%
Dark Blue Connective tissue 0.02%
Black Not identiied 35.19%
carcinoma. The results showed that the biological
markers used did not differentiate adenomatous polyp
of adenocarcinomas. However, when these authors used a combination of wavelet features and the neural
network analysis, they were able to classify different
cells in a particular sample, such as normal cells, cells derived from adenomatous polyp or malignant cells,
with a successful classiication percentage of 89%,
81%, and 83%, respectively. These authors suggest
that the neural network analysis of spectra from
different cells can be a powerful tool to diagnosis the pre-malignant neoplasia stage.
Lasch et al. (2004) conducted a comparative study among three multivariate analyses applied to the infrared images from colon tissue. The selected statistical methods were hierarchical cluster analysis, fuzzy C-means cluster analysis, and K-means cluster analysis. In this study, the authors concluded that
the data pre-processing can dramatically inluence
on the quality of the images, and the results showed the great capacity of the FTIR technique associated with statistical methods for evaluation and diagnosis of colon tissues. In addition, the hierarchical cluster analysis proved to be the best method to differentiate the tissue structures.
Lasch et al. (2006) also applied the neural networks technique as a supervised technique with the aim of obtaining biochemical images from the spectral matrix of the colorectal adenocarcinoma samples and correlated them to the histological samples. The database in that study was composed by spectra from 28 patient samples and 12 different histological
structures. The authors observed that the deinition of the neural network topology was crucial to achieve a
high correlation between histopathological analysis and infrared spectroscopy. As in the present study, our results showed that the use of hierarchical cluster analysis technique in the early stages of model
generation for the neural networks was more eficient compared to the spectral classiication of the samples.
Piva et al. (2011) used the theoretical knowledge
of irst principles molecular dynamics and statistical
methods to interpret and understand the infrared absorption (vibrational) and Raman scattering. They could be used in combination with purely experimental studies to generate infrared and Raman images of
biomolecules, luids, cells, and both healthy and
diseased tissue.
Still, more studies are needed to prove the potential of using the FTIR imaging technique associated with statistical analysis to classify and diagnose colon tissues.
For this aim, irst, we performed the visual correlation
of the structures that match in both the histological slide and biochemical images reconstructed by CytoSpec
software, which can be observed at the Figures 1(a, d); 2(a, d), and 3(a, d) and in the Tables 1, 2, and 3. In line with the observations from the histological sections,
the images analyzed by neural networks showed increasing percentage of areas identiied as carcinoma
– 0.25%, 11.58%, and 59.54% for the normal samples, moderate dysplasia, and adenocarcinoma samples,
respectively. Identiication of the tumor region in the
normal samples and in moderate dysplasia samples, although in low percentage, may be related to the
lack of spectral information in Cytospec software database representing all the biochemical changes in normal tissue and dysplasia, respectively. However, when the spectra of the characteristic morphological structures are already present in the software routine,
they can be correctly identiied, for example, crypts
and mucin. Furthermore, in samples with dysplasia, tissue heterogeneity is higher than in normal tissue, which may induce minor spectral changes that are not yet present in the software database. Therefore, for
correct identiication of all morphological structures,
it is essential to have a robust spectral database, to cover all possible alterations in colorectal tissues. The increase of the percentage of the area with carcinoma in Figure 3 is consistent with the histological report, which shows a disorganized architecture with tumor
iniltrating the submucosa and atypical glands,
and a decrease in intracellular mucin with loss of differentiation in columnar and goblet cells.
In terms of morphological structures such as mucins and crypts, the similarity of histological and biochemical images could be observed in Figure 1, showing that the spectral database is able to identify these structures. Figures 2 and 3 show that when the tissue undergoes alterations, its organized histoarchitecture is lost; however, it is still possible to correlate biochemical images of the some structures, which are situated in the unchanged regions, for example, some crypts and mucins. This disorder is highly evident in adenocarcinoma tissue, thereby decreasing
the percentage of the identiied crypts structures. In both samples, the percentage of unidentiied regions
is higher than in normal tissues. This may be related to the process of biochemical changes that are more evident in the case of dysplasia, and to a lesser extent in the tissue that has developed adenocarcinoma.
Divergence of the results presented by the analysis techniques H&E and FTIR imaging could be related to the number of data stored in the NeuroDeveloper
software, which compose the neural network. Therefore, it is necessary to make a more robust database,
extending it by including new sample data. In addition, further study is necessary of vibrational modes that
their biochemical variations, which can lead to faster and more accurate diagnosis. However, in general, there is a relatively high correlation between the gold standard histopathology and spectral diagnostics in all samples.
The combination of the spectroscopic imaging with image analysis digital techniques is considered as a relatively new tool for characterizing tissues, allowing the differentiation of normal and abnormal tissues. Preliminary results of this study validate the technique of infrared spectroscopy in the differential diagnosis between the normal, adenomatous, and adenocarcinoma colorectal tissues. These results also demonstrate the great potential for use of FTIR imaging to identify and classify histological structures, and detect biochemical and morphological changes, occurring in the tissues, thus showing it to be a promising technique for use in routine clinical practice.
Acknowledgements
CNPq (302761/2009-8; 307809/2013-7), Universidade do Vale do Paraíba - UNIVAP, Universidade Estadual de Campinas - UNICAMP, Conselho de Aperfeiçoamento de Pessoal de Nivel Superior - CAPES e CIPAX medicina diagnóstica.
References
American Cancer Society - ACS. Cancer facts & figures. Atlanta: American Cancer Society; 2011.
American Cancer Society - ACS. Detailed guide: colon and rectum cancer. Atlanta: American Cancer Society; 2013. Andrade PO, Bitar RA, Yassoyama K, Martinho H, Santo AM, Bruno PM, Martin AA. Study of normal colorectal tissue by FT-Raman spectroscopy. Analytical and Bioanalytical Chemistry 2007; 387(5):1643-8. http://dx.doi.org/10.1007/ s00216-006-0819-1. PMid:17031621
Argov S. Diagnostic potential of Fourier-transform infrared microspectroscopy and advanced computational methods in colon cancer patients. Journal of Biomedical Optics 2002; 7(2):1.
Auda G, Kamel M. Modular network classifiers: a comparative study. Journal of Intelligent & Robotic Systems 1998; 21(2):117-29. http://dx.doi.org/10.1023/A:1007925203918. Bird B, Miljkovic M, Romeo MJ, Smith J, Stone N, George MW, Diem M. Infrared micro-spectral imaging: distinction of tissue types in axillary lymph node histology. BMC Clinical Pathology 2008; 8(1):8. http://dx.doi.org/10.1186/1472-6890-8-8. PMid:18759967
Cohenford MA, Lim S, Brown C, Chaudhry MA, Sigdel S, Beckelhimer E, Rigas B. FT-IR microspectroscopy of mouse colon tissues: insight into the chemistry of carcinogenesis and diagnostic potential. American Journal of Pathology 2012; 181(6):1961-8. http://dx.doi.org/10.1016/j.ajpath.2012.08.039. PMid:23063512
Colagar AH, Chaichi MJ, Khadjvand T. Fourier transform infrared microspectroscopy as a diagnostic tool for distinguishing between normal and malignant human gastric tissue. Journal of Biosciences 2011; 36(4):669-77. http:// dx.doi.org/10.1007/s12038-011-9090-5. PMid:21857113
CytoSpec. CytoSpec: an application for hyperspectral imaging. 2010. Available from: http://www.cytospec.com/ index.html.
Di Giambattista L, Pozzi D, Grimaldi P, Gaudenzi S, Morrone S, Castellano AC. New marker of tumor cell death revealed by ATR-FTIR spectroscopy. Analytical and Bioanalytical Chemistry 2011; 399(8):2771-8. http://dx.doi.org/10.1007/ s00216-011-4654-7. PMid:21249341
Díaz FR, López FFB. Bioestatística. São Paulo: Thomson; 2007. p. 57.
Diem M, Chiriboga L, Yee H. Infrared spectroscopy of human cells and tissue. VIII. Strategies for analysis of infrared tissue mapping data and applications to liver tissue. Biopolymers 2000; 57(5):282-90. http://dx.doi.org/10.1002/1097-0282(2000)57:5<282::AID-BIP50>3.0.CO;2-R. PMid:10958320 Fernandez DC, Bhargava R, Hewitt SM, Levin IW. Infrared spectroscopic imaging for histopathologic recognition. Nature Biotechnology 2005; 23(4):469-74. http://dx.doi. org/10.1038/nbt1080. PMid:15793574
Jackson M, Ramjiawan B, Hewko M, Mantsch HH. Infrared microscopic functional group mapping and spectral clustering analysis of hypercholesterolemic rabbit liver. Cellular and Molecular Biology 1998; 44(1):89-98. PMid:9551641. Kallenbach-Thieltges A, Großerüschkamp F, Mosig A, Diem M, Tannapfel A, Gerwert K. Immunohistochemistry, histopathology and infrared spectral histopathology of colon cancer tissue sections. Journal of Biophotonics 2013; 6(1):88-100. http://dx.doi.org/10.1002/jbio.201200132. PMid:23225612
Karsa LV, Lignini TA, Patnick J, Lambert R, Sauvaget C. The dimensions of the CRC problem. Best Practice & Research. Clinical Gastroenterology 2010; 24(4):381-96. http://dx.doi.org/10.1016/j.bpg.2010.06.004. PMid:20833343
Krafft C, Codrich D, Pelizzo G, Sergo V. Raman and FTIR microscopic imaging of colon tissue: a comparative study. Journal of Biophotonics. 2008; 1(2):154-69. http://dx.doi. org/10.1002/jbio.200710005. PMid:19343646
Lasch P, Naumann D. FT-IR microspectroscopic imaging of human carcinoma thin sections based on pattern recognition techniques. Cellular and Molecular Biology 1998; 44(1):189-202. PMid:9551650.
Lasch P, Haensch W, Lewis EN, Kidder LH, Naumann D. Characterization of colorectal adenocarcinoma sections by spatially resolved FT-IR microspectroscopy. Applied Spectroscopy 2002; 56(1):1-9. http://dx.doi. org/10.1366/0003702021954322.
Lasch P, Diem M, Hänsch W, Naumann D. Artificial neural networks as supervised techniques for FT-IR microspectroscopic imaging. Journal of Chemometrics 2006; 20(5):209-20. http://dx.doi.org/10.1002/cem.993. PMid:19960119
Mansfield JR, McIntosh LM, Crowson AN, Mantsch HH, Jackson M. A LDA-guided search engine for the non-subjective analysis of infrared microscopic maps. Applied Spectroscopy 1999; 53(11):1323-30. http://dx.doi. org/10.1366/0003702991945920.
Mansfield JR, Sowa MG, Scarth GB, Somorjai RL, Mantsch HH. Analysis of spectroscopic imaging data by fuzzy C-means clustering. Analytical Chemistry 1997; 69(16):3370-4. http:// dx.doi.org/10.1021/ac970206r.
Marques de Sá JP. Pattern recognition: concepts, methods and applications. Berlin: Springer-Verlag; 2001. http:// dx.doi.org/10.1007/978-3-642-56651-6.
Mostaço-Guidolin LB, Bachmann L. bachmann L. Application of FTIR Spectroscopy for identification of blood and leucemia biomarkers: A Review over the past 15 years. Applied Spectroscopy Reviews 2011; 46(5):388-404. http:// dx.doi.org/10.1080/05704928.2011.565534.
NeuroDeveloper. Synthon’s NeuroDeveloper 2.5TM: software designed for the classification of spectroscopic data with artificial neural networks. 2010. Available from: http://www.synthon-analytics.de/synthon_01_content.html.
Petibois C, Déléris G. Chemical mapping of tumor progression by FT-IR imaging: towards molecular histopathology. Trends in Biotechnology 2006; 24(10):455-62. http:// dx.doi.org/10.1016/j.tibtech.2006.08.005. PMid:16935373 Piva JAAC, Silva JLR, Raniero L, Martin AA, Bohr HG, Jalkanem KJ. Overview of the use of theory to understand infrared and Raman spectra and images of biomolecules: colorectal cancer as an example. Theoretical Chemistry
accounts. Theory, Computation, and Modeling. 2011; 130(4-6):1261-73.
Riedmiller M, Braun H. A direct adaptive method for faster backpropagation learning: the RPROP algorithm. In: IEEE International Conference on Neural Networks (InICNN-93); 1993; San Francisco, CA. p. 586-91.
Sala O. Fundamentos da espectroscopia Raman e no infravermelho. 2. ed. Unesp; 2008.
Schultz CP, Mantsch HH. Biochemical imaging and 2D classification of keratin pearl structures in oral squamous cell carcinoma. Cellular and Molecular Biology 1998; 44(1):203-10. PMid:9551651.
Stone S. Raman spectroscopy for identification of epithelial cancers. Faraday Discussions 2004; 126:141-57.
Torres JRN, Arcieri JS, Teixeira FR. Aspectos epidemiológicos dos pólipos e lesões plano-elevadas colorretais. Revista Brasileira de Coloproctologia 2011; 30(4):419-29.
Udelhoven T, Naumann D, Schmitt J. Development of a hierarchical classification system with artificial neural networks and FT-IR specta for the identification of bacteria. Applied Spectroscopy 2000; 54(10):1471-9. http://dx.doi. org/10.1366/0003702001948619.
Winawer SJ. The multidisciplinary management of gastrointestinal cancer: colorectal cancer screening. Best Practice & Research. Clinical Gastroenterology 2007; 21(6):1031-48. http://dx.doi.org/10.1016/j.bpg.2007.09.004. PMid:18070702
Zhang L, Small GW, Haka AS, Kidder LH, Lewis EN. Classification of Fourier transform infrared microscopic imaging data of human breast cells by cluster analysis and artificial neural networks. Applied Spectroscopy 2003; 57(1):14-22. http://dx.doi.org/10.1366/000370203321165151. PMid:14610931
Authors
Juliana Aparecida de Almeida Chaves Piva1, João Lucas Rangel Silva1, Leandro José Raniero1, Carmen Silvia
Passos Lima2, Emilia Angela Loschiavo Arisawa1, Cristiane de Oliveira2, Renata de Azevedo Canevari1, Juliana
Ferreira1, Airton Abrahão Martin1*
1Laboratório de Espectroscopia Vibracional Biomédica – LEVB, Instituto de Pesquisa e Desenvolvimento - IPD,
Universidade do Vale do Paraíba – UNIVAP, Av. Shishima Hifumi, 2911, Urbanova, CEP 12244-000, São José dos Campos, SP, Brazil.
2Departamento de Clínica Médica, Faculdade de Ciências Médicas – FCM, Universidade Estadual de Campinas,