DOI: http://dx.doi.org/10.1590/2446-4740.0653
*e-mail: [email protected]
Received: 04 September 2014 / Accepted: 19 January 2015
In vitro evaluation of a closed-loop feedback system for dopamine
concentration control
Carlos Eduardo de Araujo*, Paulo José Abatti, Cláudio Da Cunha, Alexander Gómez, Patrícia Andréia Dombrowski
Abstract Introduction: It is well known that Parkinson’s disease is related to a deicit of dopamine (DA) in the region of the brain called the corpus striatum. The aim of this work is to demonstrate the possibility of in vitro
closed-loop control of the DA concentration levels. Methods: By applying the electrochemical technique of fast scan cyclic voltammetry (FSCV), the measured values were compared with previously selected ones, and the system made decisions to control infusion pumps by dynamically adjusting the DA concentration in a continuous low injection cell. Low-cost hardware was used for the acquisition and control signals (Arduino board), whereas for processing the collected data, graphical programming software (LabView) was used. Results: The resolution of the system was approximately 0.4 µmol/L, with a time correction of the concentration adjustable between 1 and 90 seconds. The system allowed control of the DA concentration between 1 and 10 µmol/L with an error of approximately +/– 0.8 µmol/L. Conclusion: Although designed to control the DA concentration, the system could be used to control, within the range of the developed FSCV, the concentration of other substances or to turn on brain stimulators. These results encourage the possibility of using the system in clinical studies (in vivo).
Keywords: FSCV, Neurotransmitters, Closed-loop, Dopamine.
Introduction
Parkinson’s disease (PD) is the second most prevalent neurodegenerative disease that affects nearly 0.5% of the population older than 60 years (Wirdefeldt et al., 2011). PD is characterized by cognitive and motor deicits including akinesia (dificulty to initiate movements). These deicits appear after the degeneration of more than 70% of the neurons of the substantia nigra pars compacta that release the neurotransmitter dopamine (DA) in the corpus striatum (Schapira and Jenner, 2011). Currently, no treatment is known to cure or halt PD; however, the motor symptoms improve with DA replacement (medication) and deep brain stimulation (DBS) of the subthalamic nucleus (Kalia et al., 2013; Rascol et al., 2011). In fact, medication infusion by subcutaneous or duodenal pumps has been used in recent studies (Volkmann et al., 2013).
There are several electrochemical techniques available to determine neurotransmitter concentrations. Speciically, fast scan cyclic voltammetry (FSCV) is extensively used nowadays. It consists of measuring the reduction and oxidation (REDOX) of a given electroactive species close of the surface of a working electrode at which a time-varying voltage waveform is applied. For instance, oxidation of DA, which
produces the maximum current (which is proportional to the DA concentration), occurs at approximately 700 mV. The popularity of FSCV is likely due to the development of electronic devices such as operational ampliiers (OA) and microcontrollers with fast and high-resolution analog-to-digital converters (ADC) and digital-to-analog (DAC) modules. However, FSCV is a very useful technique for detecting rapid changes in the DA concentration, which is one of the most analyzed neurotransmitters (Garris et al., 2004; Kagohashi et al., 2008; Shon et al., 2010; Takmakov et al., 2011). The method can be used to detect changes in the DA concentration that occur naturally or artiicially due to stimuli such as lights, drugs, chemicals, neurostimulation, sounds, and interaction with other animals, among others (Robinson et al., 2003). FSCV has been used in clinical studies, in animal neuropsychology studies and in behavioral neurophysiology laboratories. The determination of the neurotransmitter concentration allows the medical doctor or the researcher to deliver the appropriate amount of drug or stimulus and evaluate the effects of these actions, thus making the so-called “human-in-the-loop” (HITL) control. However, the HITL technique is not adequate for long-term control of the neurotransmitter concentration.
There are several approaches in the literature that aim to develop closed-loop automatic systems to control PD symptoms (Basu et al., 2011; Chen et al., 2013; Kimble et al., 2009; Lee et al., 2010; Poustinchi and Musallam, 2014; Rotenberg et al., 2008; Stanslaski et al., 2009; 2012). However, few of these approaches use the direct evaluation of the DA concentration to control drug delivery or to turn on a stimulator. For instance, Poustinchi and Musallam described the in vitro test of a system that used the DA concentration level, measured by FSCV, to control the delivery of a glial cell line-derived neurotrophic factor (Grondin and Gash, 1998; Poustinchi and Musallam, 2014). Kimble et al. (2009) mentioned the possibility of turning on a DBS using the neurotransmitter concentration sensing system they developed.
The main objective of this study is to demonstrate the possibility of in vitro closed-loop control of the DA concentration. To achieve this goal, the FSCV technique was used to measure the DA concentration in a continuous flow injection (CFI) cell. The measured value was then compared with a previously selected value (between 1 and 10 µmol/L), and the system made decisions to control infusion pumps to dynamically adjust the DA concentration in the CFI
cell. The physiological basal level concentration of dopamine is 10 nmol, with peaks of 1 micromol when dopaminergic neurons are triggered. Concentrations between 1 and 10 micromol were used in this system, which are in value above physiological peaks that provide higher immunity to noise that can interfere with the measurements. The system had the lexibility to control, within the range of the developed FSCV, the concentration of other substances, including other neurotransmitters, or to turn on transmagnetic stimulator (TMS) or DBS devices (Araujo and Abatti, 2012; Araujo et al., 2014).
Methods
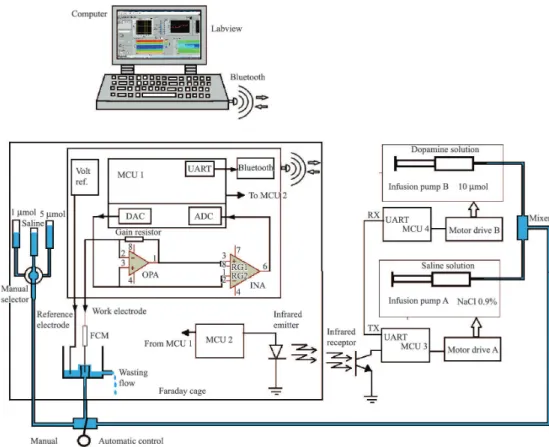
The closed-loop control system developed is presented in Figure 1.
FSCV Hardware
The FSCV was performed by a microcontroller that generated the signals applied to a carbon iber microelectrode (CFM). Speciically, a triangular voltage waveform from –0.4 to 1.0 V was used for each 9-ms cycle during, whereas the DA oxidation and reduction (REDOX) currents were registered by the device. The
Figure 1. The developed closed-loop control system. Volt ref.: voltage reference; MCU: microcontroller unit; DAC: digital-to-analog converter;
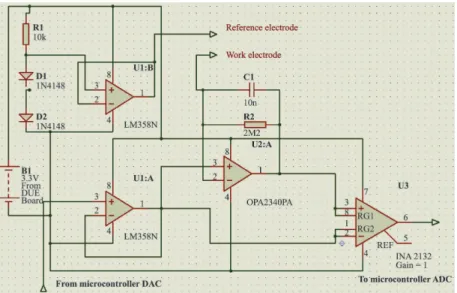
analog signal from the CFM resulting from REDOX consisted of a nanoampere current, which was ampliied by an OA (OPA 2340, Burr-Brown, Dallas, TX, USA) acting as current-to-voltage converter. The triangular signal itself was derived from the ADC (12 bits) of the Arduino board DUE (MCU 1) using a Microcontroller ARM Cortex-M3 32-bit SAM3x8E (Atmel) with a 84 MHz clock, applied in two OAs, such that the triangular signal was subtracted from the recorded signal using the INA 2132 (Burr-Brown). Then, the signal was converted in the 12-bit ADC module of the microcontroller, which was programmed in the C language. The digitized signal was sent to the microcontroller serial communication module that was connected to a wireless communication circuit (LMX9830, Texas Instruments, Bluetooth technology), as shown in Figure 2. The signals were captured by a dongle module on a desktop computer where the data were stored and processed (Araujo et al., 2014). The hardware was mounted in a plastic box, and a photo of the setup and the location of the experiments is shown in Figure 3.
Software for data acquisition
The data acquisition through serial communication allowed the user to conigure the communication speed, baud rate, port number and other parameters. A “Pattern Detection Function” (LabView) was used to select the current values transmitted and the indexed reading number (121 readings were performed per period). The frequency of voltammetry was approximately 3 Hz,
and the data were saved into a ile every 15 seconds. Most of the measured electric current was due to the capacitive characteristics of the CFM. This current, called the background current, could be stored at any instant of time and was removed from the raw data each reading.
Closed-loop control mode
A button enabled the system to operate in the closed-loop control mode (Figure 4). The measured values were compared with selected values, and the system made decisions to adjust the infusion pumps low rates in order to dynamically control the DA concentration. Optionally, light, sound, DBS and TMS could be selected to act independently or in a “multi-stimuli” mode, instead of the infusion pumps. In addition, the system had a slider to select the REDOX potential of interest and maximum and minimum concentration alarms. Digital graphics showed the discrete events.
Infusion pumps
Two infusion pumps were used with 30-ml syringes, one with saline solution (0.9% NaCl) and another containing DA (10 µmol/L). Table 1 shows the calibrated low rates of the infusion pumps.
The low rate of each pump was controlled by a microcontroller (MCU3 and MCU4) connected to a current drive to control the step motors of the infusion pumps (Insight, Brazil). Via Bluetooth, the
command to increase or decrease the low rate came from the computer (LabView) and then was sent by MCU 1, which communicated with MCU 2 through serial wiring. Communication between MCU 2 and MCU 3 was performed using an infrared link to ensure that the pumps did not introduce any noise to the measured signal. Note that the CFI cell was mounted inside a Faraday cage that is an enclosure
formed by a grid of copper to block external static and non-static electric ields (see Figure 3).
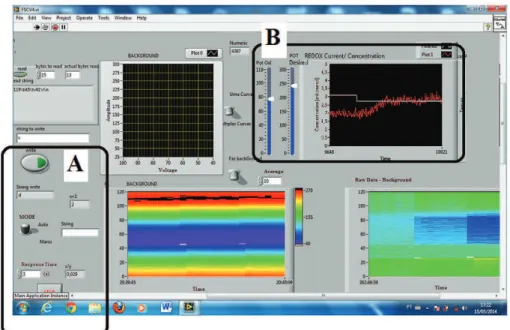
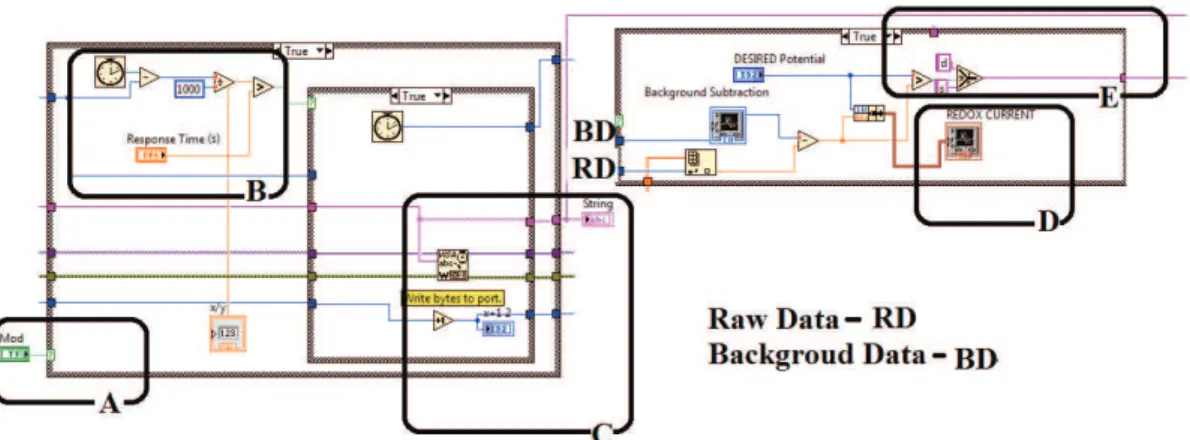
Figure 5 shows the main parts of the graphical programming, including the control mode (A), response time adjustment (B), infusion pumps command (C), output concentration chart (D), and the comparator (E).
Results
Measurements of different DA concentrations
The system was calibrated using DA solutions with known concentrations (1, 5 and 10 µmol/L). The background current in the experiments was approximately 80 nA, which was withdrawn by the data acquisition software, resulting, for instance, in an oxidation current of approximately 1 nA at a DA concentration of 1 µmol/L. The working range of the developed system was selected to be between 1 and 10 µmol/L, mainly due to the background noise and the hydraulic conditions of the CFI cell.
Figure 6 shows the graph for two different DA concentrations during manual system procedure
Table 1. Infusion pump low rates.
Level 0 1 2 3 4 5 6 7 8 9
Flow rate (mL.min–1) 0 0.25 0.55 0.81 1.15 1.45 1.89 2.31 2.70 3.05 Figure 4. The graphical user interface (GUI), where in A, the user selects the manual (manu) or closed-loop control (auto) using a button, and
in B, the user selects the oxidation current using a slider. Also in B, the selected (white line) and measured (red line) concentration values are displayed. Note that just above A there is a “string to write”, which the researcher can use to turn on stimulators such as a DBS or a TMS.
Figure 3. General overview of the system inside the Faraday Cage
(Figure 1). Initially, the saline solution illed the CFI cell. Then, alternately during 90 s (30 s each phase; due to the developed CFI cell hydraulic conditions, approximately 30 s is the time to completely replace the solution inside it by gravity) the CFI cell was illed with the DA solution (1 µmol/L), the saline solution, the DA solution (5 µmol/L), and inally with the saline solution again.
Closed-loop control
Figure 7 shows, in a sequence of images, an experiment where, starting at 5 µmol/L, the DA concentration was automatically adjusted to 7 µmol/L. The white line indicates the selected DA concentration, and the red line indicates the measured one. The system performed 3 measurements per second and sent control signals to the infusion pumps to adjust the DA concentration inside the CFI cell. Note that the concentration was dynamically controlled (7 +/– 0.8 µmol/L) with a period of approximately 80 s.
Figure 8 shows another experiment with the DA concentration adjusted to 2.7 µmol/L. The system was operated in the automatic mode.
Finally, because FSCV is usually presented using three-dimensional graphs (time versus voltage with the current shown in a color scale) [6-10], the system was designed to display the measured data using such a plot coniguration. Figure 9 shows the system response, in a three-dimensional plot, for values with a DA concentration of 4 µmol/L.
Discussion
The strategy in this system was to use the oxidation current that has its maximum characteristic value occurring at 700 mV for dopamine. The system had the lexibility to allow for measurements of currents at any voltage value within the range of FSCV, which also allowed searching for the characteristic peaks of other substances and neurotransmitters.
A closed-loop system to dynamically control DA the concentration inside a CFI cell has been described. The developed system allowed the DA concentration level to be selected between 1 and 10 µmol/L, controlling it within a +/– 0.8 µmol/L range with an oscillation period of approximately 80 s, after which the system stabilized. The system resolution was approximately 0.4 µmol/L for dopamine solutions. However, if necessary, the resolution can be increased by changing the gain of the OA current-to-voltage converter shown in the front-end analog board (Figure 2).
Although designed to control the DA concentration, the system can be used to control, within the range of the developed FSCV, the concentration of other substances or to turn on brain stimulators.
Figure 5. Main parts of the graphical programming. A: control mode (automatic or manual), B: the process response time (between 1 and
90 s), C: the output of bytes to write (d- down or s- up), D: the output concentration chart and E: the comparator (subtracted Background from Raw Data).
Figure 6. DA concentrations (A: 1 µmol/L and B: 5 µmol/L) with
Figure 7. Sequence showing the automatic control of the DA concentration. See a video of this and other experiments at https://www.youtube.
com/watch?v=e9qt4eOcZmU and https://www.youtube.com/watch?v=tVUgP1jjZiw .
Figure 8. DA concentration adjusted to 2.7 µmol/L with the system
operating in the automatic mode.
Figure 9. Three-dimensional FSCV graphic during automatic control.
The solution is automatically adjusted to 4 micromol (time 100) and stabilizes at time 300, remaining in this value until approximately time 650. Notable peaks at -0.17 volts (reduction) and +0.70 volts (oxidation) are observed. In fact, “time” is the scan number performed by FSCV.
The aims of this work were to develop an electrochemical system, a lexible software and a low-cost hardware to demonstrate the possibility of using of several types of stimuli to change the neurotransmitter concentrations in the brain. The classical approach with a controller (a sensor and an actuator) could be used in these types of problem. The results until now indicated that the system could be used in clinical studies (in vivo experiments).
Acknowledgements
We would like to give special thanks to André Oliveira, an engineer from National Instruments, for helping with the software development and to CNPq for inancial support.
References
Araujo CE, Abatti PJ, Da Cunha C, Gomez A, Dombrowoski PA. Instrumentação eletrônica para neuroquímica e estimulação cerebral. In: CBEB2014: Proceedings of the XXIV Congresso Brasileiro de Engenharia Biomédica; 2014 Oct 13-17; Uberlândia, Brazil. Rio de Janeiro: SBEB; 2014. p. 640-4.
Araujo CE, Abatti PJ. Estimulação seletiva de neurônio por bobina implantável. In: CBEB2012: Proceedings of the XXIII Congresso Brasileiro de Engenharia Biomédica; 2012 Oct 1-5; Porto de Galinhas, Brazil. Rio de Janeiro: SBEB; 2012. p. 850-3.
Basu I, Tuninetti D, Graupe D, Slavin KV. Adaptive control of deep brain stimulator for essential tremor: entropy-based tremor prediction using surface-EMG. In: Proceedings of the Annual International Conference of the IEEE Engineering Medical Biological Society; 2011; Boston, USA. Piscataway: IEEE Service Center; 2011. p. 7711-4. http://dx.doi.org/10.1109/IEMBS.2011.6091900. Chen Y, Hao HW, Hu YX, Li LM. Wireless wrist-wearable wake/sleep identification device for closed-loop deep brain stimulation. Electronics Letters. 2013; 49(7):452-3. http:// dx.doi.org/10.1049/el.2013.0382.
Garris PA, Ensman R, Poehlman J, Alexander A, Langley PE, Sandberg SG, Greco PG, Wightman RM, Rebec GV. Wireless transmission of fast-scan cyclic voltammetry at a carbon-fiber microelectrode: proof of principle. In: 10th International Conference on In Vivo Methods: Monitoring Molecules in Neuroscience; 2003 June 24-27; Stockholm, Sweden. Amsterdam: Elsevier; 2004. p. 103-15. http:// dx.doi.org/10.1016/j.jneumeth.2004.04.043.
Suppl 3):P35-42. http://dx.doi.org/10.1007/PL00007744. PMid:9808338
Kagohashi M, Nakazato T, Yoshimi K, Moizumi S, Hattori N, Kitazawa S. Wireless voltammetry recording in unanesthetised behaving rats. Neuroscience Research. 2008; 60(1):120-7. http://dx.doi.org/10.1016/j.neures.2007.09.011. PMid:17983679
Kalia SK, Sankar T, Lozano AM. Deep brain stimulation for Parkinson’s disease and other movement disorders. Current Opinion in Neurology. 2013; 26(4):374-80. http://dx.doi. org/10.1097/WCO.0b013e3283632d08. PMid:23817213 Kimble CJ, Johnson DM, Winter BA, Whitlock SV, Kressin KR, Horne AE, Robinson JC, Bledsoe JM, Tye SJ, Su-Youne Chang, Agnesi F, Griessenauer CJ, Covey D, Young-Min Shon, Bennet KE, Garris PA, Lee KH. Wireless instantaneous neurotransmitter concentration sensing system (WINCS) for intraoperative neurochemical monitoring. In: Proceedings of the Annual International Conference of the IEEE Engineering Medical Biological Society; 2009; Minneapolis, USA. Piscataway: IEEE Service Center; 2009. p. 4856-9. http://dx.doi.org/10.1109/IEMBS.2009.5332773. Lee J, Rhew HG, Kipke DR, Flynn MPA. A 64 channel programmable closed-loop neurostimulator with 8 channel neural amplifier and logaritmic ADC. IEEE Journal of Solid-State Circuits. 2010; 45(9):1935-45. http://dx.doi. org/10.1109/JSSC.2010.2052403.
Poustinchi M, Musallam S. Low power CMOS neurochemical biosensor application in an implantable intelligent neurotrophic factor delivery hybrid microsystem for Parkinson’s. In: Middle East Conference on Biomedical Engineering; 2014 Feb 17-20; Doha, Qatar. Piscataway: IEEE Service Center; 2014. p. 131-4. http://dx.doi.org/10.1109/MECBME.2014.6783223. Rascol O, Lozano A, Stern M, Poewe W. Milestones in Parkinson’s disease therapeutics. Movement Disorders. 2011; 26(6):1072-82. http://dx.doi.org/10.1002/mds.23714. PMid:21626552
Robinson DL, Venton BJ, Heien ML, Wightman RM. Detecting subsecond dopamine release with fast-scan cyclic voltammetry in vivo. Clinical Chemistry. 2003; 49(10):1763-73. http://dx.doi.org/10.1373/49.10.1763. PMid:14500617 Rotenberg A, Muller P, Birnbaum D, Harrington M, Riviello JJ, Pascual-Leone A, Jensen FE. Seizure suppression by EEG-guided repetitive transcranial magnetic stimulation in the rat. Clinical Neurophysiology. 2008; 119(12):2697-702. http:// dx.doi.org/10.1016/j.clinph.2008.09.003. PMid:18977170
Schapira AH, Jenner P. Etiology and pathogenesis of Parkinson’s disease. Movement Disorders. 2011; 26(6):1049-55. http://dx.doi.org/10.1002/mds.23732. PMid:21626550 Shon YM, Chang SY, Tye SJ, Kimble CJ, Bennet KE, Blaha CD, Lee KH. Comonitoring of adenosine and dopamine using the Wireless Instantaneous Neurotransmitter Concentration System: proof of principle. Journal of Neurosurgery. 2010; 112(3):539-48. http://dx.doi.org/10.3171/2009.7.JNS09787. PMid:19731995
Stanslaski S, Afshar P, Cong P, Giftakis J, Stypulkowski P, Carlson D, Linde D, Ullestad D, Avestruz AT, Denison T. Design and validation of a fully implantable, chronic, closed-loop neuromodulation device with concurrent sensing and stimulation. IEEE Transactions on Neural Systems and Rehabilitation Engineering. 2012; 20(4):410-21. http:// dx.doi.org/10.1109/TNSRE.2012.2183617. PMid:22275720 Stanslaski S, Cong P, Carlson D, Santa W, Jensen R, Molnar G, Marks WJ, Shafquat A, Denison T. An implantable bi-directional brain-machine interface system for chronic neuroprosthesis research. In: Proceedings of the Annual International Conference of the IEEE Engineering Medical Biological Society; 2009 Sept 3-6; Minneapolis, USA. Piscataway: IEEE Service Center; 2009. p. 5494-7. http:// dx.doi.org/10.1109/IEMBS.2009.5334562.
Takmakov P, McKinney CJ, Carelli RM, Wightman RM. Instrumentation for fast-scan cyclic voltammetry combined with electrophysiology for behavioral experiments in freely moving animals. The Review of Scientific Instruments. 2011; 82(7):074302. Epub 2011 July 26. http://dx.doi. org/10.1063/1.3610651. PMid:21806203
Volkmann J, Albanese A, Antonini A, Chaudhuri KR, Clarke CE, de Bie RM, Deuschl G, Eggert K, Houeto JL, Kulisevsky J, Nyholm D, Odin P, Østergaard K, Poewe W, Pollak P, Rabey JM, Rascol O, Ruzicka E, Samuel M, Speelman H, Sydow O, Valldeoriola F, van der Linden C, Oertel W. Selecting deep brain stimulation or infusion therapies in advanced Parkinson’s disease: an evidence-based review. Journal of Neurology. 2013; 260(11):2701-14. http://dx.doi. org/10.1007/s00415-012-6798-6. PMid:23287972 Wirdefeldt K, Adami HO, Cole P, Trichopoulos D, Mandel J. Epidemiology and etiology of Parkinson’s disease: a review of the evidence. European Journal of Epidemiology. 2011; 26(1, Suppl 1):S1-58. http://dx.doi.org/10.1007/s10654-011-9581-6. PMid:21626386
Authors
Carlos Eduardo de Araujo1*, Paulo José Abatti2, Cláudio Da Cunha3, Alexander Gómez3, Patrícia Andréia Dombrowski3
1Instituto Federal do Paraná – IFPR, Av. Victor Ferreira do Amaral, 306, 3º andar, Tarumã, CEP 82530-230, Curitiba, PR,
Brazil.
2Universidade Tecnológica Federal do Paraná – UTFPR, Curitiba, PR, Brazil.