DOI: http://dx.doi.org/10.1590/2446-4740.0524
*e-mail: cffci [email protected]
Received: 13 February 2014 / Accepted: 21 January 2015
Automatic identii cation of tuberculosis mycobacterium
Cicero Ferreira Fernandes Costa Filho*, Pamela Campos Levy, Clahildek de Matos Xavier, Luciana Botinelly Mendonça Fujimoto, Marly Guimarães Fernandes Costa
Abstract Introduction: According to the Global TB control report of 2013, “Tuberculosis (TB) remains a major global health problem. In 2012, an estimated 8.6 million people developed TB and 1.3 million died from the disease. Two main sputum smear microscopy techniques are used for TB diagnosis: Fluorescence microscopy and conventional microscopy. Fluorescence microscopy is a more expensive diagnostic method because of the high costs of the microscopy unit and its maintenance. Therefore, conventional microscopy is more appropriate for use in developing countries. Methods: This paper presents a new method for detecting tuberculosis bacillus in conventional sputum smear microscopy. The method consists of two main steps, bacillus segmentation and post-processing. In the i rst step, the scalar selection technique was used to select input variables for the segmentation classii ers from four color spaces. Thirty features were used, including the subtractions of the color components of different color spaces. In the post-processing step, three i lters were used to separate bacilli from artifact: a size i lter, a geometric i lter and a Rule-based i lter that uses the components of the RGB color space. Results: In bacillus identii cation, an overall sensitivity of 96.80% and an error rate of 3.38% were obtained. An image database with 120-sputum-smear microscopy slices of 12 patients with objects marked as bacillus, agglomerated bacillus and artifact was generated and is now available online. Conclusions: The best results were obtained with a support vector machine in bacillus segmentation associated with the application of the three post-processing i lters.
Keywords: Tuberculosis, Automatic bacillus identii cation, Neural network, Support vector machine.
Introduction
The World Health Organization publishes an annual report on the global control of tuberculosis (TB) with the purpose of providing a comprehensive and up-to-date assessment of the TB epidemic. According to the Global TB control report of 2013 (World…, 2013), “Tuberculosis (TB) remains a major global health problem. In 2012, an estimated 8.6 million people developed TB and 1.3 million died from the disease (including 320 000 deaths among HIV-positive people). The number of TB deaths is unacceptably large given that most are preventable.”
The Millennium Development Goals (MDGs) were proposed by the United Nations Development Programme (United…, 2010) and adopted by world leaders in 2000. They provide concrete, numerical benchmarks for extreme poverty and its many dimensions and aim to be achieved by 2015. The program identii es 8 millennium development goals with 21 targets that are measured by 60 indicators. TB falls under the 6th goal related to i ghting disease epidemics, aiming to “Combat HIV/AIDS, Malaria and other diseases”. Within this goal, the following target refers to TB: “Halt and begin to reverse the incidence of malaria and other major diseases”. Related to this
target, the following indicators refer to TB: “halt and begin to reverse TB incidence by 2015; reduce prevalence and deaths of TB by 50% compared to the 1990 baseline”.
To achieve these goals, the WHO adopted a Partnership Global Plan to Stop TB (World…, 2010), launched in January 2006, which includes smear sputum microscopy as the main diagnostic tool. One of the targets of this plan is “A treatment success rate among sputum smear positive cases of 90%”. Sputum smear microscopy is the main non-invasive technique employed for TB diagnosis. Other non-invasive techniques include culture and chest radiography.
There are two main reasons why sputum smear microscopy is appropriate for TB diagnosis. Special dyes allow for differentiating the bacillus from the background, and there is a positive correlation between the number of bacilli in the smear and the probability of them being identii ed by microscopy (David, 1976, as cited in Toman, 2004a).
Two techniques are used for TB diagnosis with sputum smear microscopy: l uorescence microscopy and conventional microscopy. Fluorescence microscopy uses an acid-fast l uorochrome dye (e.g., auramine O
or auramine-rhodamine) and an intense light source, such as a halogen or high-pressure mercury-vapor lamp. Conventional microscopy uses the carbolfuchsin Ziehl-Neelsen - ZN or Kinyoun acid-fast stains and a conventional artiicial light source.
Fluorescence microscopy has several advantages over conventional microscopy. Fluorescence microscopy uses a lower-power objective lens (typically 25x), whereas conventional microscopy uses a higher-power objective lens (typically 100x). Fluorescence microscopy allows the identical area of a smear to be scanned in a much shorter time than conventional microscopy (Bennedsen and Larsen, 1966); Fluorescence microscopy is approximately 10% more sensitive than conventional microscopy (Steingart et al., 2006).
The main shortcomings of luorescence microscopy are the high costs of the microscopy unit and its maintenance and the advanced technical skills required for handling and maintenance of the optical equipment (Toman, 2004b).
The sensitivity of tuberculosis diagnosis through sputum smear analysis reported in the literature varies greatly. Reported sensitivities of conventional microscopy range from 0.32 to 0.94, and reported sensitivities of luorescence microscopy range from 0.52 to 0.97. The speciicity of luorescence microscopy is similar to that of conventional microscopy and ranges from 0.94 to 1.0 (Steingart et al., 2006).
In addition to the large variability in sensitivity, the manual screening for bacillus identiication is a labor-intensive and time-consuming task that takes between 40 minutes and3 hours, depending on the patient’s level of infection. Approximately 40-100 images must be analyzed (Sotaquirá et al., 2009). Automatic methods for bacillus screening were irst developed for luorescence microscopy images (Veropoulos et al., 1998; Forero et al., 2003). The irst methods for automatic bacillus screening in conventional microscopy were published in 2008 (Costa et al., 2008; Sadaphal et al., 2008; Raof et al., 2008). Recently, other methods for automatic bacillus screening were published (Forero et al., 2004, 2006; Khutlang et al.,
2010; Lenseigne et al., 2007; Makkapati, et al., 2009; Osman et al., 2012; Sotaquirá et al., 2009).
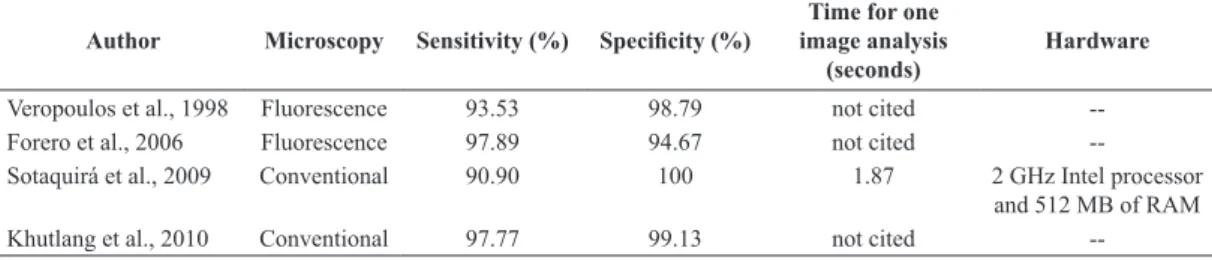
Some authors (Forero et al., 2006; Khutlang et al., 2010; Sotaquirá et al., 2009) claim that the advantages of automatic bacillus screening over a manual screening include more reproducible values for sensitivity and speciicity and a faster screening process. Table 1 reports the values for sensitivity, speciicity and time waste for one image analysis using automatic methods.
The sensitivity and speciicity values previously cited for manual screening methods refer to tuberculosis diagnosis. The sensitivity and speciicity values for automatic methods shown in Table 1 refer to object classiication as bacillus or not bacillus. A rigorous comparison of sensitivities and speciicities between manual and automatic screening methods is not available. A rigorous performance comparison between automatic methods is not possible because different image databases are used in each report.
As shown in Table 1, only one report (Sotaquirá et al, 2009) cited time wasted for image analysis. It is necessary to consider the number of images required to achieve a correct diagnosis to compute the time consumed with a TB automatic diagnosis. It is necessary to analyze between 20 and 100 ields of one slide to achieve a correct diagnosis. With an automatic procedure, it is also necessary to calculate the time spent on focusing computations, image acquisition and microscopy displacement. According to Santos (Santos et al., 1997), focusing computations takes 1.8s per ield and acquisition takes 0.7s, including 0.5s for slide movement. Assuming that no parallel processes occur, and considering the maximum of 100 images, we calculate time spent for an automatic diagnosis according to Equation 1:
( )
100 1,87 1.8 0.7 7 min
ad
T = x + + ≅
(1)
This value is sometimes less than the 40 minutes required for a TB manual diagnostic with sputum smear microscopy.
In luorescence microscopy images, the bacilli are easily separated from the background with a threshold operation. The segmentation is performed using edge detection operators, such as a Canny edge
Table 1. Sensitivity, speciicity and time for one image analysis.
Author Microscopy Sensitivity (%) Speciicity (%) image analysis Time for one
(seconds) Hardware Veropoulos et al., 1998 Fluorescence 93.53 98.79 not cited
--Forero et al., 2006 Fluorescence 97.89 94.67 not cited
--Sotaquirá et al., 2009 Conventional 90.90 100 1.87 2 GHz Intel processor
--detector (Veropoulos et al., 1998; Forero et al., 2004). Intermediate steps for edge linking and boundary tracing are also employed.
In conventional microscopy images, the bacilli are not easily separated from the background by a pixel intensity threshold operation. Histogram-based techniques, Bayesian pixel classiiers and KNN pixel classiiers are the main approaches for bacillus segmentation in the literature. These approaches use color space components as input variables. Khutlang et al. (2010) uses the RGB color space but did not justify their choice. Sotaquirá et al. (2009) analyzed the following color spaces: RGB, YCbCr, Lab, YIQ and HSV. From this analysis, the authors conclude that RGB, HSV and YIQ are not adequate because they generate a high number of false positives after the segmentation stage. YcbCr and Lab reported better results. No author has combined components of different color spaces in the segmentation step. In this paper, we propose combining components of different color spaces.
For separating bacilli from artifacts in a post-processing step, all authors use bacillus geometric characteristics. We improve this step by adding a Rule-based ilter that uses the components of the RGB color space. This ilter uses a new parameter, the color ratio (CR), which combines color information from pixels
belonging to bacillus and to its neighbor.
This paper proposes a new method for bacillus identiication in sputum smear microscopy with the following novel features:
• The input variables for the segmentation were selected combining components of different color spaces: RGB, HSI, YCbCr and Lab. • In bacillus segmentation, two classiiers were
compared with each set of input variables: neural networks and support vector machines (SVM).
• In the post-processing step, a new ilter based on rules is used to separate the bacilli from other artifacts in addition to geometric characteristics. This ilter uses a new parameter proposed in this paper called the color ratio.
As demonstrated in this study, the sputum smear images can be divided in two groups according to the density of background: high-density background (HDB) images and low-density background (LDB) images. The HDB group is characterized by a strong presence of methylene blue counter stain in the background, and the LDB group is characterized by a weak presence of this same counter stain. In this study, we compare the behavior of the proposed bacillus identiication method, when applied to these two different image groups.
Methods
The methodology for bacillus identiication is composed of the following steps: image acquisition, segmentation and post-processing. In the segmentation step, two techniques were investigated: SVM and neural network classiiers. The input variables of these classiiers are combinations of pixel color characteristics selected from 4 color spaces. The best characteristics were selected by a scalar feature selection technique. The outputs of the segmentation step are objects that could be bacilli or artifacts. The goal of the post-processing step is to eliminate the objects considered artifacts. This task was accomplished by a sequence of three iltering processes.
Image acquisition
A total of 120 sputum smear images were acquired. The samples, from 12 patients, were prepared in the Laboratory of the Instituto Nacional de Pesquisas da Amazonia (INPA), Manaus, Brazil, using the Kinyoun acid-fast stain and counterstained with methylene blue solution. The images were captured using a digital camera model Canon Power Shot A640 of 10 megapixels. The microscope used was a Zeiss Axioskop 40 with a magniication of 100x and numerical aperture of 1.25. The PC had a Core 2 Duo processor 2.0 GHz with 3GB RAM attached to a conventional microscope model Zeiss Axioskop 4. The spatial resolution of the images is 2816x2112 pixels. The image focus was established in a previous study (Kimura et al., 2010).
Image groups
In a previous study (Costa Filho et al., 2012; Kimura et al., 2010), we veriied that the density of background content inluences the focus of the image by a quantitative analysis. In images with high-density background (HDB) content, the best focus measure was the variance. The best focus measure was the entropy for images with low-density background (LDB) content.
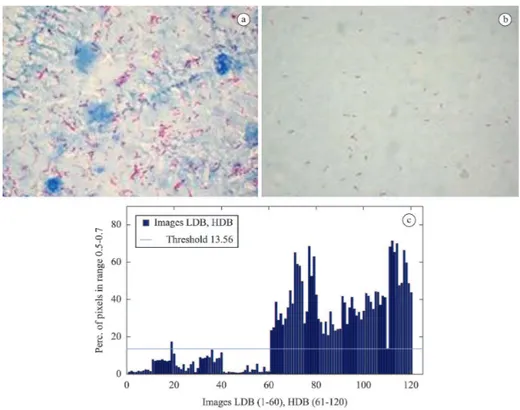
The HDB group is characterized by a strong presence of counter stain with methylene blue solution in the background. The LDB group is characterized by a weak presence of this same counter stain. Figure 1 shows image examples extracted from the two groups. There is a prevalent blue color in the background of the HDB images and a prevalent white color in the background of the LDB images.
obtained. To illustrate this evaluation, Figure 1(c) shows a bar graph of the 120 acquired images, in which the vertical axis corresponds to the number of image pixels (%) whose H component is in the range 0.5 to 0.7. The graph depicts that an experimental threshold value can be obtained to separate the images into two groups. This threshold value, 13.56, is shown as a horizontal line in Figure 1(c). When the bar value was less than this threshold value, the image was assigned to the LDB group. When the bar value was higher than this threshold value, the image was assigned to the HDB group.
A visual inspection of the images shown in Figure 1 revealed that the strong presence of counter stain with methylene blue solution in the background of the HDB images produces more artifacts than the LDB images. In this study, we compare the behavior of the proposed bacillus identiication methods when applied to these two different image groups.
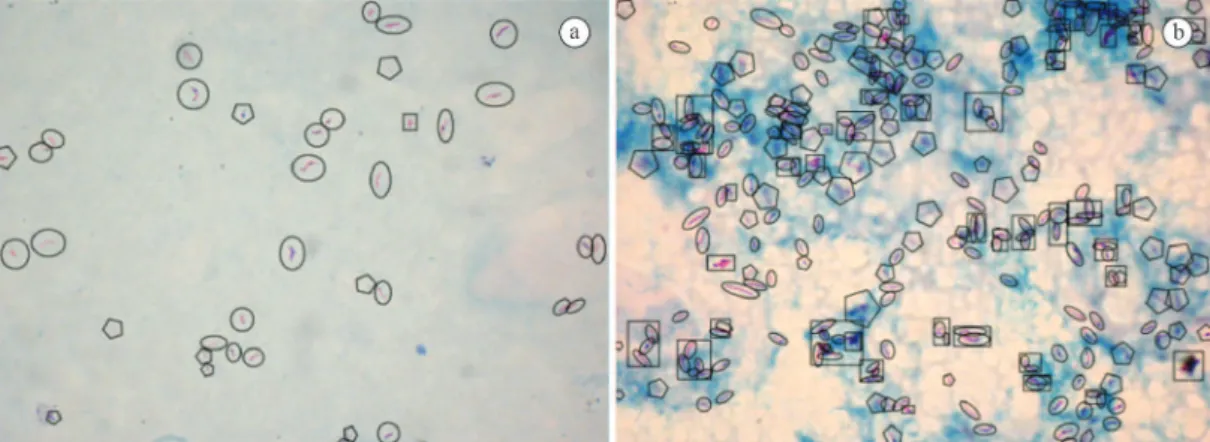
In the 120 images, the identiied objects were enclosed within a geometric shape by two researchers guided by a pathologist. A true bacillus was enclosed
in a circular or oval shape. An agglomerated bacillus was enclosed by a rectangle and a doubtful bacillus (the image focus or the geometry did not permit a clear identiication of the object) was enclosed by a polygon. These marked objects were the standards used to calculate the accuracy, sensitivity and speciicity of bacillus recognition. The doubtful bacilli and the agglomerated bacilli (it is not possible to know how many bacilli there are in one agglomeration) were not taken into account for these calculations. Figure 2 depicts examples images in which objects were marked as previously described.
Characteristic selection for segmentation
The features used for pixel classiication in the segmentation step were the components and the subtraction of components of the following color spaces: RGB, HSI, YCbCr and Lab. A set, F, of 30 features was used: F = {R, G, B, R-B, R-G, G-B, ~R, ~G, ~B, H, S, I, H-S, H-I, S-I, R-I, G-I, B-I, Y, Cb, Cr, Y-Cb, Y-Cr, Cb-Cr, L, a, b, L-a, L-b, a-b}.
The scalar feature selection technique was used to select the best features.
This “ad-hoc” technique contains information from combined correlation and adapted criteria for scalar characteristics. The choice of scalar feature selection over vectorial feature selection was because of the computational complexity of vectorial feature selection. As described by Theodoridis and Koutroumbas (2009), the scalar feature selection is divided into three parts:
1. Select the irst characteristic using a class separation measurement. In this study, Fisher´s Discriminant Ratio (FDR) was used. FDR is described in Equaion 2:
( )2
1 2
2 2
1 2
k k k
k k
FDR = µ − µ
σ + σ
(2)
where
1, 1
k k
µ σ : mean value and standard deviation of characteristic xk in class w1 .
2, 2
k k
µ σ : mean value and standard deviation of
characteristic xk in class w2.
Classes w1 and w2 represent pixels belonging to the
background and pixels belonging to bacilli. The
value FDRk of is calculated for each characteristic k
x,k= …1, , .m The characteristic xk with higher FDRk is
selected. This is the xs1 characteristic.
2. To select the second characteristic, xs2, the cross correlation coeficient is used between the two characteristics, xiand xjdeined in
Equaion 3.
1
2 2
1 1
N n ni nj ij N N
n ni n nj x x x x
=
= =
∑ ρ =
∑ ∑
(3)
whereN = total number of patterns belonging to
classes w1 and w2.
ni
x andxnj: values of ith and jth characteristic of
pattern n.i,j=1,…, m
The second characteristic in the characteristic xs2that
maximizes Equaion 4:
1FDRs2 2 s s1 2, for all s 2 s1
α − α ρ ≠
(4)
α1 and α2 express the importance of the irst and second terms, in selecting the second-best characteristic. In this work, α1= α2 =0.5.
3. Other selected characteristics,
x
sk, k=3,…,m, are those that maximize the Equaion 5:1 2 1
1
1
k sk srsk
r FDR
k
− =
α
α − − ∑ρ
(5)
From each of the 120 images, 20 pixels belonging to bacilli and 20 pixels belonging to the background were extracted for the application of this technique. Sets with 4,5,6,7 and 8 features were produced. The set with four selected features is {G-I, L-a, Y-Cr, a}. The set with ive selected features is {G-I, L-a, Y-Cr, a, R-G}. The set with six selected features is {G-I, L-a, Y-Cr, a, R-G, H-I}. The set with seven selected features is {G-I, L-a, Y-Cr, a, R-G, H-I, a-b}. The set with eight selected features is {G-I, L-a, Y-Cr, a, R-G, H-I, a-b, H}.
Bacillus segmentation
In the segmentation step, the pixels are classiied as belonging to bacilli or background. Two classiication methods were employed: support vector machines (SVM) and feedforward neural networks. A total of 1,200 pixels belonging to bacilli and 1,200 pixels belonging to the background were used in the training set. These pixels were extracted from all 120 images.
SVM separates patterns belonging to two classes deining one hyperplane that maximizes the separating margin between these two classes (Haykin, 1999). According to Theodoridis and Koutroumbas (2009), the hyperplane parameters that maximize the separating
margin are the weight vector w and polarization that
minimizes Equaion 6 and satisies Equaion 7:
( ) 2
0
1 ,
2
J w w = w
(6)
(
0)
1, 1, 2,T i i
y w x+w ≥ =i …N
(7)
where N = number of pixels to be classiied. For non-separating classes, the identical parameters could be determined, minimizing the Equaion 8, in which new variables, ξiknown as slack variables,
are introduced. The optimizing task becomes more complex. The goal now is to make the margin as large as possible but simultaneously keep the number of points with ξ > 0 as small as possible.
( ) 2
0
1
1 , ,
2
N i i J w w w C
=
ξ = + ∑ξ
(8)
The C parameter in Equaion 7 is a positive constant that controls the relative inluence of the two competing terms. The C parameter values used in this work were 0.2, 0.4, 0.8, 1.6, 3.2, 6.4, 25.6, 51.2 and 102.4.
SVMs use kernels for mapping characteristic vectors as a large dimension space vector in which classes could be separated by hyperplanes. The following kernels were used in this work in association with the SVM classiier: linear, polynomial, radial, quadratic and multilayer perceptron.
Combining the C parameter values and kernels, 250 simulations were used to obtain the best SVM classiier.
The second classiier was a feedforward neural network, more speciically, a three layer neural network,
n – m-1. To adjust the best architecture, a total of
180 simulations, combining different values for n and m in the set {3,6,9,12,15,18}, were performed. The
training algorithm was back propagation associated with the Levenberg-Marquardt acceleration method. The convergence criterion was a quadratic error less than.
A total of 2,456 bacilli had been identiied by the pathologist in the set of 120 images (the gold standard). When the classiier identiies an object as a bacillus and this classiication is equal to that taken by the specialist, a true positive case occurs. Otherwise, a false positive case occurs (the object is classiied as bacillus but, in fact, is not).A total of 2,456 bacilli were identiied by the pathologist in the set of 120 images (the standard). A true positive case occurs when the classiier identiies an object as a bacillus, and this classiication is equal to that taken by the specialist. Otherwise, a false positive case occurs (the object is incorrectly classiied as a bacillus).
Post-processing
The outputs of the previous step are objects that could be bacilli or artifacts. The goal of the post-processing step is to eliminate the objects considered artifacts. This task was accomplished by applying the following ilters: ilter 1 – a size ilter that removes objects with large areas (agglomerated bacillus) and small areas (artifacts); ilter 2 – a geometric ilter that eliminates objects based on its eccentricity and ilter 3 – a Rule-based ilter that uses components of the RGB color space.
Filter 1: size ilter
This iltering process removes objects larger than 150 pixels (agglomerated bacilli) and smaller than 20 pixels (small artifacts).
Filter 2: geometric ilter
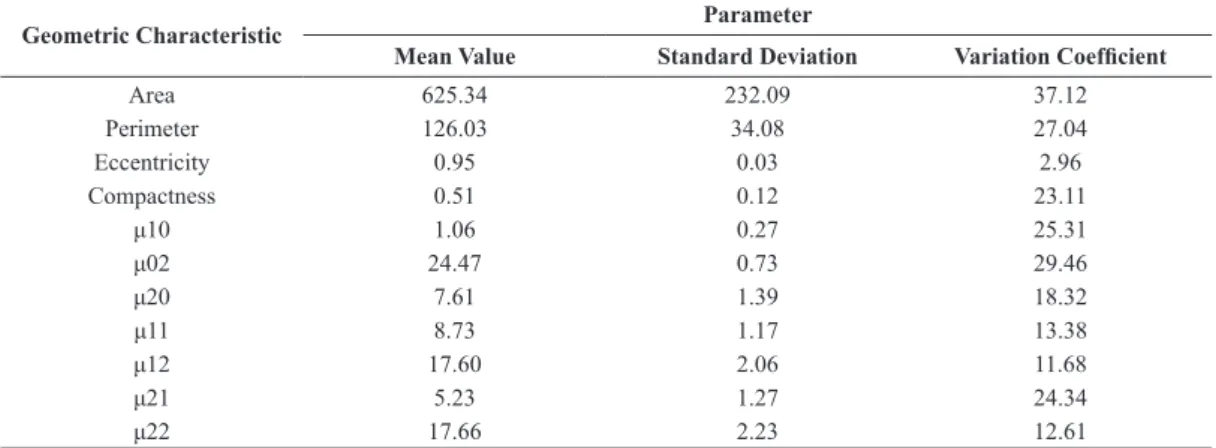
The following geometric characteristics were investigated to choose the best characteristic for the geometric ilter: area, perimeter, compactness, eccentricity and Hu moments of the irst and second order: .
The contours of 500 bacilli were extracted, and the following parameters were calculated for each one of these geometric characteristics: mean value (η), standard deviation (σ) and variation coeficient (ν). The variation coeficient is deined by Equaion 9:
.100
v=σ
η
(9)
Table 2 depicts the computed parameter values for all considered geometric characteristics. The best geometric characteristic was the one with the lowest value. The geometric characteristic used by ilter 2 was the eccentricity. A threshold value for eccentricity (0.77) that minimizes the false positive cases was experimentally obtained. Objects with eccentricity higher than 0.77 were considered bacilli, and objects with eccentricity lower than 0.77 were considered artifacts.
Filter 3: rule-based ilter
The Rule-based ilter uses the Color Ratio (CR)
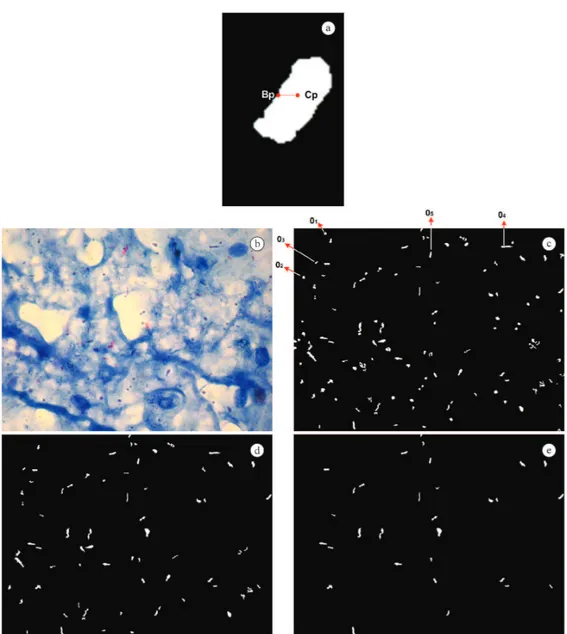
parameter. Figure 3 is used to deine the CR parameter.
In this igure, two points, Cp and Bp, are initially
determined. The irst corresponds to the centroid or the geometric center of the bacillus (xCp, yCp). The
location of point Bp(xBp, yBp) is obtained as follows: 1.
Determine whether the bacillus major axis is horizontal or vertical; 2. If the bacillus major axis is vertical, Bp corresponds to a background pixel, 4-neighbor of a pixel bacillus, located on the identical row of the geometric center of the bacillus, xCp, to the left or right;
3. Otherwise, Bp corresponds to a background pixel, 4-neighbor of a pixel bacillus, located on the identical column of the geometric center of the bacillus, yCp,
above or below it. Figure 3(a) illustrates a bacillus in which the major axis is vertical and Bp was chosen on the left side (or right side) of the centroid point.
The proposed CR parameter is deined by Expression
10. CR is the ratio of the difference in intensity of the
red and green components, as shown in Expressions 11 and 12.
R G dif CR
dif
=
(10)
R Cp Bp
dif =R −R
(11)
G Cp Bp
dif =G −G
(12)
where RCp- value of Red component in pointCp. RBp- value of Red component in point Bp. GCp- value of Green component in point Cp. GBp- value of Green component in point Bp.
The following rules are used to determine whether an object is a bacillus or an artifact:
if RCp> GCp and RCp> BCp
object is bacillus
elseif RCp> GCp and RCp< BCp if difR> 0 and difG> 0 and CR> 2
object is a bacillus elseif difR> 0 and difG> 0
object is a bacillus
elseif difR< 0 and difG< 0 and CR< 0.5
object is a bacillus else
object is not an artifact elseif RCp< GCp and RCp< BCp
object is not an artifact
Because of the Kinyoun acid-fast stain, when a bacillus is over a white background (with a weak presence of counter stain with methylene blue solution), its color appears as light fuchsia. When the bacillus is over a blue background (with the strong presence of a counter stain with methylene blue solution), its color appears to be dark purple. In the irst case, there is a predominance of the red component over the green and blue components. In the second case, there is a predominance of the blue component over the other two components. The red component is predominant over the green component. These observations are explored and summarized with the Rule-based ilter.
The following igures demonstrate the application of the post-processing step: Figure 3(b) is an original image; Figure 3(c) depicts the output of post-processing step after applying the size ilter; Figure 3(d) depicts the output of the post-processing step after applying the size ilter + the geometric ilter; Figure 3(e) depicts the output of post-processing step after applying the size ilter + the geometric ilter + the Rule-based ilter. Figure 3(c) shows ive marked objects: O1 and
O2 – these objects are not bacilli and are eliminated with a geometric ilter; Objects O3 and O4 – these objects are not bacilli and are eliminated only with the Rule-based ilter; O5 – bacillus and is not eliminated
with any of the ilters. Figure 4(a), Figure 4(b) and Table 2. Mean value, Standard Deviation and Variation Coeficient used to design the geometric ilter in the post-processing step.
Geometric Characteristic Parameter
Mean Value Standard Deviation Variation Coeficient
Area 625.34 232.09 37.12
Perimeter 126.03 34.08 27.04
Eccentricity 0.95 0.03 2.96
Compactness 0.51 0.12 23.11
μ10 1.06 0.27 25.31
μ02 24.47 0.73 29.46
μ20 7.61 1.39 18.32
μ11 8.73 1.17 13.38
μ12 17.60 2.06 11.68
μ21 5.23 1.27 24.34
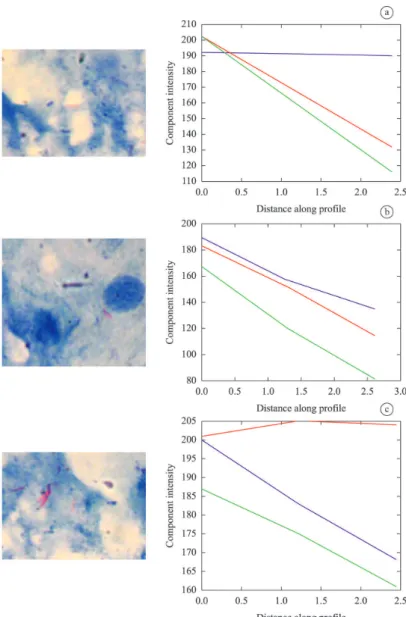
Figure 4(c) show an intensity proile of the RGB components of the objects: O3, O4 and O5 . In each graph, the coordinate x = 0 corresponds to point Bp and
the right coordinate of the graph corresponds to Cp.
Values of difR , difG and CR for object O3 were –65,
–85 and 0.76, respectively. Values of difR, difG,and CR
for object O4 were –62, –86 and 0.72, respectively.
Results
Two result sets are reported. The first set demonstrates the segmentation step. The second result set demonstrates bacillus identiication after the post-processing step.
The segmentation classiiers are used to separate the pixels into two classes, bacilli or background. Table 3 reports the accuracy, sensitivity and speciicity of both segmentation classifiers used in pixel classiication, neural network and SVM. The best values are obtained with the SVM classiier (Table 3). The best neural network performance was obtained with architecture 18-3-1 and ive features as input characteristics. The best performance of the SVM was obtained with a quadratic kernel, C parameter
equal to 1.6, and 7 features as input variables.
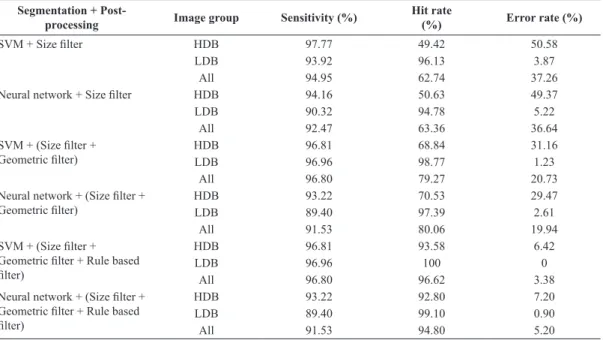
The results of bacillus detection after applying the post-processing step are shown in Table 4. Six different types of results are shown, depending on the
segmentation classiier and post-processing iltering process used: SVM classiier + size ilter; Neural network classiier + size ilter; SVM classiier + (size ilter + geometric ilter); Neural network classiier + (size ilter + geometric ilter); SVM classiier + (size ilter + geometric ilter + Rule-based ilter); Neural network classiier + (size ilter + geometric ilter + Rule-based ilter).
Figure 4. Object with corresponding RGB proile (a) object O3; (b) object O4; (c) object O5.
Table 3. Results of pixel classiication in the segmentation step.
Classiier Set Accuracy Sensitivity Speciicity SVM Training 93.08 93.58 92.58
Testing 93.25 93.75 92.75 Neural
network Training 90.87Testing 91.45 92.75 89.0093.41 89.50
Discussion
This work presents a new method for bacillus identiication. The following points summarize the differences between this method and those previously presented in literature:
• Features used as input of segmentation classiiers were selected from four color spaces: RGB, HSI, YCbCr and Lab. A total of 30 features were used. Combinations of components from different color spaces, such as G-I, and from the identical color space (e.g., L-a, Y-Cr, R-G, H-I, a-b) were examined.
(Sotaquirá et al., 2009; Makkapati et al., 2009; Khutlang et al., 2010). This paper proposes using a new iltering process, the Rule-based ilter.
The proposed method characterizes the sputum smear images that analyze the H component of the HSI color space of the image’s pixels. This method identiies two groups of images: high-density background (HDB) and low-density background (LDB).
As shown in Table 4, the error rates obtained in bacillus detection are much lower for the LDB images. The sensitivity values obtained for the HDB images were higher than those obtained for the LDB images. The hit rate obtained with the LDB images was higher than that obtained with the HDB images.
The results obtained with the association of the three ilters were improved compared to those obtained with the size ilter and with the association of the size ilter and the geometric ilter. When using the three ilters with the LDB images, the error rate decreases to 0% and lower than 4% for all images.
The best sensitivity, 96.80%, was obtained using the SVM classiier in the segmentation step and three iltering processes in the post-processing step, with an error rate of 3.38%. Khutlang et al. (2010) reported a sensitivity of 97.77%. Sotaquirá et al. (2009) reported a false positive rate of 9.78%.
The area of automatic tuberculosis diagnosis does not have an image database of sputum smear microscopy slices available. A rigid comparison between sensitivities and error rates between different methods was not possible because each author used a
proprietary image database with a different specialist identifying objects as bacillus or artifact.
We generated an image database with 120-sputum-smear images from 12 patients with objects marked as bacillus, agglomerated bacillus and artifact. This database is now available at
http://www.tbimages.ufam.edu.br. This database could
be used by other authors to establish a comparison between different methods in bacillus recognition. Future work includes an improved image database funded by FAPEAM.
Acknowledgements
We would like to thank FAPEAM and CNPq (process 470972/2011-4) for the inancial support. We also thank Academic English Solutions.com for revising the text.
References
Bennedsen J, Larsen SO. Examination for tubercle bacili by fluorescence microscopy. Scandinavian Journal of Respiratory Diseases 1966; 47(2):114-20. PMid:4161476. Costa MGF, Costa Filho CFF, Sena JF, Salem J, Lima MO. Automatic identification of mycobacterium tuberculosis with conventional light microscopy. In: Proceedings of 30th Annual International Conference of the IEEE Engineering in Medicine and Biology Society; 2008. p. 382-5. Costa Filho CFF, Costa MGF, Kimura Junior A. Autofocus functions for tuberculosis diagnosis with conventional sputum smear microscopy. In: Méndez-Vilas, A. editor. Table 4. Results of bacillus identiication after post-processing.
Segmentation +
Post-processing Image group Sensitivity (%) Hit rate(%) Error rate (%)
SVM + Size ilter HDB 97.77 49.42 50.58
LDB 93.92 96.13 3.87
All 94.95 62.74 37.26
Neural network + Size ilter HDB 94.16 50.63 49.37
LDB 90.32 94.78 5.22
All 92.47 63.36 36.64
SVM + (Size ilter +
Geometric ilter) HDBLDB 96.8196.96 68.8498.77 31.161.23
All 96.80 79.27 20.73
Neural network + (Size ilter +
Geometric ilter) HDBLDB 93.2289.40 70.5397.39 29.472.61
All 91.53 80.06 19.94
SVM + (Size ilter + Geometric ilter + Rule based ilter)
HDB 96.81 93.58 6.42
LDB 96.96 100 0
All 96.80 96.62 3.38
Neural network + (Size ilter + Geometric ilter + Rule based ilter)
HDB 93.22 92.80 7.20
LDB 89.40 99.10 0.90
Current Microscopy Contributions to Advances in Science and Technology. Badajoz: Formatex; 2012. p. 13-20. Forero MG, Cristóbal G, Alvarez-Borrego J. Automatic identification techniques of tuberculosis bacteria. Proceedings of the Society for Photo-Instrumentation Engineers 2003; 5203:71-81. http://dx.doi.org/10.1117/12.506800. Forero MG, Sroubek F, Cristóbal G. Identification of tuberculosis bacteria based on geometric and color. Real Time Imaging 2004; 10(4):251-62. http://dx.doi.org/10.1016/j. rti.2004.05.007.
Forero MG, Cristóbal G, Desco M. Automatic identification of Mycobacterium tuberculosis by Gaussian mixture models. Journal of Microscopy 2006; 223(Pt 2):120-32. http://dx.doi. org/10.1111/j.1365-2818.2006.01610.x. PMid:16911072 Haykin S. Neural networks and learning machines. 3rd. ed. New Jersey: Pearson Prentice Hall; 1999.
Khutlang R, Krishnan S, Dendere R, Whitelaw A, Veropoulos K, Learmonth G, Douglas TS. Classification of Mycobacterium tuberculosis in images of ZN-stained sputum smears. IEEE Transactions on Information Technology in Biomedicine 2010; 14(4):949-57. http://dx.doi.org/10.1109/ TITB.2009.2028339. PMid:19726269
Kimura A, Costa MGF, Costa Filho CFF, Fujimoto LBM, Salem J. Evaluation of autofocus functions of conventional sputum smear microscopy for tuberculosis. In: Proceedings of 32th Annual International IEEE EMBS Conference; 2010. p. 3041-4. http://dx.doi.org/10.1109/IEMBS.2010.5626143. Lenseigne B, Brodin P, Jeon H, Christophe T, Genovesio A. Support vector machines for automatic detection of tuberculosis bacteria in confocal microscopy images. In: Proceedings of 4th IEEE International Symposium on Biomedical Imaging; 2007. p. 85-8. http://dx.doi.org/10.1109/ ISBI.2007.356794.
Makkapati V, Agrawal R, Acharya R. Segmentation and classification of tuberculosis bacilli from ZN-stained sputum smear images. In: Proceedings of 5th Annual IEEE Conference on Automation Science and Engineering; 2009. p. 217-20. http://dx.doi.org/10.1109/COASE.2009.5234173. Osman MK, Mashor MY, Jaafar H. Performance comparison and thresholding algorithms for tuberculosis bacilli segmentation. In: Proceedings of International Conference of Computer, Information and Telecommunication Systems (CITS); 2012. p. 1-5. http://dx.doi.org/10.1109/CITS.2012.6220378. Raof RAA, Salleh Z, Sahidan SI, Mashor MY, Noor SS, Idris FM, Hasan H. Color thresholding method for image segmentation algorithm of Ziehl-Neelsen sputum slide images. In: Proceedings of 5th International Conference on Electrical Engineering, Computing Science and Automatic
Control; 2008. p. 212-7. http://dx.doi.org/10.1109/ ICEEE.2008.4723398.
Sadaphal P, Rao J, Comstock GW, Beg MF. Image processing techniques for identifying Mycobacterium tuberculosis in Ziehl-Neelsen stains. The International Journal of Tuberculosis and Lung Disease 2008; 12(5):579-82. PMid:18419897. Santos A, Ortiz de Solórzano C, Vaquero JJ, Peña JM, Malpica N, del Pozo F. Evaluation of autofocus functions in molecular cytogenetic analysis. Journal of Microscopy 1997; 188(Pt 3):264-72. http://dx.doi.org/10.1046/j.1365-2818.1997.2630819.x. PMid:9450330
Sotaquirá M, Rueda L, Narvaez R. Detection and quantification of bacilli and clusters present in sputum smear samples: a novel algorithm for pulmonary tuberculosis diagnosis. In: Proceedings of International Conference on Digital Image Processing; 2009. p. 117-21. http://dx.doi.org/10.1109/ ICDIP.2009.59.
Steingart KR, Henry M, Ng V, Hopewell PC, Ramsay A, Cunningham J, Urbanczik R, Perkins M, Aziz MA, Pai M. Fluorescence versus conventional sputum smear microscopy for tuberculosis: a systematic review. The Lancet Infectious Diseases 2006; 6(9):570-81. http://dx.doi.org/10.1016/ S1473-3099(06)70578-3. PMid:16931408
Theodoridis S, Koutroumbas K. Pattern recognition. 4th ed. Amsterdam: Academic Press; 2009.
Toman K. How reliable is smear microscopy? In: Frieden T, editor. Toman’s Tuberculosis: case detection, treatment, and monitoring. Questions and answers. WHO; 2004a. p. 14-23. Toman K. What are the advantages and disadvantages of fluorescence microscopy? In: Frieden T, editor. Toman’s Tuberculosis: case detection, treatment, and monitoring. Questions and answers. WHO; 2004b. p. 31-5.
United Nations - UN. The millennium development goals report [internet]. 2010 [cited 2013 Dec 18]. Available from: http://www.un.org/millenniumgoals/reports.shtml. Veropoulos K, Campbell C, Learmonth G, Knight B, Simpson J. The automated identification of tubercle bacilli using image processing and neural computing techniques. In: Proceedings of 8th International Conference on Artificial Neural Networks; 1998. p. 797-802. http://dx.doi. org/10.1007/978-1-4471-1599-1_123.
World Health Organization - WHO. Global TB Control report. [internet]. 2010 [cited 2013 Dec 18]. Available from:http://www.who.int/tb/publications/global_report/2010/ en/index.html.
World Health Organization - WHO. Global TB control report. [internet]. 2013. [cited 2014 Jan 24]. Available from: http://www.who.int/tb/publications/global_report/en.
Authors
Cicero Ferreira Fernandes Costa Filho1*, Pamela Campos Levy1, Clahildek de Matos Xavier1, Luciana Botinelly
Mendonça Fujimoto2, Marly Guimarães Fernandes Costa1
1Centro de Tecnologia Eletrônica e da Informação – CETELI, Universidade Federal do Amazonas – UFAM, Av. General Rodrigo Otávio Jordão Ramos, 3000, Aleixo, Campus Universitário – Setor Norte, Pavilhão Ceteli, CEP 69077-000, Manaus, AM, Brazil.