Filter paper method to determine the water retention
curves for mortar and cement samples
Utilização do método do papel-iltro para determinação
de curvas de retenção de água em argamassas
e concretos
a UCSAL, Materiais, Engenharia, Petrobras, Salvador, BA, Brasil; b DCTM, Engenharia, UFBA, Salvador, BA, Brasil.
Received: 28 Feb 2015 • Accepted: 25 Feb 2016 • Available Online: 12 Jul 2016
J. M. L. VILASBOAS a
S. L. MACHADO b
S. A. PINTO b
Abstract
Resumo
This study deals with the application of the ilter paper method to determine water retention curves for mortar and concrete samples. A water retention curve exhibits the relationship between water content and energy state in interstitial water, normally expressed as a negative value when compare to normal conditions of temperature and pressure, being referred to as suction. Considering the water retention curve as a basic characterization tool for unsaturated soils, its usage in the engineering ield concerning most of the construction materials remains as a pending task. However, stating that not only permeability, but also the water retention curve performs a signiicant role for water and soluble substances low through a material’s pores makes this observation essential for life-span estimation in cases like reinforced-concrete structures. This research paper ofers results for water retention curves obtained in mortar and concrete samples. The experimental curves went through a itting adjust-ment process using Van Genutchen’s [1] model, showing consistency with the obtained results. Furthermore, the water/ceadjust-ment mix ratio does not indicate or suggest a direct inluence for water retention curves.
Keywords: water retention curves, suction, ilter paper, concrete, mortar.
Este trabalho trata do uso da técnica do papel-iltro para a obtenção, em laboratório, de curvas de retenção de água em corpos de prova de argamassa e concreto. A curva de retenção correlaciona o conteúdo de água de meios porosos com o estado de energia da água intersticial, que em condições não saturadas (vazios não totalmente preenchidos por água) é normalmente negativo em relação às condições normais de temperatura e pressão, sendo denominado de sucção. Embora possa ser descrita como uma ferramenta básica de caracterização de solos não saturados, o uso da curva de retenção em concretos e argamassas ainda não foi introduzido na prática da engenharia para a maioria dos materiais de construção. Pode-se dizer, contudo, que não somente a permeabilidade, mas também a curva de retenção desempenha um papel fundamental no luxo de água e substâncias solúveis pelos poros do material, sendo imprescindível o seu conhecimento, para, por exemplo, estimar a vida útil das estruturas de concreto armado. São apresentados resultados de ensaios de sucção total pelo método do papel-iltro, os quais permitiram determinar curvas de retenção para corpos de prova de concreto e argamassa. Estas curvas foram ajustadas segundo o modelo de Van Genutchen [1], o qual apresentou boa aderência aos valores experimentais. Não foi possível observar inluência signiicativa da relação água-cimento nas curvas de retenção obtidas.
526 IBRACON Structures and Materials Journal • 2016 • vol. 9 • nº 4
1. Introduction
When simulating water low processes or the transportation of soluble substances in water, it is not only necessary the compre-hension of the saturated permeability within the medium, but also its water retention curves and hydraulic conductivity. A water reten-tion curve relates water content for a porous media with its energy state in interstitial water. This energy state, generally represented by negative pressures (due to the atmospheric pressure standard) for water held in the material’s pores, results in a phenomena such as capillarity and adsorption, which are negative pressures often referred as suction. Although, often used as a basic characteriza-tion tool for unsaturated soils, the usage and procurement of water retention curves in mortars and concrete remains unexplored for engineering practices for most construction materials. In addition, the structure’s surrounding conditions inluence the results. Thus, a previous suction understanding is essential, as well as, its water content variation due to evaporation, when performing an analysis. For example, analyzing the soluble substances penetration such as chlorides in mortar and concrete sections while expose to mari-time aggressiveness.
The suction for porous media is an energy state within interstitial water, associated with its water retention capacity, normally ex-pressed in terms of hydraulic head (energy by weight) or pressure (energy by volume). When placing free water into a porous me-dium, such as mortar or concrete, the luid remains in retention or becomes absorbed, until all of the empty spaces ill with water (condition for saturated porous medium). In order to get this water removed from the porous medium, energy is required afecting the material’s retention forces, that originate, mainly, from the capillar-ity, absorption and osmosis phenomena. The drier concrete and mortars are the greater its suction becomes, as a result during the drying process, water stores within the smallest pore diameters and the solid’s particle surface, building a layer of absorbed water. Soil physics determines, on a regular basis, a medium’s retention curve, when obtaining a soil’s suction limits that needs to be pre-pared for cultivation of a speciic crop: ield capacity and wilting point. For ield capacity (nearly 30 kPa of suction), interstitial water begins to low when submitted to the gravitational potential, in such case that an extra water addition will only cause water iniltration,
besides the rhizomes of the used crop. In the other hand, wilting capacity (equal to a 1500 kPa suction), admits that the existing water in soil becomes unavailable for plants.
In the geotechnical ield, there are several processes used when determining the water retention curve. According to Machado and Presa [2], there is a prevailing tendency for combined technique application during the procurement of the water retention curve. For example, the suction plate’s usage (water pressure, uw<0 and air pressure, ua=0) for low suction values (proximate to 70 kPa),
the pressure chamber for intermediate values (up to 1500 kPa) and the ilter paper method for high suction values. Table 1 pres-ents typical usage intervals for diferent techniques of imposition/ suction measurement.
In the same way as in soil mechanics, the two main components for water retention in concrete are capillarity and absorption. These components decrease the luid’s speciic energy in such a way that when pores undergo unsaturated conditions, the water’s interstitial pressure becomes smaller than the atmospheric pressure. This explains the capillarity ascension phenomenon. Ascension means rising into higher elevations, implicating that the luid moves to-wards a higher potential gravitational position. Taking into account that every luid can only low from a higher energy potential to a lower one, water pressure within unsaturated medium will always be smaller than atmospheric pressure, considering Bernoulli’s equation variables. Frequently, it is common to use the interstitial or matrix concept to work with positive values, subsequent only from the resulting diference between the air (normally atmospher-ic) and water pressure values, caused by the capillarity and ab-sorption phenomena, i.e.: suction = uar – uw, where uar corresponds to the air phase pressure and uw to the water phase pressure. The NBR 9779 [3] suggests the capillary ascension method as a procedure to determine water absorption for mortars and harden concrete. In addition, stating the requirement of a representative sample of at least three test subjects, permitting them to molded or extracted from the structure. However, the capillary ascension efect observed is not only an outcome caused by the joined inter-actions between capillary suction and absorption when tempting to reduce the energy within interstitial water, but also from the per-meability increase against water due to the sample’s initial water content increase during the whole test completion.
Table 1 – Some of the used techniques for measurement/imposition soil suction
Technique Suction parameter measured Measurement range (kPa)
Paper filter Total and matrix 10 – 30 000
Thermal conductivity detector Matrix 0 – 400
Tensiometer Matrix 0 – 70
Microtensiometer Matrix 0 – 1500
Hilf axis techniques Matrix 0 – 1500
Vapor equilibrium Matrix 0 – 1500
Vapor equilibrium Total 3000 – 3,0 x 10⁵
Pressure plates Matrix 0 – 70
Psychrometer Total 500 – 8000
Although, it is not a common practice in the concrete technological ield, the ideal water low modeling for concrete, under unsaturated conditions, is the separate procurement of retention curves and hy-draulic conductivity. This diferentiation allows water low modeling within the material’s interior, , as long as the acceptable surround-ing conditions are adopted, which can be used, for example, to predict the time for external chloride arrival within the rebar struc-ture in reinforced concrete components, creating satisfactory con-ditions to burst the corrosion process.
As previously mentioned, when luid content within any porous me-dium, generally represented by the gravimetric or volumetric water content, modiies, it takes place to a variation in the luid’s energy state, as well as its mobility ease within the interstices. As water volume decreases, a “luid section” within the material’s empty spaces becomes gradually smaller. Therefore, during the drying process, there is a certain period of time, where continuity amongst the luid particles can be interrupted, point where permeability is practically nullify. This way, in the case for unsaturated porous me-dia, it is common to reference in terms of hydraulic conductivity, in which permeability values are normally linked to the luid content or to the intrinsic energy state (normally given by the suction value) of the medium. However, there is not a clear consensus amongst the specialized literature available, whereas the permeability term in this research paper refers to the function value of the hydraulic conductivity under saturated conditions for a material.
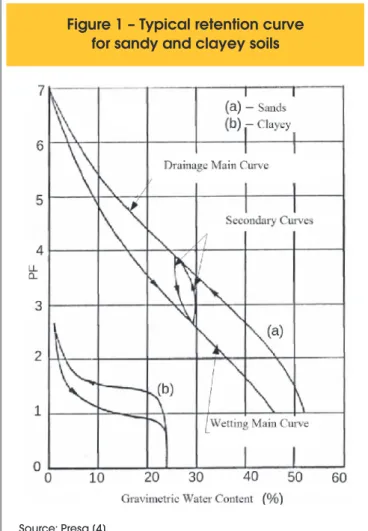
Consequently, the water retention curve is referred to as the exist-ing relationship between the medium’s water content and the energy state within interstitial water. Figure 1 presents typical water retention curves for sandy and clayey soils, according to Presa [4]. In this igure, suction values are located in the ordinate, in terms of logarithmic ex-pression for hydraulic load (PF), and the water content values are lo-cated in the abscissa, in terms of gravimetric humidity. Often, research studies related to the soil physics ield apply this model, although in this particular case the volumetric water content is applied.
As observed on the above igure, the water retention curve de-pends on the uninterrupted course (drying, wetting or mixed) fol-lowed during the test implementation, phenomenon known as hys-teresis. Diferent are the causes for this phenomenon, for instance, irregular geometry in pores linked through small openings, contact angle efect that varies in terms of the uninterrupted course, the incidence of prisoned air bubbles that inluence the wetting curve, and the volume variations sufered due to expansion and retrac-tion. Therefore, during the water content redistribution process, dif-ferent values are found for the same soil upon suction equilibrium conditions, according to Presa [4].
There is no background information found on literature concern-ing the procurement of water retention curves for concrete through the paper ilter method. Furthermore, few curve data is available, regardless of any procedure application. Relating to the applied
methods for curve exempliication, those proposed by Van
Ge-nuchten [1], equation 1, and Fredlund and Xing [5], equation 2, are most common for geotechnical usage. In these equations, α (kPa-1), a (kPa), n and m are itting parameters, θ
sat corresponds
to the volumetric saturated water content (equal to the medium’s porosity), θr to residual water content (where the interstitial water
becomes irregular) and e corresponds to the Napierian base loga-rithm (e = 2,718). Both equations show similarities, such as, wa-ter content or suction values, needing a great increase of suction or energy for an extra drying of the medium. θr and ψr, are water
content and residual suction values, respectively. Van Genuchten’s proposed equation ofers a great advantage due to its simplicity, in contrast to the equation proposed by Fredlund and Xing [5], which enables the retention curve representation of the medium until complete drying, taking place when a suction value is proximate to 1x10⁶ kPa, according to these authors.
(1)
1
-=
+
é
+
ù
ë
û
sat r
r n m
m
q
q
q q
ay
|
|
(2)
satln 1
1
1
1000.000
ln 1
ln
é
ù
é
æ
ö
ù
ê
ú
+
ê
ç
÷
ú
ê
ú
è
ø
ê
ú
=
× -
ê
ú
ê
ú
æ
ö
ê
æ
æ ö
ö
ú
+
ê
ç
÷
ú
ê
ç
ç
+
ç ÷
÷
÷
ú
ê
è
ø
ú
è ø
ë
û
ë
è
ø
û
m
r
n
r
e
a
y
y
q q
y
y
Since water content afects the ease in which water lows through the medium, the medium’s hydraulic conductivity curve is needed to model the substance’s low as well. Thus, permeability values
Figure 1 – Typical retention curve
for sandy and clayey soils
528 IBRACON Structures and Materials Journal • 2016 • vol. 9 • nº 4
are expressed in terms of suction or the luid content of inter-est. Therefore, considering the Mualem [6] model for k(θ) pre-diction, Van Genuchten [1], and simpliication of the expression,
m = n
1
1− , the following equation is proposed for hydraulic
conductivity prediction.
(3)
( )
2 1
1 1
é
æ
ö
ù
ê
ú
=
×
- -
ç
÷
ê
è
ø
ú
ë
û
m
p m
sat
k
q
k
w
w
where:
w, efective soil saturation, given by equation 4; ksat, hydraulic conductivity for a saturated-pore medium;
p, empiric parameter by Mualem [6], proximate to 0,5 for most soils
(no values found for concrete material).
(4)
=
q q
-
r-sat r
q
q
w
2. Material sand methods
2.1 Experimental determination for the suction
characteristic curve
The method chosen for the retention curve determination for
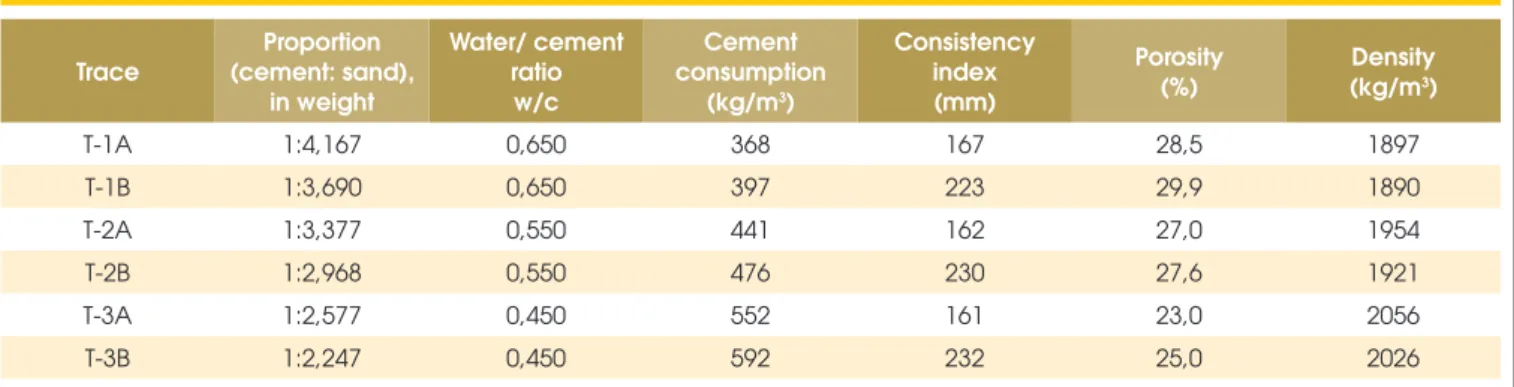
mortar and concrete samples, corresponds to the established Bra-zilian standard technical norm, ASTM D5298 [7], on the subject of paper ilter practice, which considers suction values between the range of 30 to 30.000 kPa, as stated by Silva [8].Tables 2 and 3 display the mortars and concrete sample traces produced during the two experimental stages. During the irst stage, mortars pro-duced from experimental mixtures have the criteria from diferent research studies to regulate the water/cement ratio, obtaining mix-tures with diferent consistency indexes, (165 ± 5) mm and (225 ± 10) mm, which consequently lead to diverse cement consumption. Therefore, mortars with water/cement proportions of 0.45, 0.55 and 0.65 were prepared, having 4 cylindrical test subjects for each mixture with 50 mm x 100 mm dimensions producing a total of 24 test subjects. The procedure adopted is described in the previously mentioned norm [9]. After eachtest subject hardened, 8 diferent sections were cut, discarding the edges, and submitted to the suc-tion test through the paper ilter method.
During the second stage, concrete samples of a single consistency were produced, (140 ± 20) mm reduction, as well as water/cement mix proportions equal to 0.45; 0.55 and 0.65. Then, 4 cylindrical test subjects were molded for each trace with 100 mm x 200 mm dimensions, resulting in 12 test subjects in total. The molding and curing procedure comply with the Brazilian standard technical norm [10].The test subjects were cut into 8 sections for each trace, discarding the edges, and submitted to the suction test through the paper ilter method.
a) Test description
Current soil techniques and standard procedures established by the technical norm [11] were followed to help develop a standard
Table 2 – Fresh-state mortar composition and specifications
Trace
Proportion (cement: sand),
in weight
Water/ cement ratio
w/c
Cement consumption
(kg/m3)
Consistency index (mm)
Porosity (%)
Density (kg/m3)
T-1A 1:4,167 0,650 368 167 28,5 1897
T-1B 1:3,690 0,650 397 223 29,9 1890
T-2A 1:3,377 0,550 441 162 27,0 1954
T-2B 1:2,968 0,550 476 230 27,6 1921
T-3A 1:2,577 0,450 552 161 23,0 2056
T-3B 1:2,247 0,450 592 232 25,0 2026
Table 3 – Fresh-state concrete mix composition and specifications
Trace
Proportion (cement: sand),
in weight
Water/ cement ratio
w/c
Cement consumption
(kg/m3)
Consistency index (mm)
Porosity (%)
Density (kg/m3)
T- 4A 1:1,800:3,390 0,650 337 150 18,82 2192
T- 5A 1:1,368:2,870 0,550 405 145 18,26 2207
procedure from the paper ilter application when determining suc-tion values for mortars and concrete. The paper ilter method is based in the porous media absorption capacity or water loss (or other luid), when in direct or indirect contact with the luid, in a closed environment, at constant pressure and temperature until energy equilibrium is reached. When this happens, the humidity values of the porous medium (mortar or concrete) and the paper il-ter are typically diferent; however, both have the same suction val-ue. The energy equilibrium is reached, supposedly, when no water is transferred to the paper ilter (element weight consistency). There are two ways to carry on the procedure: direct contact be-tween the paper ilter and the sample, and no contact bebe-tween these two. When there is no direct contact, the water exchange between both takes place through water vapor. In this case, no water exchange occurs for dissolved luids in the sample’s inter-stitial water, inding the value of total suction (osmotic + capillary + adsorption). The conditions created within the container act as a semi-permeable membrane, allowing water exchange to occur only through the vapor inside, when dealing with non-volatile sol-utes. Energy states within the sample’s water content, paper ilter and air, within the impervious sealed container regulated by the relative humidity, are diferent during the beginning of the proce-dure. These energy gradients encourage water low. Finally, same suction values become in a state of equilibrium, within the whole system, encouraged by the water contents in the sample, paper ilter and the air (relative humidity).
When the paper ilter comes into direct contact with the sample, water exchange occurs in a liquid state and the type of suction measured in this case, is its matrix suction (capillarity + absorp-tion), originated from the equilibrium state caused by the concen-tration of solutes inside the medium.
During this research study, total suction values were measured (no contact), placing the paper ilter next to the test subject, seeking to minimize the air volume between both materials within the contain-er and decreasing the required time for the system’s equilibrium achievement.
Supplementary measures were also taking in place due to vapor condensation in the container’s interior, which can origin measure-ment errors when water drops fall into the paper. In addition, con-siderations took place to avoid the paper ilter’s contamination, like the use of gloves and tweezers for the operator, speciically when manipulating samples and the whole testing equipment. A weight-measuring scale with 0,001g minimum precision needs to be use in order to obtain the paper ilter weight.
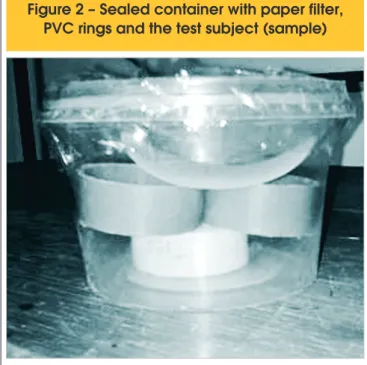
Before each procedure’s implementation, all samples were initially saturated and dried to air until the achievement of the required wa-ter content values, w. Consequently, for every test a drying patwa-tern was followed, avoiding hysteresis efects in the retention curve. After this stage, the system (test subject and paper ilter) was put inside a container, sealed with tape (see igure 2). Finally, the use of PVC rings to avoid direct contact between the paper ilter and the sample (test subject).
Preliminary tests performed, veriied the required time for the sys-tem’s equilibrium achievement. This was achieved by opening the container periodically to measure the sample’s weight. Afterwards, at least a 15 day time period was followed, sealing and placing the containers inside a temperature-controlled room (20°C with ± 0.5ºC variations), acclimatized within a Styrofoam box.
After achieving suction equilibrium amongst the container compo-nents, the sample and paper ilter are weighed. A discrepancy, dur-ing the test, was noticed when each paper ilter was dried inside the oven, before placing it inside the container next to the test sub-ject. The experimental results were not being compatible with the calibrations curves proposed by Chandler and Gutierrez [11]. For that reason, the paper ilter drying should be avoided beforehand. The paper ilter’s weight is a critical aspect during the test’s imple-mentation. The container must be opened to rapidly remove the paper ilter with the aid of tweezers, located within the previously weighed capsule, obtaining the weight of both components with the appropriate scale. Afterwards, both components are taken into the oven. The delay time during this procedure can inluence the paper ilter to absorb water from the atmosphere, modifying the experimental values.
In addition, the capsule’s weight determination can be consider af-ter the drying process due to small dust particles initially located within the capsule, volatized in the oven, altering the experimental values. The drying procedure for mortars or concrete samples can be done in a conventional way.
After obtaining before and after measures, paper ilter weights for each sample, as well as the material’s physical properties, the following parameters are determined: the water content and dry weight readings within the paper and test subject.
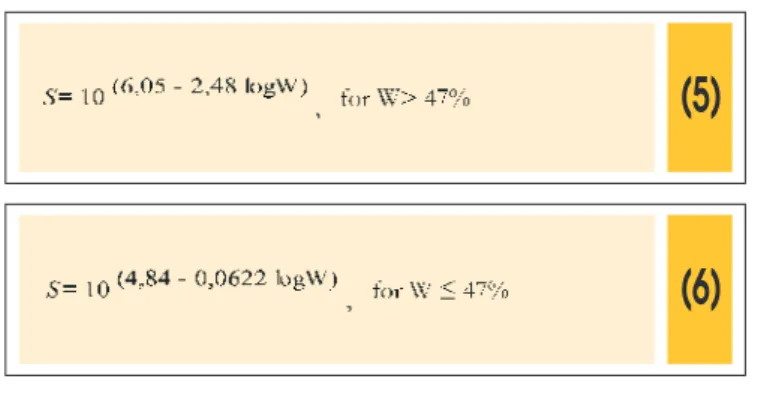
Based on the materials’ phase relationship and the experimental data, the paper ilter’s moisture content (%) is determined, as well as its suction value, using equations 5 and 6 proposed by Chandler and Gutierrez [11], assuming that the value is the same for the sample or test subject.
Each sample tested provides a point (moisture, suction) for the wa-ter retention curve, considering that 8 samples (sections) were ob-tained for each mortar or concrete trace. Consequently, the water retention curve for each material was determined with the diferent moisture content values obtained during each test.
530 IBRACON Structures and Materials Journal • 2016 • vol. 9 • nº 4
(6)
where:
w, the paper ilter’s moisture content (%)
S, is the suction value (kPa.)
In this study, Van Genutchen’s [1] equation was used to adjust the experimental retention curve. The equation presents the samples’ water content in terms of volumetric water content, θ, being the ratio between the water volume and the total volume. Therefore,
the materials’ (mortar and concrete) density values were needed, in order to convert the gravimetric water content values into volu-metric water content.
3. Results and analysis
The total suction results obtained through the paper ilter meth-od for each mortar and concrete sample execute dare shown in Tables 4 and 5, respectively. These tables show the inal water content values for each material, as well as the equilibrium suction values calculated with equations 5 and 6, using the paper ilter’s inal moisture. Remarking that only satisfactory values from test results are ofered in both tables.
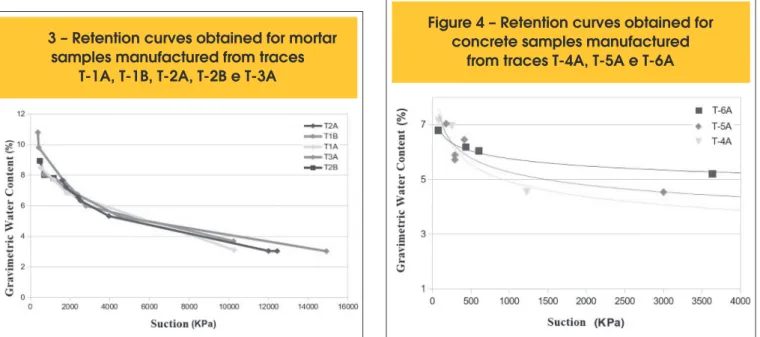
Figures 3 and 4 present the obtained results for the water reten-tion curves for mortar and concrete samples, respectively. Not-ing, primarily in the case of mortar samples, that the obtained values are proximate from one another. This can suggest that the usage of diferent values of the water/cement mixture ratio does not modify the medium’s micro-pore distribution. In the
particu-Table 4 – Suction test results for mortar test subjects
Data
Paper filter’s gravimetricwater
content (%)
Test subject’s gravimetric water
content (%) Suction
(kPa)
Test subject’s volumetric water q (%)
Before After
Trace characteristics
a/c = 0, 65
T-1A
(165±5) mm
13,32 3,22 3,10 10264,37 6,19
25,36 7,26 6,83 1829,75 13,64
28,41 8,13 7,69 1183,56 15,35
34,26 9,09 8,48 511,55 16,94
T-1B
(225±10) mm
10,71 3,10 3,01 14925,79 6,02
19,02 5,58 5,26 4541,30 10,50
23,61 7,20 6,75 2353,27 13,48
25,99 8,14 7,65 1671,91 15,27
35,63 10,45 9,80 420,41 19,57
36,36 11,54 10,79 378,60 21,55
a/c = 0, 55
T-2A
(165±5) mm
11,98 3,14 3,03 12440,62 6,04
12,23 3,11 3,03 12000,70 6,05
19,97 5,46 5,32 3963,11 10,62
23,13 6,67 6,34 2520,18 12,65
23,42 6,92 6,56 2416,33 13,11
25,50 7,65 7,20 1794,32 14,38
26,63 8,11 7,65 1592,45 15,29
T-2B
(225±10)
28,45 8,28 7,82 1175,57 15,62
32,16 8,49 8,01 691,27 15,99
34,81 9,45 8,93 472,80 17,83
a/c = 0, 45
T-3A
(165±5) mm
13,34 3,78 3,68 10232,54 7,34
22,37 6,35 5,98 2809,86 11,94
27,69 8,10 7,66 1311,75 15,29
lar case for the concrete samples, although the obtained values show a greater dispersion, they are still proximate from one an-other. Hence, the water/cement mix relationship is not an inlu-ential factor. Kumar [12] used the vapor equilibrium method for the determination of water retention curves in manufactured con-crete, having mix ratio values equal to 0.40, 0.50 and 0.60. The results in this study suggest that similar proiles were obtained for all three concrete mixtures.
Figures 5 and 6 display the obtained results itted according to Van Genunchten’s [1] proposed model. Table 6 presents a summary for the model’s parameters, obtained by the application of the Or-dinary Least Squares method. LibreOice@ software spreadsheet
was used to perform and adjust the curve itting.
Hendrickx, Roels and Balen [13] acquired suctions values through the pressure plate method for cement and chalk samples. The ma-terials’ characteristics and their volumetric water content values for saturation (θs), residual volumetric water content (θr) and the
permeability coeicient for saturation (ksat) are presented in table
7. Volumetric water content values (θs=0,30 and θr=0,050) backup
the parameters’ results obtained for mortar samples presented in table 6.
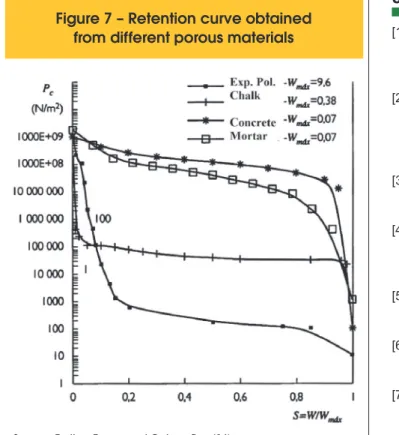
According to Freitas, Torres and Guimarães [14], suction curve development relies on the distribution law, pores’ radii and its variation. These researchers performed several tests to charac-terize degradation in Portuguese buildings in terms of the upward
Table 5 – Suction test results for concrete test subjects
Data
Paper filter’s gravimetricwater
content (%)
Test subject’s gravimetric water
content (%) Suction
(kPa)
Test subject’s volumetric water q (%)
Before After
Trace characteristics
a/c = 0, 65
T-4A
(140 ± 20 ) mm
28,17 4,65 4,54 1223,89 10,23
47,07 7,36 7,16 79,73 16,12
39,22 7,16 6,96 251,53 15,67
a/c = 0,55
T-5A
21,90 4,71 4,54 3002,78 10,22
41,67 7,26 7,04 177,15 15,85
38,22 6,00 5,72 290,36 12,88
35,74 6,72 6,45 414,17 14,53
38,21 6,04 5,89 290,73 13,27
a/c = 0,45
T-6A
20,57 5,29 5,20 3637,87 11,72
48,64 7,63 6,79 73,49 15,30
35,41 6,51 6,18 433,80 13,93
33,13 6,19 6,04 601,87 13,60
Figur
3 – Retention curves obtained for mortar
e
samples manufactured from traces
T-1A, T-1B, T-2A, T-2B e T-3A
Figure 4 – Retention curves obtained for
concrete samples manufactured
532 IBRACON Structures and Materials Journal • 2016 • vol. 9 • nº 4
and the volumetric water content
for mortar samples, considering traces
T-1A, T-1B, T-2A, T-2B and T-3A
the volumetric water content for concrete
samples, considering traces T-4A, T-5A e T-6A
Table 6 – Fitting parameters ofthe water retention curves, according
to the Van Genutchen [1] model, for mortars and concrete samples
Paremeters Mortars
(T-1A, T-1B, T-2A, T-2B e T-3A) Concretes (T-4A, T-5A e T-6A)
qs (m3 . m-3) 0,27799 0,17622
qr (m3 . m-3) 0 0
n 1,29634 1,068775
m 0,22859 0,06434
α (kPa-1) 0,007066691 0,0156045743
R2 94,88% 80,84%
Table7 – Composition, properties and parameters of suction
for mortars manufactured from chalk or cement
Data Mortars
Chalk Cement
Binder/Sand (kg/kg) 0,112 0,218
Water/Binder (kg/kg) 2,016 0,907
Binder’s specific surface area (m2/g) 12,0 1,30
Binder’s particle average diameter (µm) 6,03 12,50
qs (m3 . m-3) 0,33 0,30
qr (m3 . m-3) 0,130 0,050
ksat (m/s) 2,27 x 10
-7 6,17 x 10⁻⁷
humidity originated from the soil, due to the capillary effect occurring through the materials’ pores that form the building’s walls and floors. Figure 7 shows the retention curves obtained for different materials (concrete, mortar, chalk and expanded polyurethane).
4. Conclusions
The total suction results obtained through the paper ilter method, using the mortar and concrete samples, display no signiicant inlu-ence from the water/cement proportions in this particular phenom-enon. Considering the 27.80% volumetric water content for mortars and 17.62% for concrete samples, the minimum suction values ob-tained for these materials were 50 Pa and 100 Pa, respectively. Regarding the itting parameters for the materials’ retention curves, when compared to those obtained for soils, a great discrepancy is witnessed, caused by the distinctive porous characteristics that ex-ist amongst these materials. In general, the water retention curves obtained for concrete samples are more similar to those obtained for clayey soils, capable of retaining signiicant volumes of water for high suction values (see Figure 1).
Regardless of the few data available in literature, values obtained in this study for the volumetric water content during saturation and residual processes (θs=0.30 and θr=0.050) are proximate to those
provided by other authors.
Consequently, this study conirms the usage of an unconventional procedure as successful; therefore, the obtained values were sat-isfactory, reason to suggest the implementation of these values in more suitable simulations, using speciic surrounding conditions.
5. References
[1] VAN GENUCHTEN, M. Th. A Closed Form Equation for Pre-dicting the Hydraulic Conductivity of Unsaturated Soils. Soil Science, Society of America Journal, Madison, WI, 44:5, p. 892-898, 1980.
[2] MACHADO, S. L.; PRESA, E. P. Current Tendencies for Un-saturated Soils in Brazil. ECOS do NSAT 2007. In: BRAZIL-IAN CONGRESSFOR SOIL MECHANICS AND GEOTECH-NICAL ENGINEERING - COBRAMSEG, 2008, Búzios, RJ. Anais... Vol., p.231-250.
[3] BRAZILIAN ASSOCIATION OF TECHNICAL NORMS. NBR 9779: mortar and harden concrete–water absorption deter-mination through capillarity. Rio de Janeiro, 1995. 2 p. [4] PRESA, E. P. Expansive Clay misshape under controlled
suction. 1982. Doctoral Thesis– Escuela Técnica Superior de Ingenieros de Caminos, Canales y Puertos, Universidad Politécnica de Madrid, Madrid.
[5] FREDLUND, D. G.; XING, A. Equations for the soil water characteristic curve. Canadian Geotechnical Journal, Ot-tawa, 31- 4, p. 521-532, 1994.
[6] MUALEM, Y. A new model for predicting the hydraulic con-ductivity of unsaturated porous media. Water Resources Re-search, 12-3, p. 513-522, 1976.
[7] AMERICAN SOCIETY FOR TESTING AND MATERIALS – ASTM. ASTM D5298 -10: Standard test method for measure-ment of soil potential (suction) using ilter paper. In:_______. Annual Book of ASTM Standards. vol. 15.09. Philadelphia, 2010.
[8] SILVA, A. M. Water Retention Curve for Brazilian soils. 2005. Thesis (Civil Engineering Master’s Program) – Escola de Engenharia de São Carlos, Universidade Estadual de São Paulo, USP, São Carlos, SP.
[9] BRAZILIAN ASSOCIATION OF TECHNICAL NORMS. NBR 7215: Portland Cement–resistance and compression deter-mination. Rio de Janeiro, 1996. 8 p.
[10] BRAZILIAN ASSOCIATION OF TECHNICAL NORMS. NBR 5738: Cylindrical test subject’s molding and curing; proce-dure. Rio de Janeiro, 2008. 6 p.
[11] CHANDLER, R. J.; GUTIERREZ, C.I. (1986). The Filter-Pa-per Method of Suction Measurement. Géotechnique, Vol. 36, Nº2, p. 265-268.
[12] KUMAR, A. Water low and transport of chloride in unsatu-rated concrete. A thesis submitted to the college of graduate studies and research in partial fulilment the degree of mas-ter of science in the Department of Civil and Geological En-gineering, University of Saskatchewan, Saskatoon, Canada, 2010.
[13] HENDRICKX, R.; ROELS, S.; BALEN, K.V. Measuring the water capacity and transfer properties of fresh mortar. Ce-ment and Concrete Research, New York, v. 40, p.1650 -1655, 2010.
[14] FREITAS, V. P; TORRES, M. I; GUIMARÃES, A. S. Humi-dade Ascensional. Porto: FEUP, 2008. 106 p.

![Table 6 – Fitting parameters ofthe water retention curves, according to the Van Genutchen [1] model, for mortars and concrete samples](https://thumb-eu.123doks.com/thumbv2/123dok_br/18861180.417954/8.892.64.826.149.741/fitting-parameters-retention-according-genutchen-mortars-concrete-samples.webp)