A cost optimization-based design of precast concrete
fl
oors using genetic algorithms
Augusto T. de Albuquerque
b,⁎
, Mounir K. El Debs
a, Antonio M.C. Melo
baDepartment of Structural Engineering, State University of Sao Paulo, Brazil
bDepartment of Structural Engineering and Construction, Federal University of Ceará, Brazil
a b s t r a c t
a r t i c l e
i n f o
Article history:
Accepted 26 September 2011 Available online 19 October 2011
Keywords:
Structural optimization Precast concrete Genetic algorithm
The integrated design optimization, not only the element optimization, is considered a strong trend. The inte-grated optimization involves the three major stages of an engineering design process namely conceptual design, embodiment design and detailing design. This paper presents an integrated structural precastfloor design opti-mization tool, calledDSSPF(Decision Support System for Precast Floors), for precast concrete structures using GA and considers the cost impact at all construction phases like manufacture, transport and erecting in the structural conception. An example indicating the DSSPF results are very consistent with the results of an existing design is further presented. Based on the results obtained, the DSSPF is considered a powerful novel tool to assist designers in the choice of structural layout and initial element dimensioning phases.
© 2011 Elsevier B.V. All rights reserved.
1. Introduction
The building industry has, over a long period, settled for believing that building construction was a handicraft activity. Today, it searches for technology catch up, demands more efficiency in the construction process and minimizes waste. For this, many of the traditional indus-try concepts, from technical management to the automation of manufacturing steps were incorporated. Within this context, struc-tural precast concrete structures have gained increasing space. The precast concrete structure is literally an industrialized product manu-factured in an assembly line and later transported and assembled at the construction site. Thus, there is a gain in quality control, reduction in labor and construction time, it guarantees precise management and works well in severe temperatures.
A big precast concrete structure expansion has occurred in Brazil over recent years, besides a diversification in its use. The system is already widely used in Europe and in the US and is now becoming very attractive in Brazil. Because of this, there are some university research groups working in this theme.
Some of these works deal with the application of optimization techniques to the design of precast structures, thus making the ele-ment design more efficient. This optimization-based design approach to precast concrete design is considered to be very appropriate and feasible since precast concrete elements are more modular, more standardized and are made in assembly line. This makes it easy to model the optimization problem and produce economy of scale when the optimal results are achieved.
Notwithstanding, Kicinger et al.[1]point out that the strongest trend in this area is the integrated design optimization and not merely the element optimization. The integrated optimization involves the three major stages of an engineering design process: conceptual design, embodiment design and detailed design.
Some studies have already been carried out on integrated struc-tural optimization. Sahab et al.[2]presented aflat plate in reinforced concrete optimization and cited the importance of thefloor factor in the total cost of the structure while Miles et al.[3]presented the op-timization of a steel structure considering features of architecture and services. They justify the work reporting that 80% of construction costs are defined in the design process and that the client pressure at this stage sometimes impedes the search for better alternatives. Pullmann et al.[4]presented the optimization approach to reinforced concrete high rise buildings frames. These authors commented on the importance of an integrated optimization approach instead of just elements optimization. Rafiq et al.[5]developed a structural system optimization where the software chooses the type of structure (steel, precast concrete or just cast in place concrete) to be adopted. As mentioned earlier, the optimization technique is very suitable with precast concrete structures due the fact that the elements (columns, beams and slabs) and spans are more standardized. In addition, it was observed that the element optimization results are limited and some-times not realistic because the impact on the othersfloor elements is not considered. Hence, the integrated optimization is considered to be an excellent tool to support the structural designer.
Among the optimization techniques in structural engineering design, the genetic algorithm base optimization approach has been recognized as a trend due to its ability to provide multiple good solutions, its ability to locate the region of the global optimum solution and its ease of implementation.
–
⁎ Corresponding author. Tel.: + 55 85 33669607; fax: +55 85 33669607. E-mail address:[email protected](A.T. de Albuquerque).
0926-5805/$–see front matter © 2011 Elsevier B.V. All rights reserved. doi:10.1016/j.autcon.2011.09.013
Contents lists available atSciVerse ScienceDirect
Automation in Construction
Genetic algorithms (GAs) are based on the Evolution Theory through natural selection from Charles Darwin (1837) and concepts of genetic. GAs werefirst presented by John Holland with the publica-tion of the book“Adaptation in Natural and Artificial Systems”in 1975. Since the 80s the use of GAs has gained impulse and nowadays it has been successfully used in many different optimization problems.
This paper presents a GA based integrated structuralfloor design optimization tool denominated herein asDSSPF(Decision Support Sys-tem for Precast Floors). This tool is intended for precast concrete struc-ture with consideration, at the structural conception phase, of the cost of all construction phases such as manufacture, transport and erection. The automation in construction is achieved by an optimized design developed by the designer using DSSPF that is completely integrated with the precasters necessities and reality. At the end, an example used as benchmark to verify the validity of DSSPF is presented.
2. Proposed system:DSSPF
The DSSPF approach presented here proposes the automation and cost optimization of the structural layout, such as the number and the directions of the beams and hollow cores, and the column positions. The system also optimizes the complete element detailing such as dimensions and reinforcement. It therefore works like a decision sup-port system that helps the engineer in the structural design stage.
The structural layout is defined as the position of the structural ele-ments and their orientation. This includes the location of the columns, beams and slabs. In fact, the structural layout is the initial stage of any design process and may be the most challenging because it involves many variables and many possible solutions. Hence, comparisons need to be made between some possible solution options with the aim of obtaining the most beneficial and cost effective alternative to the client. This process takes time and sometimes does not present a good result because the economically better solution may not always among those initially idealized by the engineer.
Miles et al.[3]reported that conceiving a structural layout build-ing is complex because it requires skills in many disciplines such as architecture, structures, services and others. A good decision at this stage guarantees a solution that meets the criteria of economy, time and functionality.
In precast structures, the complexity is even higher because the engineer has to consider the process of fabrication, transporting and handling in the overall cost.
The conventional system which conforms to the Prior et al.[6]
classification was adopted in the proposed DSSPF. This system made of hollow cores slabs supported by inverted“T”beams is the most widely used in office blocks, hospital and hotel buildings in the US (Fig. 1). A survey conducted by Albuquerque and El Debs[7] regard-ing precast systems most widely used in Brazil indicated that the conventional system is the most popular.
Prior et al.[6]and Albuquerque and El Debs[7]indicated that the precasters expect building designs to be modular in order to take
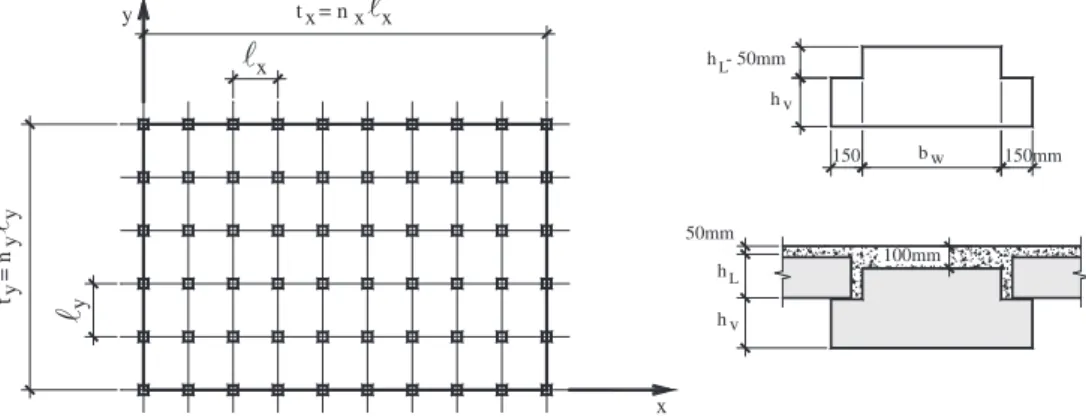
advantage of the production and to reduce costs. In this light, the DSSPF seeks a modular alternative that obtains better results in terms of cost while obeying all structural, architectural and construc-tion restricconstruc-tions. The initial inputs into the system are (Fig. 2):
a) Number offloors;
b) Minimal distance allowed in the X (ℓx) and Y (ℓy) directions; c) Floor dimensions in the X and Y directions (txandty);
d) Maximum height of thefloor, from the beam bottom to the con-crete topping:hv+hL+ 50 mm (a 50 mm topping is adopted in all cases);
e) Maximum width of the beam, besides supports of the slabs:bw+ 300 mm (150 mm for each side);
f) Live load on thefloor:q; g) Superimposed dead load.
The system provides many structural design alternatives as shown in (Fig. 3), with the costs arranged in increasing order. These alterna-tives indicate:
a) The layout—position and direction of the beams, slabs and columns; b) The dimension of the elements—beams and HC (hollow core
slabs);
c) The reinforcement—detailing of prestressing and non-prestressing steel;
d) The concrete compressive strength—precast concrete (fckPM) and cast-in-place concrete (fckML).
To compare the alternatives, a cost function is necessary. This func-tion should be modeled considering the material consumpfunc-tion, labor, elements of transportation, handling and assembly, administrative costs, taxes, depreciation andfixed costs.
3. Methods and techniques adopted
3.1. Element design criteria
The DSSPF verifies the strength of the elements (beam and slab) for all construction stages (fabrication, transporting and handling) based on the strength design method and verifies the element serviceability requirements.
In the proposed model, the HCs are considered to be simply sup-ported while the beams are considered simply supsup-ported under dead load and continuous for live load. This continuity is improved after application of topping which is considered for allfloors. The continuity requirements are based on the ACI[8]prescription 8.3 by the following negative bending moment and a positive bending:
MNegative¼ ql2
10 ð1Þ
CROSS - SECTION cast-in-place
concrete
slab hollow core
precast beam
slab hollow core
slab hollow core
precast beam cast-in-place
concrete
Fig. 1.Conventional system offloor.
MPositive¼ q:l
2
16 ð2Þ
Whereqis the live load andℓis the span.
As usual, in prestressed concrete design, the normal stresses due the prestress, dead and live loads are limited according the codes, for each possible case. In addition, the reinforcement must satisfy the ultimate load requirement. Castilho et al.[9]present how these conditions are considered according to the Brazilian Code. Only bend-ing moments are considered. The shear reinforcement, in general, is not necessary, hence only a minimum shear reinforcement, as pro-posed in Balling and Yao[10], was adopted for the beams
A complete description of the DSSPF model is given in Albuquerque et al.[11]with details of the design variables and constraints besides the GA features adopted.
3.2. Cost function
3.2.1. Activities taken in account
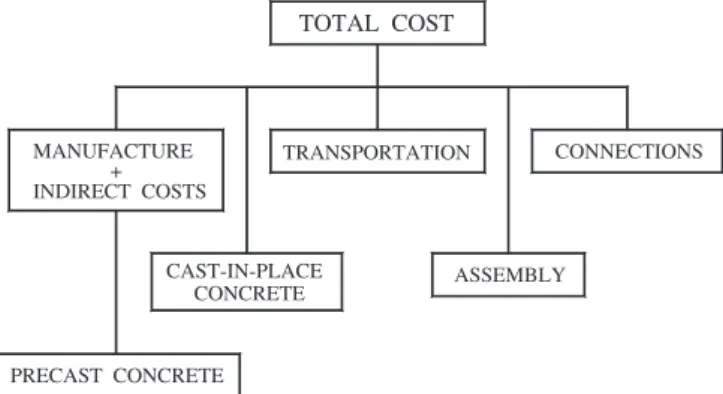
Normally, the precaster delivers the structure assembled in the con-struction site. In this light, the DSSPF seeks to consider all the effective costs from the manufacturing up to the assembling of the precast struc-ture. These costs are divided into materials consumption, labor, manu-facture, indirect costs, storage, transport, assembly, taxes and profits (Fig. 4).
According to Prior et al.[6], an efficient system must seek to opti-mize the transport capability and the utilization of the assembly equipment. Beside this, the cost activity must be considered. For in-stance, the hollow core manufacturer and beam manufacturer are known to use different equipments and therefore the manufacturing costs are expected not to be the same.
3.2.2. Manufacture
The manufacturing cost is made up of the material cost and opera-tional expenses.
a) Material consumption
The materials used in the fabrication of precast concrete elements are composed of concrete, prestress tendons, reinforcement bars, elastomeric bearing pads and weld for beam, column and HC. In accordance with the afore-exposed inSection 3.2.1, the beam and column manufacturing operational expenses were included in the concrete unit cost. To consider the prestressed tendon con-sumption, the loss due the casting bed length in function of the element length was estimated.
The variation of the concrete unit cost as a function of concrete strength was based on the precaster datum and from a structural concrete manufacturer. In general the unit cost was found to in-crease by up to 8% for each inin-crease of 5 MPa in concrete strength for a strength range of 20 MPa to 50 MPa while for cast-in-place con-crete, the unit cost was observed to increase by 30% considering the labor necessary for placement and the local mould manufacture. b) Operational expenses
Operational expenses are made up of the labor, use of prestressing bed, curing, storage and transport. These operational expenses are different in accordance with the function of the element being produced.
Since the manufacture of HC is a more automated process, its cost is lower and is easy to be measured. Consequently a unit cost per area of the element was adopted to represent the operation costs. Contrary, the fabrication of beam and columns is a less automated and more labor intensive process requiring more labor necessary for cutting, bending and placing of reinforcement, for steel mould adjustments, for concrete casting and for tendons placement. Thus y
x x
t = n x x
x
t = n y
y
y
y
v h h - 50mmL
150 bw 150mm
50mm
h v h L
100mm
Fig. 2.Design mesh and element dimensions.
slab
direction
slab direction slab
direction
the costs of these operations are more difficulty measure and because of this the precaster provided historical data with all the operational expenses imbedded in the unit cost of concrete for beams and columns.
Hence the concrete unit costs adopted for beams and columns are different from that of hollow core slabs. Based on the information provided by precasters, the concrete unit cost of beams and columns was estimated to be 50% higher than for HC.
3.2.3. Indirect costs
Indirect costs are given by the industryfixed costs, maintenance and equipment depreciation while thefixed costs include salary ex-penses, energy, phone, marketing, rent, fuel and accountancy.
To consider the indirect costs, a historical annual average survey of its indirect costs and the production volume was carried out. Based on these estimates, a factor based on the ratio of the average indirect costs to the average manufacturing costs was determined. With this fac-tor, the indirect costs for manufacturing a given structure could easily be determined. For the present research, the factor used was 0.33.
The indirect costs are directly linked to the manufacture since they are the result of industrial activity with transport and erection being independent activities. On the other hand the transport and assembly costs are independent and were estimated separately.
3.2.4. Transport
To compose the transport cost, two truck alternatives—a small and a large truck were used. The cost of the larger truck was estimated to be 60% higher than that of the small truck and former was necessary only when the element length was more than 12.5 m. Based on information from the precasters, the two trucks were considered to have a 250 kN transport capacity per trip, or a 10 m3concrete volume. From this, a routine wasfirst made to identify the transport trip cost as a function of element length. The number of trips necessary was then estimated andfinally multiplied by the cost of the trip.
Transport CostElements¼
VolumeElements
10 ⋅Trip Cost ð3Þ
Elements: beams, HC, and columns separately; Cost of Trip: large or small truck.
The costs per trip considered all trips to be made in the same city of the precaster. The cost per trip was based on the element size. For the 12 m long elements, the truck needed was the larger than the conventional. Due to this, it was more expensive (60% higher).
3.2.5. Assembly
The cost of assembly was divided in two: crane rentage and labor. Afigure of R$ 1.100,00 (about US$550) per day was adopted for crane rentage and the efficiency is presented inTable 1while for labor, a cost of R$ 400.00 (about US$ 200) per day was adopted.
Based on the number of pieces, the number of days necessary for complete assembly was estimated and then multiplied by the costs of crane rentage and labor.
3.2.6. Final costs
Thefinal cost must consider, besides the manufacturing, the indi-rect costs, transportation and assembly, the taxes and the profits. For this, the precaster uses a factor that is applied by all the costs. Despite of the difference in taxes, the uniform factor permits afinal cost mar-gin to account for mistakes in indirect cost statements.
Final Cost¼½ðManufactureÞ:Ψ1þTransportþAssemblyΨ2 ð4Þ
WhereΨ1is an indirect cost factor andΨ2is a tax and profit factor. To make the cost function as representative as possible, a strong cooperation was necessary with the precaster to obtain the information about the costs. This workfigured help from the Brazilian precaster T&A.
3.3. Genetic algorithm
3.3.1. Basis concept
GA is a stochastic search technique based on the natural selection where there is a population formed by individuals. The individuals represent the potential solutions to the problem. These individuals are classified by their fitness, in accordance with a cost function. After that, the best group of individuals is allowed to continue in the process while the others are rejected, Goldberg[12].
The three main GA operators are the selection, the crossover and the mutation. The selection chooses the individuals that will partici-pate in the crossover. The probability of the crossover defines how many individuals will participate in the crossover while the mutation rate defines the probability of a gene being changed randomly. This process simulates exactly the same mechanisms that exist in nature such as selection, crossover and mutation.
The features of the GA adopted in the proposed DSSPF such as the de-sign variables, penalty function, parameters and operators are detailed in Albuquerque et al.[11].
3.3.2. GA adopted
The algorithm used in this study is the called MGA1 based on RANK selection due to the excellent results obtained by Castilho et al.[9]. In the MGA1, an initial population is randomly produced and then ranked. From this ranked list, the two best individuals are selected by elitism TOTAL COST
TRANSPORTATION CONNECTIONS
MANUFACTURE + INDIRECT COSTS
CAST-IN-PLACE
CONCRETE ASSEMBLY
PRECAST CONCRETE
Fig. 4.Activities accounted for in the cost function.
Table 1
Elements erected per day.
Elements Number
Column 8
Beam 16
HC 24
Table 2
Fitness average of the best individual in 5 runs for each case.
Test features Averagefitness in 5 runs (R$/105)
Population size = 1000 1,46
Generation number = 1500
Population size = 1500 1,46
Generation number = 1000
Population size = 1000 1,47
Generation number = 1000
Population size = 700 1,46
Generation number = 2000
Population size = 700 1,45
and a number of them are chosen by the crossover probability to contin-ue in the crossover process. To complete the population after the cross-over, new individuals are generated randomly. This phase is called restore.
3.3.3. Population size
According to Goldberg [12] and Carroll [13], there are some indicators of the population size. However, it was observed that these indicators pointed to a small population and the obtained results were not good. Because of this, a larger population size, according to Lemonge
[14], was used.
It is observed that besides the chromosome length, the population size should consider the quantity of constraints of the problem. Since this information is very peculiar to each problem, it is recommended that the more feasible is to regulate the model with a benchmarking test thus determining, for each model, the population size, the num-ber of generations and the operators (elitism, crossover probability and mutation).
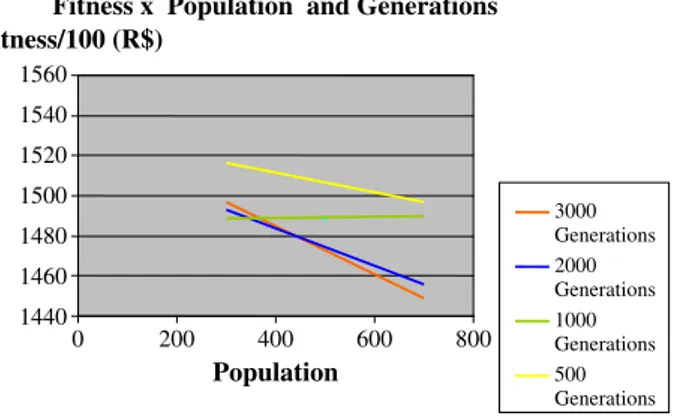
It was adopted an example as calibration test to determine the population size and generation number.Table 2presents the results of this study.Fig. 5shows the minimal costversusthe numbers of individual and generations. It was observed that the population of 700 individuals with 3000 generations presented an excellent result and these values were adopted in the examples presented in this paper.
The population size directly influences the generation diversity. The generation of the initial population was adopted to be 10 times larger than that to be used. Later, it is ranked and the better individuals enter in the process. This strategy permits an initial population previ-ously selected.
3.3.4. Design variables
The design variables define the problem as it passes by the solu-tions space. The values are fed randomly and they permit thefitness function to be calculated. The design variables, assuming a total of 11, were:
a) Direction of HC;
b) nxandny: Number of spans in X and Y directions. From this
infor-mation and the direction of HC, the HC span (ℓHC) and the beam span (ℓbeam) could be estimated;
c) PM (precast) and CML(cast in place): Auxiliary design variables that indicate the value of concrete strength in the set list; d) ANPT and ABP: Auxiliary design variables that indicate the
num-ber and the diameter of steel bars in the set list, for beams; e) ANA and ANB: Auxiliary design variables that indicate the
num-bers of prestress steel strands in the beams, based on the set list; f) HC configuration (dimension and prestressing), based on the set
list present inFig. 6, with 32 variations; g) Beam configuration (width and height).
It is of general knowledge that each precaster has his set of moulds for beam production thus defining his possible dimension for width and height. Besides, each has his machine for manufacturing of HC. Because of this:
a) The quantity of steel bars NPT(i) can assume the values: 0, 2, 4 and 6. These bars are located at the bottom of the beam to resist posi-tive bending moments;
b) The diameter of the steel bars can assume the values: 6.0 mm, 8.0 mm, 10.0 mm and 12.5 mm;
c) The quantity of prestressing steel strands in thefirst layer,nA(i) can assume the values: 3, 5, 6, 7, 8, 10, 13, 14, 15, 16, 17, 18, 19, 20, 21 and 23;
d) The quantity of prestressing steel strands in the second layer,nB(i) can assume: 0, 2, 4, 6, 8, 10, 12 and 14;
e) The span number in the X and Y directions can be in the range of
(nxandny): 1 to 16.
3.3.5. Representation
An important aspect of representation is to permit the possibility of appearance of all possible solutions. In this problem, the majority of the design variables are discrete. Therefore, all variables were assumed to be discrete. A binary representation assumed to be the most appropriate for the formation of the set list was adopted.
3.3.6. Chromosome length
The chromosome length varies as a function of the input data, i.e., the length is defined after the architectural constraints must have
Fitness x Population and Generations
1440 1460 1480 1500 1520 1540 1560
0 200 400 600 800
Population
Fitness/100 (R$)
3000 Generations 2000 Generations 1000 Generations 500 Generations
Fig. 5.Fitness versus population and number of generations.
H
s(mm)
90
130
170
200
210
260
Prestressing steel
range
6 6.5 to
12 6.5
8 6.5 to
8 9.5
8 6.5 to
8 11.1
8 8.8 to
10 12.7
8 8.8 to
10 12.7
8 8.8 to
8 12.7
Number of
variations
4
5
6
6
6
5
been analyzed. After the chromosome length is defined, it is main-tained constant until the end of running.
This length variation can be done by reducing the set lists. The maxi-mum length is 34 bits, but it can be reduced to 29 bits. The idea is to eliminate the possibility of the search in solutions previously known to be infeasible. For instance, if the architectural design suggests a minimal span 5 m, it is not necessary to search for numbers of spans (nxand ny) resulting in spans smaller than 5 m.
3.3.7. Fitness function
A penalty function similar to that used by Rajeev and Krishnamoorthy
[15]and Govindaraj and Ramasamy[16]was adopted. This is interesting because it considers the intensity of penalty.
Considering gja generic restriction:gj¼
σFigured Out
σReference−1≤0 ð5Þ
andC¼∑mj¼1cj
cj¼ g0j→g→gjN0
j≤0
Fitness Function:ϕ¼f xð Þ⋅ð1þK:CÞ ð6Þ
m= number of restrictions;
K= penalty intensity.
Thefitness function works in the GA just as the environment acts in nature, putting pressure on the evolution of species. This implies putting pressure on the population in order to extract the best indi-viduals. Nonetheless, it is noteworthy that the population diversity must be maintained.
3.3.8. Genetic operators
The genetic operators are the mathematical mechanisms that simu-late a natural selection, which is the basis of GA. Following is a descrip-tion of the generic operator as used in the DSSPF.
a) Selection: The individuals are organized in an increasing rank based on thefitness function and then selected for the elitism, crossover and elimination. The number of individuals that will remain intact and that will participate in the crossover is determined by the DSSPF input data. The rest of the population is rejected and a new population is generated to restore the population. In this paper it was adopted 3 intact individuals as elitism.
b) Crossover: A uniform crossover which was previously tested in a lot of works by Sahab[2]and Castilho et al.[9], for example, and classified as very efficient was adopted. In this paper an 80% crossover rate was
adopted.
c) Mutation: With exception of elitism individuals, all others could suffer a mutation process. In the majority of the samples, a 1% mu-tation rate was adopted. This value was indicated as good in the literature and was also found to be successful in the present work.
3.3.9. New genetic operators proposed
In the proposed DSSPF, two new genetic operators were imple-mented based on the analogy of a genetic phenomenon.
a) Transgenic
This is an artificial change imposed to increase some individual features. It was used in the DSSPF to avoid the possibility of ap-pearance of more strands in the second layer of reinforcement, well known not to be an economical situation, since it resists a smaller bending moment. At any instance that the system identified this situation, it automatically modified the numbers of strands to keep the number of thefirst layer larger than the second layer. This routine is important because it eliminates the search for
alternatives that are known previously as not efficient. To check this routine, two examples were done with 10 runs, each one, and with the transgenic routine the process was observed to converge more rapidly. The convergence was confirmed at 1065 generation and at 1682 generation, before the routine has been implemented. Besides, the routine produced better results.
b) Twins
It was observed that some runs presented exactly identical indi-vidual elitism. Hence, a routine was implemented to check if the individuals from elitism were the same and in case they were, one of the twins was placed to crossover and the next one in the rank was taken to the elitism.
After this step, it was observed that some runs that presented twins presented new individuals without lose of the better indi-vidual. In this way a more diverse population was improved by keeping the best fitness found before implementation of the twin routine.
It is important to point out that comparison was done in each chromosome and not in thefitness value, because it could be pos-sible to obtain two different individuals with the samefitness and in this case the two of them must be retained in the elitism.
4. Example
4.1. Original situation
The building called Comercial Carvalho is presented here as an example to verify the consistency of DSSPF results against the result of an existing design by a recognized Brazilian structural engineering de-sign office (Hepta Structural Engineering). This building was manufac-tured and erected by T&A precaster.
The Comercial Carvalho is a 3-story commercial building with a plan ofℓx= 96.0 m andℓy= 56.0 m. The architectural requirements predicted a modular 8.0 m × 8.0 m bay and 450 mm maximumfloor depth. A live load of 7.5 kN/m2was assumed while for the live load due the pavement, a value of 1.0 kN/m2was used.
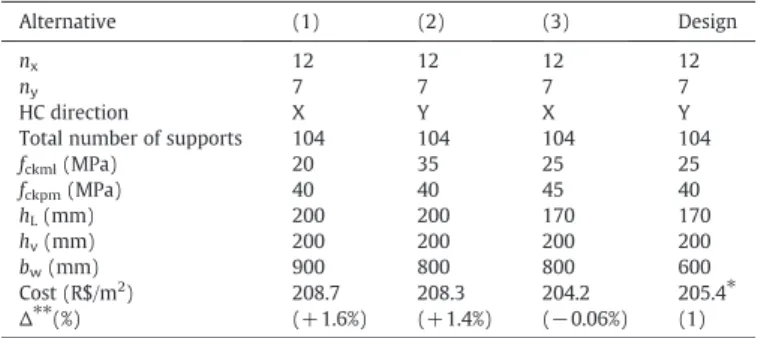
Table 3presents 3 alternative solutions produced by the proposed DSSPF. The obtained costs were found to agree very closely with the design cost with a variation of not more than 2.2% between the observed DSSPF and design costs. The cost of the original design was estimated using the cost function adopted in the DSSPF. The larg-est variation observed from the DSSPF was 1.6%. Two different struc-tural layouts are given in the DSSPF results. Thefirst one has the beam orientation parallel to the smallerfloor dimension (alternatives 1 and 3) while the second has the same layout as the original design pattern (alternative 2).
Although the orientation in alternative 3 is different from that of the original design, it indicated a HC of 170 mm height, the same Q4
Table 3 DSSPF results.
Alternative (1) (2) (3) Design
nx 12 12 12 12
ny 7 7 7 7
HC direction X Y X Y
Total number of supports 104 104 104 104
fckml(MPa) 20 35 25 25
fckpm(MPa) 40 40 45 40
hL(mm) 200 200 170 170
hv(mm) 200 200 200 200
bw(mm) 900 800 800 600
Cost (R$/m2) 208.7 208.3 204.2 205.4⁎
∆⁎⁎(%) (+ 1.6%) (+1.4%) (−0.06%) (1)
(⁎)Cost calculated with the DSSPF cost function.
(**) Cost variation related to original design cost. nx: span number in the X direction.
assumed in the original design, and a beam geometry (Fig. 7) similar to the original design (Fig. 8). This solution was found to be more eco-nomical than the adopted design. It is concluded that the beam orien-tation parallel to the smaller side presents less beams that are more expensive elements. In this example the beam number fell from 96 to 91 while the columns and number of HC were maintained.
It is pointed that the DSSPF results were extracted from automatic runs while the original design took a certain period to define the structural layout and after that estimate the element dimensions
and detailing. This initial design stage is very difficult and time con-suming and requires engineering experience.
The steel strand of the third level in the original design beam was adopted mainly to resolve some cracking problems at the transitory stages and because it is used as stirrup support.
Fig. 7.DSSPF beam (alternative 3).
Fig. 8.Original design beam.
Fig. 9.Study stage original beam design.
Table 4
DSSPF percentage results by stages.
Stages Precaster average value DSSPF
Manufacture (%) 81.6 83.6
Transport (%) 11.0 10.1
Assembly (%) 7.4 6.3
Table 5
DSSPF results for increased maximumfloor depth.
Alternative Depthfloor limit 470 mm Depthfloor limit 600 mm
nx 12 12
ny 7 7
HC direction X X
fckml(MPa) 25 25
fckpm(MPa) 40 40
hL(mm) 170 170
hv(mm) 250 300
bw(mm) 700 600
Cost (R$/m2) 204.9 202.4
Table 6
DSSPF results of transport cost.
Alternative Design (5)
nx 12 11
ny 7 7
HC direction Y X
fckml(MPa) 25 20
fckpm(MPa) 40 50
hL(mm) 170 170
hv(mm) 200 200
bw(mm) 600 800
Cost(R$/m2) 240.7a 249.9
Manufacture (%) - 73,0
Transport (%) - 22,0
Assembly (%) - 4,6
The variables involved in structural layout stage are very depen-dent due the fact that each choice has many impacts that have to be analyzed by the engineer. For instance, the HC height impacts on the beam height due the assembling process, i.e., the beam width in-creases thus reducing the HC span.
To eliminate all these doubts, many alternatives must be studied and then the most economical one selected. Only then can the detail-ing stage, where the engineer utilizes all his knowledge and experi-ence to make better solution, be started.
To better illustrate the difference between the element study stage (Fig. 9) and thefinal element detailing stage, we present the original beam design in the study stage.
It is easily observed that the beam study stage of the original de-sign is very similar the DSSPF beam alternative inFig. 7.Table 4 pre-sents the influence, as a percentage, of each phase in the total cost.
It is concluded that the DSSPF can be an excellent auxiliary de-sign tool for an engineer due the fact that it can carry out the study stage, allowing the engineer to spend much time in the detail-ing stage which is more important, usdetail-ing his experience and knowledge.
A sensitivity analysis was carried out to observe the variations in system results when ran under other conditions. This is presented in the next sections.
4.2. Maximum depthfloor enhanced
The maximum limit offloor depth was enhanced to 470 mm and 600 mm and after many runs, it was observed that the cost per square meter was nearly the same even when the beam dimensions assumed a bigger height. The best of each one of these news runs is presented inTable 5.
4.3. Transport cost changed
The original transport cost was multiplied by 3. This consideration was based on the precaster information for a building assembled in a 1000 km distant city from the factory. This situation is very common due to the lack of factories in some cities and due to the continental dimensions of Brazil.
Many runs were made with all of them leading to alternative 5 (Table 6andFig. 10). The appearance of a new alternative is because the participation of the transport item was found to increase on an average of 22.5% while in the original runs, it was 11%, and so this new alternative resulted in bigger HC spans which reduce the ele-ment number, thus optimizing the transport term.
The example earlier, like many others that were tested, indicates the applicability of the DSSPF. In almost all of them, the DSSPF choice was the same alternative chosen by the engineer responsible for the original design used as benchmarket. In this way, the DSSPF results may be considered as having attained its goal of supporting the de-signer in making the process decision easier by automatically provid-ing many complete comparisons.
5. Conclusions
The DSSPF eliminates the traditional design process stage which is the initial structural layout concept. In general this stage is slow and the DSSPF idea is to make it faster thus permitting the designer to spend more time in other stages, like detailing and analysis.
The DSSPF results were very consistent with those of the original design. The obtained structural layout, the beam and HC dimensions and the concrete strength were very coherent with the designs com-monly adopted by the designers. This means that the proposed DSSPF can be an excellent decision support tool for the engineer in the initial design stages.
Another interesting point is that the relative cost proportion among the activities (manufacture, transport and assembly) was nearly the same as the average value informed by T&A, Brazilian precaster who supported this research, i.e., 81.6%, 11% and 7.4% respectively.
The alternative variation in function of sensitive analysis is a very important example of DSSPF potentiality, due the fact that it is com-plicated to measure the economical impact in the structure cost when some items are changed. In this case, the designer without a support tool can be led to make a very poor decision if he does not consider the new design conditions.
In summary, it is believed that the DSSPF could be a strong tool to help the designers in choosing a structural layout and initial element dimensions thus making this stage faster while relegating the hard work to thefinal stages of detailing and design verification.
Acknowledgement
The authors would like to thank thefinancial support from CAPES, FUNCAP and CNPQ (Brazilian governmental agencies).
References
[1] R. Kicinger, T. Arciszewski, K.A. De Jong, Evolutionary computation and structural design: a survey of the state of the art, Computers and Structures 83 (23–24) (2005) 1943–1978.
[2] M.G. Sahab, A.F. Ashour, V.V. Toropov, Cost optimization of reinforced concrete flat slab buildings, Engineering Structures 27 (3) (2005) 313–322.
[3] J.C. Miles, G.M. Sisk, C.J. Moore, The conceptual design of commercial buildings using a genetic algorithm, Computers and Structures 79 (17) (2001) 1583–1592. [4] T. Pullmann, Z. Skolicki, M. Freischlad, T. Arciszewski, K. De Jong, M. Schnellenbach-Held, Structural design of reinforced concrete tall buildings: evolutionary computa-tion approach using fuzzy sets, Proceedings of the 10th Internacomputa-tional Workshop of the European group for intelligent computing engineering, Delft, Netherlands, 2003, pp. 53–61.
[5] M.Y. Rafiq, J.D. Mathews, G.N. Bullock, Conceptual building design—evolutionary approach, Journal of Computing in Civil Engineering 17 (3) (2003) 150–158. [6] R. Prior, S. Pessiki, R. Sause, S. Slaughter, Identification and preliminary
assess-ment of existing precast concretefloor framing systems, ATLSS Report n. 93–07, Lehigh University, Bethlehem, PA, 1993.
[7] A.T. Albuquerque, M.K. El Debs, Survey in precast concrete structural systems in Brazil (in Portuguese),National workshop production, design and research in pre-cast concrete, Sao Carlos, Sao Paulo, Brazil, 2005.
[8] American Concrete Institute, Building Code Requirements for Structural Concrete, (ACI-318M), Farmington Hills, 1995.
[9] V.C. Castilho, M.C. Nicoletti, M.K. El Debs, An investigation of the use of three selection-based genetic algorithm families when minimizing the production 11 x 8.727 = 96.0m
10 x 8.00 = 80.0m
8.727m
8.00m
1.00
Fig. 10.Structural layout alternative 5.
cost of hollow core slabs, Computer Methods In Applied Mechanics And Engi-neering 194 (2005) 4651–4667.
[10] R.J. Balling, X. Yao, Optimization of reinforced concrete frames, Journal of Struc-tural Engineering 123 (2) (1997) 193–202.
[11] A.T. Albuquerque, M.K. El Debs, A.M.C. Melo, Otimização de Pavimentos de Edifícios em Concreto Pré-Moldado, Congresso de Métodos Numéricos em Engenhar-ia(CMNE)–28,Congresso Ibero Latino-Americano sobre Métodos Computacionais em Engenharia(CILAMCE), Porto, Portugal, , 2007.
[12] D.E. Goldberg, Genetic Algorithms in Search, Optimization and Machine Learning, Addison-Wesley Publishing Company, U.S.A, 1989.
[13] D.L. Carroll, FORTRAN Genetic Algorithm Driver—Manual of Program, CU Aero-space, Champaign, Illinois, 1999.
[14] A.C.C. Lemonge,Aplicação de algoritmos genéticos em otimização estrutural, Tese (Doutorado)-Universidade Federal do Rio de Janeiro, Rio de Janeiro: COPPE/UFRJ, 1999.
[15] S. Rajeev, C.S. Krishnamoorthy, Discrete optimization of structures using genetic algorithm, Journal of Structural Engineering 118 (5) (1992) 1233–1250. [16] V. Govindaraj, J.V. Ramasamy, Optimum detailed design of reinforced concrete
continuous beams using genetic algorithms, Computers and Structures 84 (1–2) (2005) 34–48.