ACPD
4, 4285–4337, 2004Aerosol seasonal variability over the Mediterranean region
F. Barnaba and G. P. Gobbi
Title Page Abstract Introduction Conclusions References
Tables Figures
◭ ◮
◭ ◮
Back Close
Full Screen / Esc
Print Version Interactive Discussion
Atmos. Chem. Phys. Discuss., 4, 4285–4337, 2004 www.atmos-chem-phys.org/acpd/4/4285/
SRef-ID: 1680-7375/acpd/2004-4-4285 © European Geosciences Union 2004
Atmospheric Chemistry and Physics Discussions
Aerosol seasonal variability over the
Mediterranean region and relative impact
of maritime, continental and Saharan dust
particles over the basin from MODIS data
in the year 2001
F. Barnaba and G. P. Gobbi
Istituto di Scienze dell’Atmosfera e del Clima, ISAC – CNR, Via Fosso del Cavaliere, 100, 00133 Roma, Italy
ACPD
4, 4285–4337, 2004Aerosol seasonal variability over the Mediterranean region
F. Barnaba and G. P. Gobbi
Title Page Abstract Introduction Conclusions References
Tables Figures
◭ ◮
◭ ◮
Back Close
Full Screen / Esc
Print Version Interactive Discussion Abstract
The one-year (2001) record of aerosol data from the space borne Moderate Resolution Imaging Spectroradiometer (MODIS) was analyzed focusing on the Mediterranean re-gion. The MODIS aerosol optical thickness standard product (AOT at 550 nm) provided over both land and ocean was employed to evaluate the seasonal and spatial variability 5
of the atmospheric particulate over the region. Expected accuracy of the MODIS AOT is
(±0.05±0.2×AOT) over land and (±0.03±0.05×AOT) over ocean. The seasonal
anal-ysis revealed a significant AOT variability all over the region, with minimum values in Winter (AOT<0.15) and maximum in Summer (AOT>0.2). The spatial variability is also found to be considerable, particularly over land. The impact of some major urban sites 10
and industrialized areas is detectable. For the sole Mediterranean basin, a method (aerosol mask) was implemented to separate the contribution of maritime, continental and desert dust aerosol to the total AOT. Input of both continental and desert dust par-ticles is well captured, showing, respectively, a North-to-South and a South-to-North AOT gradient. A quantitative summary of the AOT seasonal and regional variability is 15
given for different sectors of the Mediterranean basin. Results of this summary were
also used to test the aerosol mask assumptions and indicate the method adopted to be suitable for the aerosol type selection. Estimates of the atmospheric aerosol mass
load were performed employing specifically-derived mass-to-extinction efficiencies (α).
For each aerosol type, a reliable meanα value was determined on the basis of lidar
20
measurements of extinction and aerosol models. These estimates indicate a total of 43 Mtons of desert dust suspended over the basin during 2001. A comparable value is derived for maritime aerosol. Opposite to the dust case, a minor seasonal variabil-ity (within 15%) of maritime aerosol mass is found. This latter result is considered a further check of the suitability of the methodology adopted to separate, on the basis of 25
ACPD
4, 4285–4337, 2004Aerosol seasonal variability over the Mediterranean region
F. Barnaba and G. P. Gobbi
Title Page Abstract Introduction Conclusions References
Tables Figures
◭ ◮
◭ ◮
Back Close
Full Screen / Esc
Print Version Interactive Discussion
1. Introduction
The great effort spent over the last decade by the scientific community to investigate
atmospheric particulate matter reflects the importance attributed to aerosol in control-ling the Earth’s climate (e.g. Penner et al., 2001). Major advancements in the field have been fostered by a new generation of space based instruments (e.g. ATSR-2 on 5
board the ESA-ERS2, MODIS and MISR on board the NASA Terra, POLDER on board the ADEOS), specifically developed to facilitate detection and characterization of at-mospheric aerosols (e.g. King et al., 1999). A large amount of space-retrieved aerosol data has been produced in recent years and, after the initial period of quality checking (e.g. Chu et al., 2002; Remer et al., 2002; Chu et al., 2003; Levy et al., 2003; Liu et 10
al., 2004), validated information is now becoming available. Even though further im-provement of aerosol dedicated instruments and inversion techniques is still needed, it is important to exploit the large, routinely available set of data, particularly considering the unique potential of space-based observations in terms of data coverage.
On this basis, a one-year-dataset (2001) of the aerosol optical thickness operational 15
product (AOT) from the Moderate-resolution Imaging Spectroradiometer (MODIS, on board the NASA platform Terra) has been employed and analyzed to get a picture of the aerosol seasonal and regional variability over the Mediterranean region. This study was performed in combination with the analysis by Gobbi et al. (2004) in which the record of lidar soundings collected in the year 2001 was used to characterize the seasonal 20
variability of the aerosol vertical distribution over Rome (Italy), as representative of Central Mediterranean conditions.
The Mediterranean represents a unique area in terms of suspended particulate mat-ter. Bounded to the north by the European continent and to the south by the North
Africa arid regions, it is largely affected by both Saharan dust, anthropogenic aerosols
25
ACPD
4, 4285–4337, 2004Aerosol seasonal variability over the Mediterranean region
F. Barnaba and G. P. Gobbi
Title Page Abstract Introduction Conclusions References
Tables Figures
◭ ◮
◭ ◮
Back Close
Full Screen / Esc
Print Version Interactive Discussion
1993; Loye-Pilot and Martin, 1996; Avila et al., 1998; Kubilay et al., 2000; Collaud Coen et al., 2004), lidar (e.g. Hamonou et al., 1999; Gobbi et al., 1999; Di Sarra, et al., 2001; Muller et al., 2003; De Tomasi et al., 2003; Dulac and Chazette, 2003; Gobbi et al., 2004) and satellite observations (e.g. Dulac et al., 1992; Moulin et al., 1998; Israelevich et al., 2002). Conversely, studies of the export of particles from the 5
European continent (i.e. mainly pollution-related cases) to the Mediterranean Sea are still limited. However, a growing interest in this topic is now emerging. A recent
in-ternational effort to quantify the input (and impact) of anthropogenic emissions to the
natural background of the Mediterranean environment is represented by the Mediter-ranean Intensive Oxidant Study (MINOS). Largely based on experimental results, the 10
MINOS project highlighted the relevant role of pollutants in the summertime Mediter-ranean atmosphere (e.g. Lelieveld, 2002). Models have also been usefully employed to investigate the export pathways of air pollution from Europe (e.g. Stohl et al., 2002; Duncan and Bey, 2004). Still, Duncan and Bey (2004) point out the current lack of observations of pollution related parameters to be compared to model results in the 15
European region.
The strength of the dust outbreaks over the Mediterranean tends to facilitate the Sa-haran dust detection by both ground and space based observations, allowing the quan-tification of its transport and of its optical and microphysical properties. As opposite to Saharan dust, investigation of the export of particulate matter from the industrialized 20
countries surrounding the Mediterranean (in the following referred to as “continental aerosols”) is complicated by the fact that an extremely large number of species and gas precursors (including inorganic and organic compounds) contribute to it. In ana-lyzing space-based observations, such a complexity can partly be reduced focusing on some specific physical and optical properties of these particles. In fact, continental 25
aerosol is recognized to be mainly composed of fine particles (r<0.6µm) so that their
optical properties are strongly dominated by such aerosol “fine fraction” (e.g. Dubovik et al., 2002; Kaufman et al., 2002).
ACPD
4, 4285–4337, 2004Aerosol seasonal variability over the Mediterranean region
F. Barnaba and G. P. Gobbi
Title Page Abstract Introduction Conclusions References
Tables Figures
◭ ◮
◭ ◮
Back Close
Full Screen / Esc
Print Version Interactive Discussion
the Mediterranean region (land and ocean) to investigate the aerosol’s seasonal and regional patterns. Moreover, we evaluate the contribution to the total AOT of continental and desert-dust aerosol export over the Mediterranean basin (in addition to the mar-itime aerosol one). This result is obtained by implementing a simple scheme (hereafter referred to as “aerosol mask”) that combines the MODIS operational retrieval of the 5
aerosol optical thickness with a second MODIS product (i.e. the fine fraction) indicating the relative contribution of the fine particles to the total AOT. The aerosol mask scheme is described in Sect. 2, together with examples of its application to specific case stud-ies. In Sect. 3, results are presented in terms of seasonally averaged maps of both total AOT and relative AOT contribution of maritime, continental and desert dust aerosol. A 10
summary of the aerosol seasonal variability is then given in Sect. 3.1 where regional
analysis is performed by separating the Mediterranean basin in ten different sectors.
Based on the sectors data, estimates of the aerosol mass load over the Mediterranean
basin are given in Sect. 3.2. These have been obtained, for the three different aerosol
types, employing appropriate mass-to-AOT conversion factors (α) derived from lidar
15
observations and model-based results. In order to focus Sect. 3.2 on the presentation
and discussion of results, the procedure employed to derive theαfactors is described
in Appendix A. In Sect. 3.2, the Mediterranean sectors summary is also employed as a test of the aerosol mask capability to actually discriminate the three aerosol types addressed in this study.
20
2. Methods
The Moderate Resolution Imaging Spectroradiometer (MODIS) was launched in
December 1999 on the polar orbiting NASA-EOS Terra spacecraft. Terra’s
sun-synchronous orbit has a dayside equatorial 10:30 am local crossing time. Since Febru-ary 2000, MODIS data are acquired in 36 spectral bands from the visible to the thermal 25
infrared. The instrument having a scanning angle of 110◦ (swath width of 2330 km),
per-ACPD
4, 4285–4337, 2004Aerosol seasonal variability over the Mediterranean region
F. Barnaba and G. P. Gobbi
Title Page Abstract Introduction Conclusions References
Tables Figures
◭ ◮
◭ ◮
Back Close
Full Screen / Esc
Print Version Interactive Discussion
formed over both land and ocean surfaces by means of procedures thoroughly de-scribed in Kaufman and Tanr ´e (1998). Aerosol products are stored in MODIS Level 2 (MOD04 L2) files, each corresponding to 5 minutes acquisition along the satellite or-bit. The two aerosol products employed in this study are: 1) the optical thickness, at 550 nm (MOD04 L2 Scientific Data Set: Optical Depth Land And Ocean, in the follow-5
ing referred to as AOT) and 2) the fine fraction (MOD04 L2 Scientific Data Set: Opti-cal Depth Ratio Small Ocean, in the following referred to as FF). This latter is defined
as the ratio of optical thickness of small mode vs effective optical thickness at 550 nm.
Both products are given at a spatial resolution of 10×10 km (at nadir). The AOT is
provided over both land and ocean merging the two different retrievals developed for
10
the two different surfaces. The fine fraction product is only operational over ocean
sur-faces (although Chu et al., 2003 showed that separation of fine and coarse particles over land is possible by comparing the path radiances at 660 and 470 nm). As
dis-cussed in detail in the MODIS aerosol products validation studies, a different accuracy
is associated to the MODIS AOT retrievals over land (∆AOTland=±0.05±0.2AOT; Chu
15
et al., 2002; Chu et al., 2003) and over ocean (∆AOTocean=±0.03±0.05AOT; Remer et
al., 2002). Over land, errors larger than∆AOTland can be found in coastal zones due
to sub-pixel water contamination. This effect tends to produce an AOT overestimation
(Chu et al., 2003). Over ocean, the validation by Remer et al. (2002) shows the major uncertainties to occur at small optical thickness, when the aerosol contribution to the 20
measured radiance is low and surface contributions (as foam and water color) can be misinterpreted. Similarly, a significant water color contribution can reduce the ocean AOT retrieval quality in coastal areas. Largely based on Mediterranean test sites, the study by Remer et al. (2002) also indicates the particle size-dependent parameters (as
the FF) to be retrieved with an accuracy within±25%.
25
In this work, daily MODIS observations over the Mediterranean region (about three L2 files per day) were collected for the whole year 2001 (except for the period 15 June– 3 July, due to instrumental problems). For each L2 file, AOT and FF data were binned
ACPD
4, 4285–4337, 2004Aerosol seasonal variability over the Mediterranean region
F. Barnaba and G. P. Gobbi
Title Page Abstract Introduction Conclusions References
Tables Figures
◭ ◮
◭ ◮
Back Close
Full Screen / Esc
Print Version Interactive Discussion
area within the latitude and longitude ranges 30◦N–50◦N and 10◦W–35◦E,
respec-tively. The derived 0.1-degree-binned AOT data were then averaged on a seasonal basis, the four seasons being defined as DJF (December–January–February, i.e. win-ter), MAM (March–April–May, i.e. spring), JJA (June–July–August, i.e. summer), SON (September–October–November, i.e. fall). Moreover, for each L2 file, AOT information 5
was combined with the corresponding FF one (0.1-degree-binned as well) to distin-guish between maritime, continental and desert dust aerosol following the method de-scribed in Sect. 2.1. Then, for each season, the contribution of the three aerosol types to the total, mean AOT was computed.
2.1. The aerosol mask
10
In order to reduce the complexity of the atmospheric aerosol system, some general categories of aerosols can be identified on the basis of their origin. In particular, over the Mediterranean, three general aerosol types are expected to dominate the atmo-spheric load: 1) maritime aerosol produced on the sea surface by winds; 2) continental aerosol originating in the industrialized countries surrounding the Mediterranean Sea 15
from both anthropogenic and non-anthropogenic activities (e.g. fossil fuel combustion, industrial activity, soil erosion); 3) desert dust aerosol loaded into the Mediterranean
atmosphere from the North African arid regions. Produced by such different
mecha-nisms, these aerosol types generally show substantially different optical and physical
properties (e.g. Kaufman et al., 2002). In fact, in urban/industrial conditions, optical 20
properties are dominated by fine particles (e.g. Remer and Kaufman, 1998; Dubovik et al., 2002) while, in the presence of desert dust, these are strongly dominated by coarse particles. In maritime conditions, the relative contribution of coarse particles, although variable (Smirnov et al., 2002), is generally higher than in urban/industrial conditions and lower than for desert dust (e.g. Dubovik et al., 2002).
25
ACPD
4, 4285–4337, 2004Aerosol seasonal variability over the Mediterranean region
F. Barnaba and G. P. Gobbi
Title Page Abstract Introduction Conclusions References
Tables Figures
◭ ◮
◭ ◮
Back Close
Full Screen / Esc
Print Version Interactive Discussion
particular, we proceeded to define which regions of the FF vs. AOT space would be pe-culiar to the three aerosol types. The following considerations were taken into account to define the three regions limits shown in Fig. 1 (blue, green and yellow portions corre-sponding to maritime, continental and desert dust aerosol, respectively). As opposite
to remote oceanic regions, it is particularly difficult to define “pure maritime conditions”
5
in inland seas as the Mediterranean. Following Smirnov et al. (1995), avoiding the most turbid conditions (associated to Saharan dust transport), in the Mediterranean one can distinguish between very pure atmospheres, when AOT values are close to the ones
registered in background oceanic regions (i.e. AOT≤0.1), and “standard” atmospheres,
wherein the mean AOT is in the range 0.2–0.3. We have therefore set to 0.3 the up-10
per limit of maritime AOT. At the same time, considering the variability of the coarse fraction in maritime aerosol (Smirnov et al., 2002), we have allowed the fine fraction of maritime aerosol to vary in the range 0–0.8 (see Fig. 1). These assumptions would in case translate in classifying as “maritime” both dusty conditions with AOT<0.3 and
continentally-affected conditions with AOT<0.3 and FF<0.8. This choice was made in
15
order to prevent us from over predicting the presence of both continental and/or desert dust particles over the Mediterranean. Being very simple, this scheme is certainly as-sociated to some margin of error (i.e. incorrect aerosol type interpretation), particularly at the border lines of the three regions. The performances of the aerosol mask will be evaluated on the basis of specific cases registered in 2001 and chronologically re-20
ported hereafter. Furthermore, the overall (statistical) performance of the aerosol mask will be assessed on the basis of the whole 2001 record in Sect. 3.1.
2.2. Individual tests of the aerosol mask
Four cases are presented to show the response of the aerosol mask to different aerosol
conditions. The latter have been evaluated on the basis of both satellite true-color 25
ACPD
4, 4285–4337, 2004Aerosol seasonal variability over the Mediterranean region
F. Barnaba and G. P. Gobbi
Title Page Abstract Introduction Conclusions References
Tables Figures
◭ ◮
◭ ◮
Back Close
Full Screen / Esc
Print Version Interactive Discussion
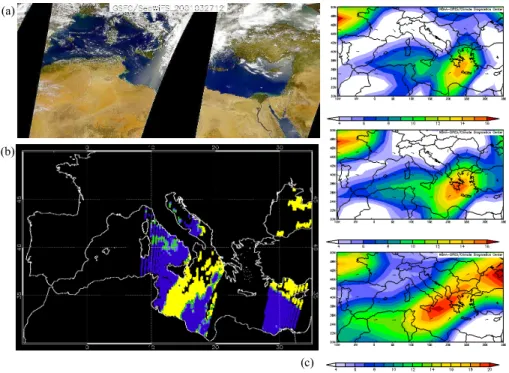
Climate Diagnostic Center, based on NCEP/NCAR re-analysis, Kalnay et al., 1996). The first case, reported in Fig. 2, refers to 26 March 2001, when a dust plume was blown eastward from the Tunisian/Libyan coasts. The SeaWiFS image (Fig. 2a) clearly reveals the geographical extension of the dust plume moving northeast through the Central Mediterranean and reaching up to the Black Sea. The outcome of the aerosol 5
mask applied to this event is shown in Fig. 2b. Here the proposed method appears to reproduce the dust pattern over the Mediterranean. In particular, the southern (cloud-free) edge of the dust plume is well identified (note that in this plot, and in the following case studies, the green border line between the yellow dust plume and the blue mar-itime aerosol region is falsely produced by the graphical interpolation. In fact, no green 10
border is visible when the dust plume is bounded by black, i.e. unclassified, regions). As opposed to Saharan dust, the mask-derived presence of continental aerosols in Fig. 2b (revealed at the eastern coasts of Spain and over the Gulf of Lion, South France), is not as evident in the SeaWiFS image. An explanation of this result can be derived considering the relevant wind field shown in Fig. 2c. The westerly circulation 15
affecting in this plot both Spain and Southern France is likely to transport
continen-tal aerosols from those regions over the Mediterranean Sea. Figure 2c also confirms the dust advection over the Central/Eastern Mediterranean and further indicates that,
depending on height, such advection affects different regions. In fact, at lower levels
(925, 850 mb, i.e. top and central panels, respectively) winds mainly drive dust from 20
Libya to the Eastern Mediterranean while strong winds (v>20 m/s) from Algeria and Tunisia also advect dust to the Central Mediterranean at 700 mb (bottom panel).
The second case, reported in Fig. 3, refers to the following day, i.e. 27 March, when some residual dust was still uplifted eastward from the Libyan coasts as revealed by the SeaWiFS image. The corresponding outcome of the aerosol mask reported in Fig. 3b 25
ACPD
4, 4285–4337, 2004Aerosol seasonal variability over the Mediterranean region
F. Barnaba and G. P. Gobbi
Title Page Abstract Introduction Conclusions References
Tables Figures
◭ ◮
◭ ◮
Back Close
Full Screen / Esc
Print Version Interactive Discussion
(P <850 mb), a piece of information that cannot be derived from the true color image of Fig. 3a on its own. Although no evidence of haze is visible in Fig. 3a, the aerosol mask
indicates aerosol of anthropogenic origin offthe Sardinian coasts in Fig. 3b. Westerly
winds flowing over the island (Fig. 3c) are compatible with this result.
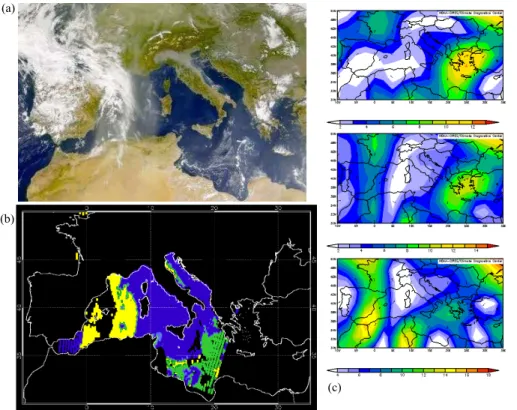
The third case, reported in Fig. 4, refers to 1 August 2001. The SeaWiFS picture 5
in Fig. 4a shows two different conditions characterizing the Western and the Eastern
Mediterranean, respectively. A well defined dust plume is visible in Fig. 4a, extending from North West Africa northward to Spain and eastward almost reaching Sardinia. Conversely, the Eastern Mediterranean is covered by an inhomogeneous haze layer. The outcome of the aerosol mask corresponding to this picture is reported in Fig. 4b. 10
Here, the presence of dust is well identified. In particular, the north eastern edge of the dust plume visible in Fig. 4a is well reproduced in Fig. 4b. In the latter, dust is also de-tected over the Gulf of Biscay (Northern Spain), a region covered by clouds in Fig. 4a but definitely subject to advection from the North West Saharan regions (i.e. Fig. 4c). In the Eastern Mediterranean the aerosol mask identifies a dominance of continental par-15
ticles corresponding to the hazy region in Fig. 4a. The origin of such haze is suggested by the wind maps of Fig. 4c. In fact, a North-easterly flow characterizes the Eastern
Mediterranean at lower levels (925, 850 mb), with the strongest winds (v≥10 m/s) in the
region within Southern Italy and Crete. This advection pattern is likely to transport over the Mediterranean anthropogenic aerosol from Eastern Europe (Romania, Bulgaria) 20
and Turkey and is therefore consistent with the aerosol mask results of Fig. 4b. As a matter of fact, in August 2001 the Mediterranean Intensive Oxidant Study (MINOS) conducted in Crete (Lelieveld et al., 2002) well highlighted the strong advection of pol-lutants over the Mediterranean caused by the northerly transport occurring at the lower levels (Sciare, 2003a). It is worth noticing that, in contrast to such lower-levels pollution 25
advection pattern, the wind field in Fig. 4c indicates dust transport over the Western Mediterranean to mainly occur at the higher levels (850, 700 mb).
Mediter-ACPD
4, 4285–4337, 2004Aerosol seasonal variability over the Mediterranean region
F. Barnaba and G. P. Gobbi
Title Page Abstract Introduction Conclusions References
Tables Figures
◭ ◮
◭ ◮
Back Close
Full Screen / Esc
Print Version Interactive Discussion
ranean with the presence of both dust and haze, characterizing the western and east-ern basin, respectively. In addition, a hazy layer is visible over the Po Valley region (Northern Italy), the Italian east coasts and, partially, over the Adriatic Sea. The corre-sponding outcome of the aerosol mask derived from MODIS data is reported in Fig. 5b. This latter clearly depicts the dust plume transported northward from Algeria and well 5
reproduces both the east and west plume edges. Both Eastern Mediterranean and Adriatic Sea haze layers of Fig. 5a are mainly interpreted as continental aerosol in Fig. 5b. However, some minimal misinterpretation of haze as dust is observed. This is mainly produced by the fine fraction being lower than 0.7 in those regions. As men-tioned in Sect. 2.1, some percentages of misinterpreted pixels were expected to be 10
associated to the proposed aerosol mask. For this day, wind fields in Fig. 5c suggest advection patterns transporting continental aerosol South-westward to the Mediter-ranean basin at the lower levels (from Turkey, Bulgaria, Greece) and Saharan dust transported higher up in the atmosphere from the African continent. In this respect, the four cases presented confirm the general particle type-dependent aerosol vertical dis-15
placement observed by lidar at a Central Mediterranean site (Gobbi et al., 2004), with desert dust dominating the altitude range 2–6 km and continental aerosol prevailing in the boundary layers.
Overall, these results indicate that the aerosol mask performs rather well at dis-tinguishing between maritime, continental and desert dust aerosol employing the stan-20
dard MODIS AOT and FF products. This approach was therefore employed to estimate seasonal contributions of each aerosol type to the total AOT over the Mediterranean. Relevant results are discussed hereafter.
3. Results and discussion
Results of the data analysis are reported in Figs. 6 to 9, referring respectively to the 25
four seasons DJF, MAM, JJA and SON. In each figure, plot a) shows the total mean
ACPD
4, 4285–4337, 2004Aerosol seasonal variability over the Mediterranean region
F. Barnaba and G. P. Gobbi
Title Page Abstract Introduction Conclusions References
Tables Figures
◭ ◮
◭ ◮
Back Close
Full Screen / Esc
Print Version Interactive Discussion
whereas plots b), c) and d) show the mean contribution to AOTS of, respectively,
mar-itime, desert dust and continental aerosol over the basin (AOT∗S,type, the subscript “type”
indicating continental (“cont”), maritime (“mar”) or desert dust (“dust”) aerosols). A
de-tailed definition of the variables AOTS and AOT∗S,type is given hereafter. The synopsis
of the whole set of aerosol optical thickness variables discussed in this study is sum-5
marized in Table 1.
For each 0.1◦×0.1◦pixel, the AOT average over the seasonS, AOTS, is defined as:
AOTS = 1
NS
NS
X
j=1
AOTj (1)
where NS is the total number of AOT retrievals (AOTj) in the seasonS.
Over the ocean, an aerosol type (continental, maritime or desert dust) is associated 10
to each retrieved AOTj employing the mask described in Sect. 2.2. Therefore, for each
seasonS (and for each ocean pixel), the mean AOT associated to the three aerosol
types is computed as:
AOTS,type= 1
NS,type
NS,type
X
j=1
AOTtype,j (2)
where NS,typeis the total number of AOTs classified as “type” (i.e. AOTtype,j) in that pixel
15
during the seasonS.
For each ocean pixel, the seasonal frequency of occurrence of each aerosol type, fS,type, is also derived asfS,type =NS,type/NS (thus resultingfS,cont+fS,mar+fS,dust=1).
This parameter allows to compute the mean seasonal contribution of each aerosol type
to the total AOTS as:
20
AOT∗
S,type=fS,type·AOTS,type (3)
ACPD
4, 4285–4337, 2004Aerosol seasonal variability over the Mediterranean region
F. Barnaba and G. P. Gobbi
Title Page Abstract Introduction Conclusions References
Tables Figures
◭ ◮
◭ ◮
Back Close
Full Screen / Esc
Print Version Interactive Discussion
In Figs. 6a to 9a, missing data (black areas) are found over bright surfaces (e.g. scarcely vegetated areas or regions covered by snow) where the MODIS retrieval is not performed (Kaufman et al., 1997) or in regions corresponding to a persistent pres-ence of clouds during the whole season. Comparison of the four a)-plots in Figs. 6 to 9 reveals the strong seasonal cycle of the aerosol optical thickness all over the Mediter-5
ranean, with the lowest AOT observed in winter and maximum AOT values registered in Spring-Summer. These latter are possibly related to the increase of both photo-chemical and convective activity registered during the warmest months of the year. For example, in central Italy, the higher AOT values registered in Spring-Summer are asso-ciated to aerosol extending up to altitudes of 3-4 km while in the winter months lower 10
AOT are registered with aerosols confined below 2 km (Gobbi et al., 2004). The model-ing study of Duncan and Bey (2004) also highlights the important role of convection as a pathway for the export of European pollution to the middle troposphere in summer. It is also worth mentioning that surface aerosol mass measurements (PM2.5 and PM10) performed all over Europe (Van Dingenen et al., 2004; Putaud et al., 2004) show an 15
opposite trend, i.e. summer minimum and winter maximum aerosol mass. In fact, the low convective activity of the winter months is likely to keep the aerosol particles in the lower levels where these are sampled by the ground-based instrumentation. Con-versely, in the warmer months, both reduced RH at the ground and convection-driven mixing of atmospheric particulate to the higher levels translate into a lower amount of 20
aerosol mass to be measured by in situ samplers at the ground. These results confirm that knowledge of the vertical distribution of the particles is necessary when trying to correlate aerosol columnar quantities (as the AOT) to particulate measurements (as PM) at the ground (e.g. Chu et al., 2003; Wang and Christopher, 2003).
Another general feature emerging from Figs. 6a–9a is the impact of some major 25
European cities and/or industrialized areas. The Po Valley region (i.e. the most
indus-trialized Italian area) is the most evident case of such an effect. An increase in AOT is
ACPD
4, 4285–4337, 2004Aerosol seasonal variability over the Mediterranean region
F. Barnaba and G. P. Gobbi
Title Page Abstract Introduction Conclusions References
Tables Figures
◭ ◮
◭ ◮
Back Close
Full Screen / Esc
Print Version Interactive Discussion
observed in plots a) of Figs. 6–9 can be well related to anthropogenic sources as sug-gested by recent studies performed by Robles Gonzales et al. (2003) and Schaap et al. (2004) by means of chemical-transport models. These studies (in which primary aerosol as sea salt or dust are not considered) show the AOT field over Europe to be strongly related to the distribution of emission of inorganic aerosol precursor (sulfates, 5
nitrates). For example, the Po Valley and the Eastern Europe region (e.g. Hungary,
Bulgaria) are shown to be characterized by higher concentrations of NO3 and/or SO4
and SO2 with respect to Western Europe, where high values of this constituents are
only found in the northern coast of Spain. Overestimated AOT values are likely to affect
the Nile-delta region in Figs. 6–9a), due to water contamination. 10
The winter plots of Fig. 6 show the AOT in the Mediterranean region to be mostly confined below 0.15–0.20, with higher values over land only registered in Northern Italy, Western France and in the Hungarian region. AOT values higher that 0.15 over the Mediterranean Sea are mainly related to some Saharan dust transport as revealed by Fig. 6c). However, minimum incidence of dust transport is registered in this season, 15
in agreement with the seasonal analysis by Gobbi et al. (2004) performed employing lidar data collected at Rome in the year 2001. Figure 6d reveals some advection of continental aerosol over the Mediterranean with larger impact in all the North-North Eastern regions. This pattern is compatible with the dominance of Westerlies over the Mediterranean in Winter (e.g. Stohl et al., 2002).
20
Opposite to the winter case, the Spring plots of Fig. 7 show a mean Mediterranean AOT generally higher than 0.15 over both land and ocean. In the Po Valley region AOT reaches values higher than 0.45, almost double with respect to Winter. Figsures 7c and 7d reveal that both dust and continental aerosols contribute to the high AOT val-ues observed over the Mediterranean and the Black Sea. In particular, a major impact 25
of Saharan dust is evident over the Eastern and the Central Mediterranean, while
ad-vection of continental aerosol mainly affect Western and Central Mediterranean as well
ACPD
4, 4285–4337, 2004Aerosol seasonal variability over the Mediterranean region
F. Barnaba and G. P. Gobbi
Title Page Abstract Introduction Conclusions References
Tables Figures
◭ ◮
◭ ◮
Back Close
Full Screen / Esc
Print Version Interactive Discussion
highlighted a maximum impact of pollution events over central Europe in Spring. How-ever, in that study July and August data were not available. Comparison of Figs. 7a and 7c shows the contribution of dust to the total AOT to reach 60% close to the Libyan and Egyptian-Israeli coasts. A similar contribution by continental aerosol is found to the North of Spain, in the Black Sea and in the Northern Adriatic Sea (right in the outflow 5
of the Po Valley region).
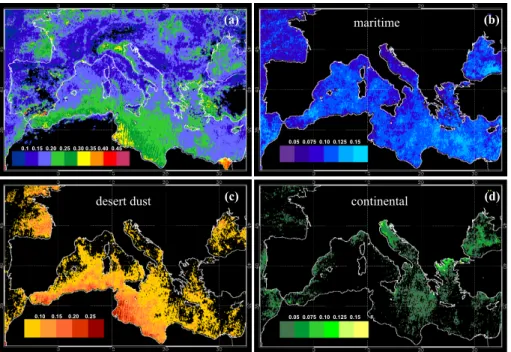
As already pointed out, maximum aerosol optical thickness values are reached in Summer (Fig. 8), with AOT>0.2 prevailing over both the European continent and the Mediterranean basin. Actually, the summer AOT field of Fig. 8a) compares quite well with the one retrieved at 555 nm by Robles Gonzales et al. (2003) employing August 10
1997 data collected by the ATSR-2 radiometer on board the ESA ERS-2 platform. Overall, model calculations performed over Europe for the summer period (August) by Robles Gonzales et al. (2003) suggest a contribution to the total AOT (at 555 nm) up to 70% by sulphates and 10% by nitrates. Figure 8a shows a particular AOT in-crease with respect to Spring over Eastern Europe (AOT>0.3 over Hungaria, Romania, 15
Ukraine). This effect is possibly connected to the frequent biomass burning events that
occurred in Eastern Europe in the Summer 2001 (e.g. Salisbury et al., 2003; Sciare et al., 2003b). It is worth mentioning that, although not specifically addressed in this study, biomass burning episodes are likely to be classified as continental aerosol in our scheme. In fact, these are characterized by high AOT associated to a large frac-20
tion of fine particles (e.g. Dubovik et al., 2002). In Fig. 8a, high AOT values are ob-served in Crete and in the Southeastern European coastal regions (mainly Greece and Turkey). Some water contamination in land pixels and water color impact on the
ocean pixels are likely responsible for this effect. It is however worth mentioning that
the observed MODIS AOT as high as 0.4 (±0.13) in Crete and along the Turkish coasts
25
are still compatible with the AERONET data (http://aeronet.gsfc.nasa.gov). In fact, the
AERONET quality assured AOT values available for those areas in this period of the
year show a mean AOT=0.23±0.08 in the FORTH-Crete site (35.3◦N, 25.7◦E, Crete,
ACPD
4, 4285–4337, 2004Aerosol seasonal variability over the Mediterranean region
F. Barnaba and G. P. Gobbi
Title Page Abstract Introduction Conclusions References
Tables Figures
◭ ◮
◭ ◮
Back Close
Full Screen / Esc
Print Version Interactive Discussion
site (36.6◦N, 34.2◦E, Turkey, August 2000).
Figure 8d shows the Summer impact of continental aerosol (maximum of the year) to extend all over the basin, with particular strength over the Central and Eastern Mediter-ranean (with the exception of the area South of Cyprus). Overall, the AOT pattern in Fig. 8d suggests a prevalent northerly flow in the lower layers, where transport of pol-5
lutants mainly occurs (e.g. Stohl et al., 2002). In this respect, an analysis of air mass trajectories in the Mediterranean during the MINOS campaign (August 2001) performed by Lelieveld et al. (2002), revealed a dominant northerly flow below 4 km, confirming results by Stohl et al. (2002) and Duncan and Bey (2004) of a Summer southward flow of European pollution over the Mediterranean basin and Africa. Conversely, in 10
the middle and upper troposphere (i.e. in the region where the Saharan dust transport mainly occurs), Lelieveld et al. (2002) found westerly/southerly winds to prevail. In fact, similarly to the Spring case (Fig. 7), the Summer continental aerosol distribution in the Mediterranean basin appears to complement the Saharan dust one (Figs. 8c and 8d). In particular, continental aerosol dominate the Central and Eastern basin whereas a 15
major impact of dust is observed in the Central-Western Mediterranean. With respect to the Spring conditions, a Summer westward shift of Saharan dust transport is thus observed in 2001. This is in agreement with the general pattern of dust transport over the Mediterranean emerging from multi annual analysis of satellite data (Moulin et al., 1998; Israelevich et al., 2002). It is also worth noticing that the minor impact of both 20
continental and dust aerosol over the South-eastern Mediterranean (south of Cyprus) reveals the large maritime contribution to the AOT in this region (Fig. 8b). A Summer increase in biogenic (marine phytoplankton) sulphate aerosols could account for such result. In fact, an important impact of biogenic sulphur is found in the Summer Eastern Mediterranean atmosphere, even though the major source of sulphate in this region is 25
ACPD
4, 4285–4337, 2004Aerosol seasonal variability over the Mediterranean region
F. Barnaba and G. P. Gobbi
Title Page Abstract Introduction Conclusions References
Tables Figures
◭ ◮
◭ ◮
Back Close
Full Screen / Esc
Print Version Interactive Discussion
as well as over Southern Mediterranean. In this latter region AOT values are affected
by Saharan dust whose contribution to the total AOT is still of the order of 50%, and even larger close to the African coasts (Fig. 9c). While a minimum impact of Saharan dust is observed in winter (Fig. 6c), the minimum impact of continental aerosol is regis-tered in Fall (Fig. 9d), with residual continental influences mainly visible in the Northern 5
Adriatic Sea (outflow of the Po Valley region) and in the Greek Halkidiki peninsula. In this respect, it is worth mentioning a further factor playing a major role in
determin-ing the observed aerosols seasonal pattern: the precipitation, i.e. the most efficient
removal process of atmospheric particulate. In fact, the observed seasonal pattern of the Mediterranean AOT should also be interpreted in connection to the seasonal and 10
latitudinal pattern of precipitation in the Mediterranean (e.g. Mariotti et al., 2002). In particular, even considering the mentioned increase of photochemical and convective activity in Spring-Summer, the higher mean AOT registered in this period of the year is also a consequence of a minimum aerosol scavenging by precipitation. Conversely, the higher precipitation rate registered over the Mediterranean in Fall and Winter (par-15
ticularly at latitudes≥40◦N) tends to reduce the mean residence time of aerosols in the
atmosphere, and, in turn, the mean AOT. In the case of non-local aerosol (e.g.
conti-nental aerosol transported over the Mediterranean), this precipitation effect is expected
to be even more evident. In fact, when aerosols travel time is comparable to the mean time interval between two rain events, the advection-related aerosol load cannot be 20
completely re-established (e.g. Bergametti et al., 1989). Interestingly, during the year
2001 the highest seasonal rain rates (Rr) over the Mediterranean basin were registered
in Fall (Rr mean values higher than 2 mm/day) with maximum values (Rr>3 mm/day)
over the Adriatic Sea, the Balearic Islands and the Cyprus region. In Winter the mean
Rr over the basin was 1.5–2.5 mm/day whereas the Spring and Summer means were
25
ACPD
4, 4285–4337, 2004Aerosol seasonal variability over the Mediterranean region
F. Barnaba and G. P. Gobbi
Title Page Abstract Introduction Conclusions References
Tables Figures
◭ ◮
◭ ◮
Back Close
Full Screen / Esc
Print Version Interactive Discussion
3.1. Mediterranean AOT data summary
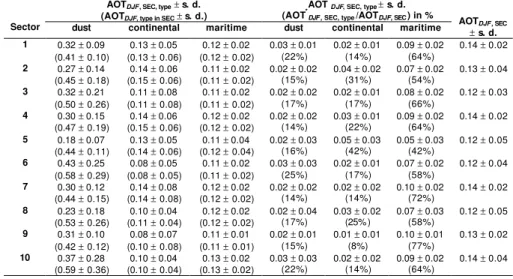
To provide a summary of the seasonal and regional variability discussed so far, aerosol optical thicknesses averaged over both season and Mediterranean sectors were com-puted and are reported in Table 2. Regional averages have been performed consid-ering the Mediterranean basin as divided into the ten sectors (SEC) shown in Fig. 10. 5
These were selected to define a Western, Central and Eastern Mediterranean basin
(longitudinal partitions at 8◦and 21◦W) and to facilitate the evaluation of North-to-South
AOT gradients (latitudinal partitions at 35◦, 38◦ and 41◦N). Tables 2a, 2b, 2c, 2d refer
to the Winter, Spring, Summer and Fall averages, respectively. A detailed definition of the variables reported in Table 2 is given hereafter (see also Table 1). The seasonal 10
averages shown in Figs. 6–9 (AOTS,type and AOT
∗
S,type derived for each ocean pixel)
were averaged regionally, i.e. for the ten sectors of Fig. 10 the following quantities were computed:
AOTS,SEC,type=
1
PSEC
Ptype,SEC
X
Pk=1
AOTS,type,Pk (4)
AOT∗S,SEC,type= 1
PSEC
Ptype,SEC
X
Pk=1
AOT∗S,type,P
k (5)
15
where the subscript Pk indicates the k-th pixel in sector SEC; Ptype,SEC is the total
number of pixels in SEC in which the parameter AOTS,type (and AOT
∗
S,type) is defined;
and PSEC is the total number of pixels in the sector SEC (independent of the aerosol
type).
It is worth noticing that, since an aerosol type is not necessarily detected in the 20
whole sector during a season (i.e. being Ptype,SEC≤PSEC), the quantity AOTS,SEC,type
ACPD
4, 4285–4337, 2004Aerosol seasonal variability over the Mediterranean region
F. Barnaba and G. P. Gobbi
Title Page Abstract Introduction Conclusions References
Tables Figures
◭ ◮
◭ ◮
Back Close
Full Screen / Esc
Print Version Interactive Discussion
classified as “type” in sector SEC (it is: AOTS,SEC,type = PSEC1
PtypeP,SEC
Pk=1
AOTS,type,Pk ≤
1 Ptype,SEC
PtypeP,SEC
Pk=1
AOTS,type,Pk =AOTS,type in SEC).
For example: the quantity AOTDJF,5,dust is the desert dust average AOT over the
whole sector 5 in winter (0.18±0.07). However, since only a fraction of sector 5 was
covered by dust, AOTDJF,5,dustis smaller than the mean AOT of dust events in the sector
5
AOTDJF,dust in 5(0.44±0.11). For completeness, the whole set of AOTS,SEC,typevalues
are also given in Table 2 (in parentheses).
Data presented in Table 2 clearly show the following:
1. A seasonal pattern of the aerosol optical thickness in the Mediterranean, with
mean AOT values (AOTS,SEC) spanning the range 0.12–0.14 in Winter, 0.17–0.28
10
in Spring, 0.20–0.28 in Summer and 0.15–0.26 in Fall.
2. A seasonal cycle of dust distribution within the basin, associated to a South-to-North gradient. In fact, a Spring maximum dust impact is found in the
Eastern-Central Mediterranean (AOTMAM,SEC,dust>0.45, with dust percentage AOT
con-tribution >40% in Sectors 10-8 and 9-7-4, respectively). In Summer and Fall
15
dust maxima shift to the Central-Western Mediterranean (AOTJJA,SEC,dust and
AOTSON,SEC,dust≥0.44 in Sectors 9-7-4, and 6-3, with dust percentage
contri-butions to AOT≥28%). In Winter a residual dust activity is registered in the
Western part of the basin (AOTDJF,SEC,dust≥0.32 in Sectors 6-3-1) but in the
South-Eastern Mediterranean the beginning of a “new cycle” is also detected 20
(AOTDJF,SEC,dust=0.37 in Sector 10).
ACPD
4, 4285–4337, 2004Aerosol seasonal variability over the Mediterranean region
F. Barnaba and G. P. Gobbi
Title Page Abstract Introduction Conclusions References
Tables Figures
◭ ◮
◭ ◮
Back Close
Full Screen / Esc
Print Version Interactive Discussion
(>30%), in Sectors 1, 2, 5 in Spring (≥35%), in Sectors 1, 2, 4, 5, 8 in Summer
(≥43%) and again in Sectors 2 and 5 in Fall (≥19%).
A graphical representation of these patterns in terms of aerosol mass is provided in the following Sect. 3.2.
The sector analysis was also used as a control tool of the criteria adopted to built the 5
aerosol mask. To this purpose, the mean seasonal AOT values characterizing each
aerosol type in the different sectors (i.e. the AOTS,type in SEC values in Table 2) were
associated to the corresponding mean seasonal fine fraction values, FFS,type in SEC.
Relevant results are shown in Fig. 11, where the three regions of the aerosol mask (see Fig. 1) have also been indicated. This graph confirms that the three FF vs. AOT 10
regions selected are well suited to identify the three aerosol types. This is because the distribution of points in the three regions of Fig. 11 (maritime, continental and dust) shows no tendency to overlap. Conversely, a concentration of points along the regions limits would have been found for a wrong choice of the three regions thresholds. In particular, a clear-cut distinction between continental and desert dust aerosol emerges, 15
not only in terms of fine fraction (imposed) but also in terms of AOT. This means that, even if high AOT can be associated to some episodes of continental aerosol transport, these conditions are I) not frequent (mean continental AOT<0.3 and mean desert dust AOT>0.4 in Fig. 11 and Table 2), and II) well discernible from dust events by the aerosol mask (definite distinction between continental and dust points in the FF vs. AOT space 20
of Fig. 11).
3.2. Estimation of the aerosol mass loading
Starting from AOT values, estimates of the column aerosol loading, M (g/m2), can
be derived employing an appropriate conversion factor, generally referred to as the
mass-to-extinction efficiency, α=AOT/M (m2/g). Since both AOT and M depend on
25
particles physical and optical properties, substantially differentαare associated to
ACPD
4, 4285–4337, 2004Aerosol seasonal variability over the Mediterranean region
F. Barnaba and G. P. Gobbi
Title Page Abstract Introduction Conclusions References
Tables Figures
◭ ◮
◭ ◮
Back Close
Full Screen / Esc
Print Version Interactive Discussion
IPCC report (Table 5.1 in IPCC, 2001) where these are classified on the basis of
ge-ographical region and/or aerosol type. As examples, α=3.5±1.2 andα=1.8±0.5 are
there given for “polluted continental” and “Pacific marine (accumulation and coarse
mode)” aerosol, respectively. While some studies provided α values of desert dust
over the Mediterranean (e.g. Dulac et al., 1992), to our knowledge no specific value is 5
reported for continental and maritime aerosol types in this region. We then performed
an original investigation to evaluate the α values typical of the three Mediterranean
aerosol types addressed in this study. To this purpose, we employed 1) lidar
mea-surements to determine typical aerosol extinction coefficients and 2) aerosol models to
link such aerosol extinction values to the relevant mass. These models were specifi-10
cally developed to invert lidar measurements in maritime, continental and desert-dust conditions (Barnaba and Gobbi, 2001; Barnaba and Gobbi, 2004). Both lidar observa-tions and numerical computaobserva-tions refer to the wavelength of 532 nm, i.e. very close to the 550 nm MODIS one. Lidar observations performed at Mediterranean sites under appropriate aerosol load conditions have been considered. In particular, lidar mea-15
surements for the year 2001 collected in a semi-urban site at the outskirts of Rome
(41.8◦N, 12.6◦E), Italy (Gobbi et al., 2004) were used to derive a suitable α value of
continental aerosols (αcont). Considering the mean distance between the Rome site
and the Saharan region (about 1000–1500 km), lidar measurements recorded in Rome during the seven major dust events registered in 2001 were used as representative of 20
transported desert dust conditions to derive a typical Mediterraneanαdust. Finally, lidar
observations performed in Crete (35.5◦N, 23.7◦E), Greece, in May 1999 (Gobbi et al.,
2000) were employed as representative of Mediterranean maritime conditions to derive
αmar. A detailed description of the procedure employed to derive the three investigated
mass-to-extinction efficiencies is given in Appendix A. The resulting coefficients are:
25
αcont=2.8,αdust=1.36 andαmar=1.85 for continental, desert dust and maritime aerosol,
respectively. It is worth mentioning that ourαdustvalue is in good agreement with the
one (α=1.3) employed by Dulac et al. (1992) to estimate desert dust columnar mass
ACPD
4, 4285–4337, 2004Aerosol seasonal variability over the Mediterranean region
F. Barnaba and G. P. Gobbi
Title Page Abstract Introduction Conclusions References
Tables Figures
◭ ◮
◭ ◮
Back Close
Full Screen / Esc
Print Version Interactive Discussion
The two others coefficients,αcontandαmar, fall well within the variability range of IPCC.
Based on these mass-to-extinction efficiencies, the mean seasonal (S) maritime,
continental and desert dust mass loads, evaluated for each of the ten sectors (SEC) of Fig. 10 (i.e. M∗S,SEC,type=AOT∗S,SEC,type/αtype, expressed in g/m
2
) are shown in Fig. 12.
Here, sectors corresponding to Western (SEC=1, 3, 6), Central (SEC=2, 4, 7, 9) and
5
Eastern (SEC=5, 8, 10) Mediterranean basin have been reported in separated plots
(first, second and third column of Fig. 10, respectively) in order to better highlight the
regional, longitudinal differences. Moreover, this representation allows easy evaluation
the meridional gradient of both the continental and desert dust aerosols.
Considering the area of each sector, mean seasonal aerosol mass loads (i.e. 10
P
SEC
M∗S,SEC,type×SECArea) were computed and are summarized in Table 3. For each
aerosol type, mass values in Table 3 can be considered as the typical load character-izing each day during the season. Table 3 shows that the total suspended mass of
desert dust over the Mediterranean basin in the year 2001 (4.3×10⁴ktons) is
compa-rable to that of maritime aerosol, although (as already discussed) the former exhibits a 15
seasonal cycle. The almost constant value of the maritime aerosol mass over the sea-sons (mean value 111 ktons/day associated to a standard deviation, s.d. of 17 Mtons, i.e. 15%) can be considered as a further confirmation of the consistency of the aerosol mask scheme presented.
With respect to the total dust load of 4.3×10⁴ ktons, this should be considered as
20
a lower limit of the actual value due to three different points as described hereafter.
1) To give an estimation of the total dust loaded in the atmosphere during the year, every dust event observed should be considered at its maximum (in terms of both AOT and extent). However, by definition, the seasonal means performed in this study do not capture the dust plumes at their maximum but rather weigh their amplitude all over 25
the dust event. 2) The desert dust mass-to-extinction factor, αdust=1.36, represents
a mean Mediterranean value. It can be considered as a typical value of long-range
(>1000 km) transported dust. As shown in Appendix A, theα parameter is very
ACPD
4, 4285–4337, 2004Aerosol seasonal variability over the Mediterranean region
F. Barnaba and G. P. Gobbi
Title Page Abstract Introduction Conclusions References
Tables Figures
◭ ◮
◭ ◮
Back Close
Full Screen / Esc
Print Version Interactive Discussion
increasing mean size of the particles sounded (e.g. Cachorro and Tanr ´e, 1997). For
example,αdust=0.96 andαdust=0.93 were obtained (following the approach described
in Appendix A) employing lidar observations of Saharan dust plumes observed closer to the source region, i.e. over the Canary Islands (August 2002) and Sicily (July 2003), respectively. 3) The AOT data considered in this study are cloud-screened. In fact, dust 5
transport over the Mediterranean is generally associated with meteorological fronts so that presence of dust is often associated to water clouds. Therefore, being that dust is inevitably undetected in cloudy pixels, dust occurrence frequency is expected to be un-derestimated, thus leading to an underestimation of its impact in terms of mean AOT* and mass.
10
4. Conclusions
One year (2001) of aerosol optical thickness (AOT, at 550 nm) data from the MODIS instrument (NASA-Terra) were analyzed in order to evaluate the aerosol seasonal and geographical variability over the Mediterranean region. This study highlighted a strong AOT seasonal cycle over the whole Mediterranean region, with minimum and maxi-15
mum values in Winter (AOT mainly below 0.15) and Summer (AOT mainly above 0.2), respectively. Over land, this study shows that, even when seasonal averages are ad-dressed, the impact of big cities and/or industrialized areas is well detectable in terms of higher AOT levels. In Europe, the Po Valley (i.e. the most industrialized Italian area)
is shown to be particularly affected by high AOT values with respect to the surrounding
20
regions. This is likely to be due to both the high level of aerosol gas precursor emis-sions and the particular orography of the region (an extended valley bounded to the North, West and South by mountains) that facilitates the pollutants entrapment.
Over ocean, an aerosol mask was implemented to separate the contribution to the total AOT of the three aerosol types prevailing over the Mediterranean basin, i.e. mar-25
ACPD
4, 4285–4337, 2004Aerosol seasonal variability over the Mediterranean region
F. Barnaba and G. P. Gobbi
Title Page Abstract Introduction Conclusions References
Tables Figures
◭ ◮
◭ ◮
Back Close
Full Screen / Esc
Print Version Interactive Discussion
mask showed good correspondence with the actual aerosol field evaluated by means of both true-color satellite images and wind fields. Examination of case studies also
highlighted advection of continental and desert dust aerosol to occur at different levels,
i.e. mainly within and above the planetary boundary layer, respectively.
Application of the aerosol mask to the whole 2001 dataset allowed to identify some 5
clear features of the atmospheric particulate in the Mediterranean. The export of both continental and dust particles over the basin was found to be important. As expected, continental aerosol were found to impact mainly the coastal regions throughout the year. However, in the warmest seasons (Spring and Summer) these particles were found to impact the whole basin, with a relative contribution to the total AOT up to more 10
than 60% in the Italian and Greek-Turkish coastal regions. A North-to-South gradient of continental aerosol optical thickness is evident in this case. An opposite South-to-North AOT gradient is associated to Saharan dust export, this latter showing a marked seasonal cycle. In fact, while in Spring maximum dust impact is found in
Eastern-Central Mediterranean (dust AOT contribution >40%), in Summer-Fall a shift to the
15
Central-Western Mediterranean is observed. In Winter 2001 a residual dust activity is registered in the Western part of the basin while in the South-Eastern Mediterranean the beginning of a “new cycle” is detected.
Atmospheric aerosol mass load estimates were performed applying appropriate extinction-to-mass conversion factors (α) to the seasonal AOT averages of maritime, 20
continental and desert dust particles. Theα values employed for the three different
aerosol types addressed in this study were specifically derived on the basis of lidar ob-servations and modeling studies. Overall, a total seasonal mean value of 119 ktons of desert dust per day was found to characterize the Mediterranean atmosphere,
translat-ing into a total of 4.3×10⁴ktons of dust in the year 2001. A similar total mass load was
25
found to be associated to maritime aerosol (4.0×10⁴ ktons). However, as expected,
ACPD
4, 4285–4337, 2004Aerosol seasonal variability over the Mediterranean region
F. Barnaba and G. P. Gobbi
Title Page Abstract Introduction Conclusions References
Tables Figures
◭ ◮
◭ ◮
Back Close
Full Screen / Esc
Print Version Interactive Discussion
basin in 2001 is estimated to be 1.2 Mtons.
On the whole, this study provides a quantitative overview of the aerosol seasonal
variability over the Mediterranean region, well representing the impact of the different
aerosol types over the Mediterranean basin. The AOT data presented over both land and ocean are thought to be important to provide a base of comparison for chemistry-5
transport models. Further investigation considering a wider dataset is envisaged to evaluate the inter-annual variability of the Mediterranean particulate.
Appendix A: Deriving the mass-to-extinction efficiency values
Mass-to-extinction efficiency values (α=AOT/M) typical of the three Mediterranean
aerosol types addressed in this study were obtained by combining numerical com-10
putations based on aerosol models and lidar observations.
As mentioned in Sect. 3.1, AOT and M depending on particles physical and optical
properties,α values strongly depend on the specific characteristic of the aerosol type
under investigation. In particular, it is:
AOT=
Z
z
σext(z)dz (A1)
15
M=(4/3)πρ·
Z
r
r3n(r)dr=ρ·V, (A2)
wherezis the altitude,σextis the aerosol extinction coefficient,ρis the aerosol particle
density andn(r) is the aerosol number size distribution. In Eq. (A2) an assumption of
particle sphericity is made.
To derive typicalαvalues, we employed a numerical technique specifically developed
20
to derive typical mean aerosol optical and physical properties. In particular, mean prop-erties of maritime, desert-dust and continental aerosol were addressed as thoroughly described in Barnaba and Gobbi (2001) and Barnaba and Gobbi (2004). In that
ACPD
4, 4285–4337, 2004Aerosol seasonal variability over the Mediterranean region
F. Barnaba and G. P. Gobbi
Title Page Abstract Introduction Conclusions References
Tables Figures
◭ ◮
◭ ◮
Back Close
Full Screen / Esc
Print Version Interactive Discussion
volume, V (cm3/cm3), were computed for size distributions and refractive indices typical
of each aerosol type. Each computation was performed randomly choosing the aerosol microphysical parameters (size distribution, refractive index) within appropriate ranges
fixed according to data available in literature. In the present study, those V andσext
computations were employed to investigate the dependence of theαparameter onσext
5
for the three different aerosol types. To start, we will first refer to the mass-to-extinction
efficiency for unit density (i.e.α∗
(m2/g)=σext/V·ρ, withρ=1 g/cm
3
). The outcome of this
analysis is given in Fig. 13, whereα∗
is plotted with respect to the relevantσext(km
−1
),
for each aerosol type. Note that the 0.01km−1-stepσextvalues reported in Fig. 13 were
obtained binning the original 20,000σextones. The corresponding meanα
∗
value as-10
sociated to each bin is reported with its variability (±1 standard deviation) in Fig. 13.
As can be noticed, due to the different microphysical aerosol properties, a substantially
differentα∗
versusσextbehavior is obtained for the three aerosol types.
From these general curves, it was then necessary to derive, for each aerosol type, a
reliable, meanα∗ value to be applied as a mass-to-extinction efficiency to the satellite
15
AOT retrievals. This was done by weighting the α∗
values in Fig. 13 for the actual,
i.e. observed, frequency of occurrence of theσext values for the three aerosol types.
To this purpose, lidar σext tropospheric profiles measured at Mediterranean sites
un-der relevant aerosol load conditions were consiun-dered. In particular, one-year (2001)
lidar measurements collected at the outskirts of Rome (41.8◦N, 12.6◦E), Italy (Gobbi
20
et al., 2004) were used as representative of continental conditions; lidar measure-ments recorded at the same site during seven major dust events registered in 2001 were used as representative of dust load conditions; lidar observations performed in
Crete (35.5◦N, 23.7◦E), Greece in May 1999 (Gobbi et al., 2000) were employed as
representative of maritime conditions. 25
For each case, lidar data of aerosol extinction were binned with 0.01 km−1-step
to evaluate the frequency of occurrence of the different σext values (only values
σext>0.001 km
−1
were considered). Due to the typically different vertical displacement
er-ACPD
4, 4285–4337, 2004Aerosol seasonal variability over the Mediterranean region
F. Barnaba and G. P. Gobbi
Title Page Abstract Introduction Conclusions References
Tables Figures
◭ ◮
◭ ◮
Back Close
Full Screen / Esc
Print Version Interactive Discussion
ent altitude ranges of the tropospheric lidar profile were considered, i.e. 0<z< 4 km
for continental aerosol, 2 km<z<6 km for desert dust aerosol and 0 km<z<2 km for
maritime aerosol. Overall, a total of 17436, 1586, and 1332 σext observations were
employed for continental, desert dust and maritime aerosol, respectively. The resulting
σextfrequency distributions for the three aerosol types are shown in the histograms of
5
Fig. 14. As can be observed, due to the particles larger size, higherσext values are
generally registered in desert dust (Fig. 14b) and maritime (Fig. 14c) conditions with respect to the continental case (Fig. 14a). Note however the larger width of the dust
σextfrequency spectra with respect to the maritime case.
Combining results of Fig. 13 with data of Fig. 14, meanα∗
values for the three aerosol 10
types were derived asα∗=[Σbin(αbin∗ ·Observationsbin)/ΣbinObservationsbin]. These are
α∗
cont=5.6, α ∗
dust=3.4 and α
∗
mar=3.7 for continental, desert dust and maritime aerosol
respectively. From these α∗
values (as mentioned referred to ρ=1), the three
mass-to-extinction efficiencies were finally obtained as αcont=2.8,αdust=1.36 andαmar=1.85
considering a particle densityρ=2.0 g/cm3for both continental and maritime aerosols
15
ACPD
4, 4285–4337, 2004Aerosol seasonal variability over the Mediterranean region
F. Barnaba and G. P. Gobbi
Title Page Abstract Introduction Conclusions References
Tables Figures
◭ ◮
◭ ◮
Back Close
Full Screen / Esc
Print Version Interactive Discussion Appendix B: Acronyms
ADEOS Advanced Earth Observing Satellite
AERONET Aerosol Robotic Network
ATSR-2 Along Track Scanning Radiometer 2
CIRES Cooperative Institute for Research in Environmental Sciences
EOS Earth Observing System
ERS2 European Remote Sensing Satellite 2
ESA European Space Agency
FORTH Foundation for Research and Technology – Hellas
IMS – METU Institute of Marine Sciences – Middle East Technical University
MISR Multiangle Imaging Spectro Radiometer
MODIS Moderate-resolution Imaging Spectroradiometer
NASA National Aeronautics and Space Administration
NCEP National Centers for Environmental Prediction
NCAR National Center for Atmospheric Research
NOAA National Oceanic and Atmospheric Administration
POLDER Polarization and Directionality of the Earth Reflectance
SeaWiFS Sea-viewing Wide Field-of-view Sensor
Acknowledgements. The authors would like to thank the MODIS Science Data Support Team
and the Earth Observing System Data Gateway for processing and distribution of MODIS data, respectively. We gratefully acknowledge 1) the SeaWiFS Project (Code 970.2) – NASA
God-5
dard Space Flight Center (Greenbelt, Maryland, USA) for providing the true colors images via the website http://seawifs.gsfc.nasa.gov/cgi/seawifs subreg.pl, and 2) the NOAA-CIRES Cli-mate Diagnostics Center (Boulder, Colorado, USA) for providing the wind field images via the web sitehttp://www.cdc.noaa.gov.
F. Barnaba performed this study in the framework of the GASTRAN project funded by the Italian
10
ACPD
4, 4285–4337, 2004Aerosol seasonal variability over the Mediterranean region
F. Barnaba and G. P. Gobbi
Title Page Abstract Introduction Conclusions References
Tables Figures
◭ ◮
◭ ◮
Back Close
Full Screen / Esc
Print Version Interactive Discussion References
Avila, A., Alarcon, M., and Queralt, I.: The chemical composition of dust transported in red rains – its contribution to the biogeochemical cycle of a holm oak forest in Catalonia (Spain), Atmos. Environ., 32, 179–191, 1998.
Barnaba, F. and Gobbi G. P.: Lidar estimation of tropospheric aerosol extinction, surface area
5
and volume: Maritime and desert-dust cases, J. Geophys. Res., 106-D3, 3005–3018, 2001. Barnaba, F. and Gobbi, G. P.: Modeling the aerosol extinction versus backscatter relationship for lidar applications: maritime and continental conditions, J. Atmosp. Oc., 21, 428–442, 2004.
Bergametti, G., Dutot, A.-L., Buat-Menard, P., Losno, R., and Remoudaki, E.: Seasonal
Vari-10
ability of the Elemental Composition of Atmospheric Aerosol over the Northwestern Mediter-ranean, Tellus, B, 41, 353–361, 1989.
Cachorro, V. E. and Tanr ´e, D.: The correlation between particle mass loading and extinction: application to desert dust aerosol content estimation, Remot. Sen. E., 60, 187–194, 1997. Collaud Coen, M., Weingartner, E., Schaub, D., Hueglin, C., Corrigan, C., Schwikowski, M.,
15
and Baltensperger, U.: Saharan dust events at the Jungfraujoch: detection by wavelength dependence of the single scattreing albedo and analysis of the events during the years 2001 and 2002, Atmos. Chem. Phys. Discuss., 3, 5547–5594, 2003.
Chu, D. A., Kaufman, Y. J., Ichoku, C., Remer, L. A., Tanr ´e, D., and Holben, B. N.: Val-idation of MODIS aerosol optical depth retrieval over land, Geophys. Res. Lett., 29, 12,
20
doi:10.1029/2001GL013205, 2002.
Chu, D. A., Kaufman, Y. J., Zibordi, G., Chern, J. D., Mao, J., Li, C., and Holben, B. N.: Global monitoring of air pollution over land from the Earth Observing System-Terra Moderate Resolution Imaging Spectroradiometer (MODIS), J. Geophys. Res., 108, 4661, doi:10.1029/2002JD003179, 2003.
25
De Tomasi, F., Blanco, A., and Perrone, M. R.: Raman lidar monitoring of extinction and backscattering of Africa dust layers and dust characterization, Appl. Optics, 42, 1699–1709, 2003.
Di Sarra, A., Di Iorio, T., Cacciani, M., Fiocco, G., and Fu `a, D.: Saharan dust profiles measured by lidar at Lampedusa, J. Geophys. Res., 106, 10 335–10 348, 2001.
30