Phosphorylation of PPARγ
Affects the
Collective Motions of the PPARγ-RXRα-DNA
Complex
Justin A. Lemkul1, Stephanie N. Lewis1,2, Josep Bassaganya-Riera2, David R. Bevan1*
1Department of Biochemistry, Virginia Tech, Blacksburg, Virginia, United States of America,2Nutritional Immunology & Molecular Medicine Laboratory, Virginia Bioinformatics Institute, Virginia Tech, Blacksburg, Virginia, United States of America
Abstract
Peroxisome-proliferator activated receptor-γ(PPARγ) is a nuclear hormone receptor that forms a heterodimeric complex with retinoid X receptor-α(RXRα) to regulate transcription of genes involved in fatty acid storage and glucose metabolism. PPARγis a target for pharma-ceutical intervention in type 2 diabetes, and insight into interactions between PPARγ, RXRα, and DNA is of interest in understanding the function and regulation of this complex. Phosphorylation of PPARγby cyclin-dependent kinase 5 (Cdk5) has been shown to dysre-gulate the expression of metabolic regulation genes, an effect that is counteracted by PPARγligands. We applied molecular dynamics (MD) simulations to study the relationship between the ligand-binding domains of PPARγand RXRαwith their respective DNA-bind-ing domains. Our results reveal that phosphorylation alters collective motions within the PPARγ-RXRαcomplex that affect the LBD-LBD dimerization interface and the AF-2 coacti-vator binding region of PPARγ.
Introduction
PPARγis a transcription factor within the nuclear hormone receptor family that forms a het-erodimeric complex with RXRαto bind coactivator proteins that recruit additional transcrip-tion factors to PPRE sequences, which are generally located in enhancer regions far upstream from the target genes [1,2]. PPARγhas a structure that is typical of nuclear hormone receptors, containing an N-terminal A/B domain of unknown structure followed by two principallyα -helical domains, a 12-helix ligand-binding domain (LBD) and a zinc-finger DNA-binding do-main (DBD). There are two isoforms of PPARγ(PPARγ1 and PPARγ2), with PPARγ2 contain-ing an N-terminal extension of 28 amino acids. The two isoforms are otherwise identical throughout the LBD and DBD. The N-terminal A/B domain contains a weakly conserved tran-scriptional activation region known as activation function-1 (AF-1) [3]. The LBD of PPARγ serves not only to bind endogenous ligands, but also to dimerize with RXRαand bind OPEN ACCESS
Citation:Lemkul JA, Lewis SN, Bassaganya-Riera J, Bevan DR (2015) Phosphorylation of PPARγAffects the Collective Motions of the PPARγ-RXRα-DNA Complex. PLoS ONE 10(5): e0123984. doi:10.1371/ journal.pone.0123984
Academic Editor:Vladimir N. Uversky, University of South Florida College of Medicine, UNITED STATES
Received:December 23, 2014
Accepted:February 24, 2015
Published:May 8, 2015
Copyright:© 2015 Lemkul et al. This is an open access article distributed under the terms of the
Creative Commons Attribution License, which permits unrestricted use, distribution, and reproduction in any medium, provided the original author and source are credited.
Data Availability Statement:All relevant data are within the paper and its Supporting Information files.
Funding:The work was supported by the following: Virginia Tech College of Agriculture and Life Sciences Biodesign and Bioprocessing Research Center; and National Science Foundation Grant CNS-0960081. The funders had no role in study design, data collection and analysis, decision to publish, or preparation of the manuscript.
coactivator proteins in the AF-2 region. A recent structural study by Chandra et al. on PPARγ1 showed that the PPARγLBD is intimately linked with both the RXRαLBD and DBD [4].
PPARγis the“master regulator”of adipocyte differentiation and functions in many cellular pathways, including regulating lipid storage, cell proliferation, and inflammatory processes that are involved in immunity [5]. PPARγis also a target for marketed antidiabetic drugs, as agonists binding to the LBD increase insulin sensitization [1,6]. A classic example of a drug that acts as a full agonist of PPARγis rosiglitazone, a member of the thiazolidinedione (TZD) class of antidiabetic drugs. In 2010, the FDA placed restrictions on prescribing and dispensing rosiglitazone-based drugs due to concerns about increased cardiovascular disease in patients taking the drugs. Further analysis of the data led the FDA to remove those restrictions in 2014. The uncertainty of long-term effects on patient health suggests a continuing need for addition-al, novel drugs that target PPARγ, and a rational and informed approach to identifying drugs requires an understanding of molecular mechanisms of receptor activation.
At the molecular level, full agonists tend to bind to the PPARγLBD in a polar region of the ligand-binding site, stabilizing helix H12 and the AF-2 region [7,8]. In contrast, partial agonists bind in the binding site entrance channel and an alternate site that stabilizes H3 [9,10]. These differences in binding orientation have stimulated a search for partial agonists with therapeutic potential, the rationale being that the somewhat weaker agonistic activity may also lead to fewer undesirable side effects [7,11] and that many synthetic compounds believed to be full ag-onists are truly partial agag-onists, in that they can elicit differences in gene expression patterns to address specific disease conditions [12]. Similarly, concerns that ligands designed to target PPARγcould also agonize or antagonize the PPARαand PPARβ/δsubtypes has led to efforts to identify subtype-selective agonists. A distinctly different approach to developing therapeu-tics that target PPARγis to modulate post-translational modification, as discussed below.
Transcriptional activity of nuclear receptors can be regulated by post-translational modifi-cations such as phosphorylation [13]. Phosphorylation of Ser112 in PPARγ2 in the N-terminal A/B domain inhibits ligand binding [14], despite the large spatial separation between Ser112 and the LBD. This finding implicates long-range collective dynamics and interdomain interac-tions in the function and regulation of PPARγtranscriptional activity. More recently, Choi et al. demonstrated that PPARγ2 can be phosphorylated by Cdk5 on Ser273 (Ser245 in the PPARγ1) in the LBD [15], dysregulating the expression of metabolic regulation genes, includ-ing adipsin and adiponectin [15]. However, not all PPARγ-regulated genes are affected, and PPARγchromatin occupancy was unaffected, indicating that the effects of phosphorylation of Ser273 may result from altered coactivator binding rather than impeding DNA binding. Choi et al. further demonstrated that PPARγligands were capable of inhibiting phosphorylation [15], but that agonism was not a prerequisite for this effect [16]. Based on the structural work of Chandra et al. [4], it is clear that Ser273/245 makes close contact with the RXRαDBD, thus implicating protein-protein interactions and resulting dynamics as a target for regulation by phosphorylation and ultimately the ability of coactivator proteins to bind to the AF-2 region.
In the present study, we applied molecular dynamics (MD) simulations to examine interac-tions among the components of the PPARγ1-RXRα-DNA complex. We undertook the present work for several reasons: to understand (i) how phosphorylation affects functional dynamics of the RXRα-PPARγ1 complex, (ii) the means by which partial agonists stabilize the complex, and (iii) how the interplay between ligand binding and phosphorylation impacts the dynamics of the RXRα-PPARγcomplex. We hypothesized that phosphorylation within the LBD would alter the conformational ensemble of PPARγ, and that the dynamics would be further modulat-ed by coactivators and bound ligands. Ultimately, these macromolecular interactions are likely to have implications for coactivator recruitment and interactions, thus contributing to infor-mation about expression of PPARγ-modulated genes and the larger role of allostery in the ac-tivity of nuclear hormone receptors. The present study focuses on the ternary PPARγ1-RXRα -DNA complex, using a crystallographic model solved by Chandra et al. [4]. For this reason, all residue numbers in this paper are given as they appear in PPARγ1, with Ser273 in PPARγ2 being equivalent to Ser245 here. By utilizing long MD simulations, we sought to provide the most complete picture to date of functional PPARγdynamics with atomistic resolution.
Results
Given the model described above, we based our simulations on the crystal structure of the PPARγ-RXRα-DNA complex solved by Chandra et al. [4]. All complexes in our simulations contained PPARγ, RXRα, and DNA, with differences among the complexes consisting of phos-phorylation state of Ser245 and presence or absence of ligands or coactivator peptides (see Methods,Table 1andFig 1). These different complexes allowed for an extensive analysis of the collective motions of the PPARγ-RXRαcomplex, especially those at the protein-protein inter-faces, to assess any alterations to the dynamics of the complex, thus affecting interactions of PPARγwith DNA and coactivator peptides. Including the partial agonist (BVT.13) in the com-plex in some simulations was done in an effort to understand the mechanism underlying recov-ery of transcriptional activity in p-PPARγthat was observed by Choi et al. [15].
Collective Motions Within the PPARγ-RXRα
Complex
To analyze the low frequency motions of the PPARγ-RXRαcomplex, we performed principal components analysis (PCA) as described in the Methods. In all of the complexes, the most prominent collective motions within PPARγinvolved the H2’-H3 loop and the hinge that con-nects the DBD and LBD. Subtle differences in the directions of these motions had implications for the dynamics of the AF-2 region of PPARγand the dimerization interface between RXRα and PPARγ.
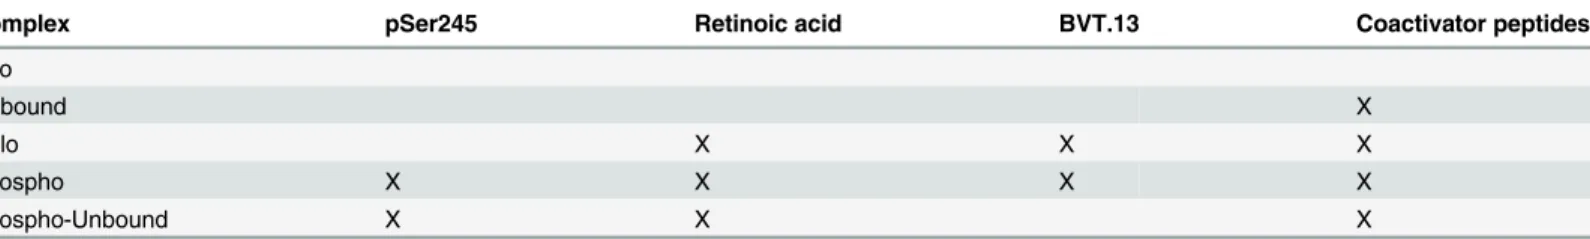
In the holo complex, the core of the PPARγLBD remained very rigid (Fig 2). The positions of helices H1, H3, and H11 remained largely invariant over time while flexibility was exhibited Table 1. Summary of the contents of each complex.
Complex pSer245 Retinoic acid BVT.13 Coactivator peptides
Apo
Unbound X
Holo X X X
Phospho X X X X
Phospho-Unbound X X X
All complexes contained PPARγ, RXRα, and DNA, with“X”indicating the presence of other components.
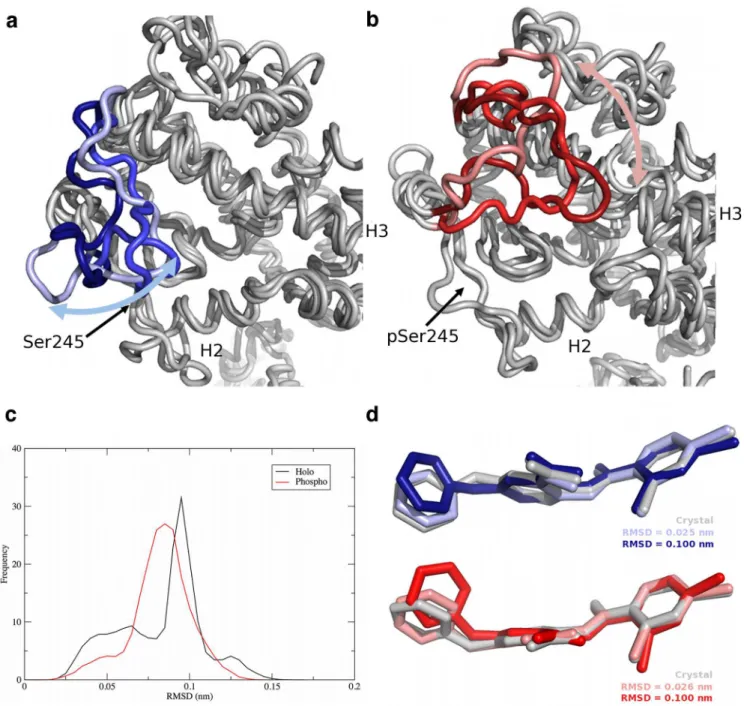
in the H2’-H3 loop, the DBD-LBD hinge region, and H12. The H2’-H3 loop moved like a flap, opening and closing over the ligand binding site in the LBD (Fig 3A). In contrast, in the phos-pho complex, the H2’-H3 loop exhibited a sliding motion, remaining tightly associated with the surface of PPARγand moving to interact primarily with H3 and the H11-H12 loop (Fig 3B). This sliding motion resulted in increased motion along H1, H3, H11, and H12 relative to the holo complex (Fig 2). The displacement of H12 from its starting position agrees with crys-tallographic evidence that suggests partial agonism is exerted through H3 and is independent of H12 [8,18]. Helices H3, H11, and H12 form the AF-2 region. Thus increased motion within H3 and H11, as was observed in the case of the phospho complex, can also be postulated to in-fluence coactivator binding. In addition, the H2’-H3 loop interacts with the bound BVT.13 par-tial agonist in these complexes. In the simulations of the holo complex, BVT.13 adopted two principal conformations, differing in the orientation of the 2-pyrimidinyloxy ring (Fig 3C and 3D). In the holo complex, the interconversion of this ring between the two states occurred on the nanosecond time scale, with the“flipped”orientation (higher heavy-atom RMSD, ~0.10 nm) being sampled approximately 64% of the time. In the phospho complex, BVT.13 was largely locked in an intermediate state at ~0.07 nm and did not interconvert between high and low RMSD states. Given that BVT.13 interacts with the H2’-H3 loop, these differences in conformational sampling can partially explain the differences in loop dynamics.
To analyze the functional implications of phosphorylation, coactivator peptides, and partial agonist BVT.13, we carried out additional simulations of RXRα-PPARγcomplexes. The un-bound complex, containing the LXXLL coactivator peptide but lacking BVT.13 (Fig 1), be-haved much like the phospho complex in terms of the overall motions, with H3 and H11 manifesting increased fluctuation relative to the holo complex. This outcome implies that both phosphorylation and removal of the partial agonist from the ligand-binding site propagate mo-tion along H1, H3, and H11 to destabilize the core of the LBD and the AF-2 region. The phos-pho-unbound complex showed greater motion throughout H1, H3, and H11 than either the phospho or unbound complexes (Fig 2), indicating that the effects of ligand removal and phos-phorylation are additive. The apo complex showed the largest degree of motion throughout the Fig 1. Components of the PPARγ-RXRα-DNA ternary complex.Protein structural domains (DBD, DNA-binding domain and LBD, ligand-binding domain) are indicated. Yellow spheres in the two DBD are Zn2+ions. DNA is shown as a cartoon.
entire LBD (Fig 2), with nearly every helix showing greater flexibility than in any of the other complexes. This outcome is expected, since neither BVT.13 nor the coactivator peptide was bound in the apo complex, thus removing their stabilizing influences. Notably, H3 developed prominent kinks in its structure in the apo structure (S1 Fig), an outcome that would likely dis-favor coactivator binding. The presence of BVT.13 in the holo complex stabilized H3, as ex-pected for a partial agonist [8].
In the crystal structure of the ternary complex, Ser245 is in close proximity to Lys145 and Lys201 of the RXRαDBD (S2 Fig). The PPARγLBD-RXRαDBD interface is also defined by a cluster of hydrophobic residues that may strengthen ionic interactions between pSer245 and these lysine residues. Thus, phosphorylation of Ser245 rigidified the H2-H2’and H2’-H3 loops, as quantified by backbone root-mean-square fluctuation (RMSF,S3 Fig), causing pSer245 to act as a pivot point within the LBD. Motions within the H2’-H3 loop in the phospho complex were propagated along H1 and H3, displacing them from their crystallographic positions. In the holo complex, the motion of Ser245 was dissipated by H2 and was not as strongly transmit-ted through H1 and H3 as in the phospho complex, reinforcing the integrity of the LBD and AF-2 region. The implications of this phenomenon on the dynamics of the PPARγDBD and hinge region will be discussed below.
Chandra et al. identified Phe347 in the PPARγLBD as a critical residue responsible for in-teractions with the RXRαDBD that affect DNA binding [4]. In all of our simulations, Phe347 remained tightly associated with the RXRαDBD, thus none of the manipulations performed here negatively impacted the stability of the PPARγLBD-RXRαDBD interface with respect to Phe347.
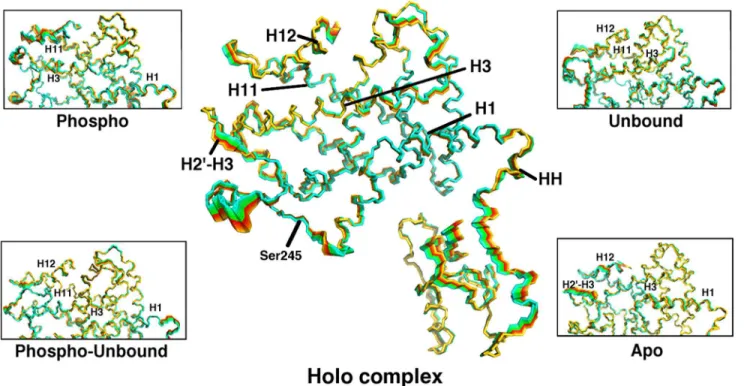
Fig 2. Interpolation of PPARγstructures along the sum of the first 7 eigenvectors from PCA for the holo complex, with insets for each of the other
complexes studied here, focusing on the LBD.Cyan indicates completely overlapping regions and thus little or no motion. Red and yellow areas represent those that are more mobile. Critical secondary structure elements are labeled on the holo complex and those features manifesting the greatest movement in each non-holo complex are indicated in the insets.
Dynamics of the PPARγ
Hinge Region and DBD
In the holo and phospho complexes, the differences in motion manifested in the H2’-H3 loop described above were transmitted across the PPARγLBD and into the hinge region that con-nects the DBD and LBD. The hinge interconverted between random coil and helical structures throughout all the simulations. In response to hinge motion, the DBD moved as a rigid body, Fig 3. Movement of the H2’-H3 loop and the BVT.13 ligand in PPARγcomplexes.Positions of the loop in snapshots from the (a) holo complex and (b)
phospho complex (red) simulations, (c) heavy-atom RMSD distributions of the BVT.13 ligand in both the holo and phospho complexes, from data pooled over all frames in all trajectories, and (d) representative conformations of the BVT.13 partial agonist in holo (blue) and phospho (red) complexes. In panels (a) and (b), one structure was taken from each of the three replicate simulations to indicate the three different states (indicated by different shades of red and blue). Helices H2 and H3 are labeled, as is the position of Ser245/pSer245. The“crystal”positions of the ligands in panel (d) are from the energy-minimized, equilibrated structures, with hydrogen atoms removed for clarity.
twisting with respect to the LBD (Fig 2), a phenomenon that was common to all the complexes studied here. The dynamic nature of the hinge region manifested several differences in terms of distance between the hinge and H1, contacts formed between these two regions, and the overall amount of helicity formed in the hinge.
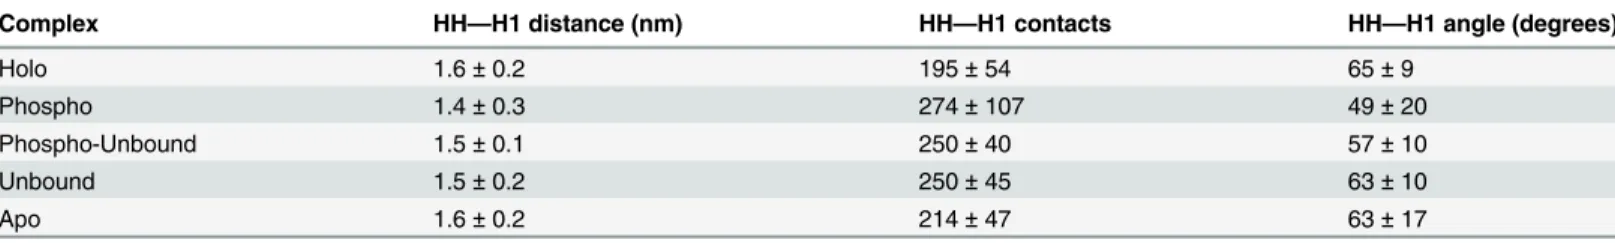
One of the most interesting phenomena that occurred over the course of these simulations was the packing of H1 against residues 194–206 in the hinge region, which frequently formed anα-helix and thus will be referred to here as the“hinge helix”(HH). In the holo complex, the center-of-mass (COM) distance between HH and H1 was 1.6 ± 0.1 nm over the final 400 ns of simulation time, while the same distance in the phospho complex was reduced to 1.4 ± 0.3 nm. By analyzing heavy atom contacts between HH and H1, it can be seen that the hinge packed against the LBD more tightly in the phospho complex than in the holo complex (Table 2) and had reduced flexibility, as measured by RMSF (S3 Fig). By measuring the angle between the principal axes of HH and H1, the interaction between these two helices in the various com-plexes was further quantified. The phospho complex adopted the narrowest angle between HH and H1 (Table 2). The remaining complexes (apo, unbound, phospho-unbound) adopted in-termediate conformations in terms of HH-H1 distances, contacts, and angle between the prin-cipal axes. Although these differences are not statistically different, it is notable that the greater flexibility of the LBD of these complexes was propagated throughout the hinge region such that the conformations populated throughout the trajectories were intermediates between holo and phospho forms in terms of HH-H1 interactions using various measures.
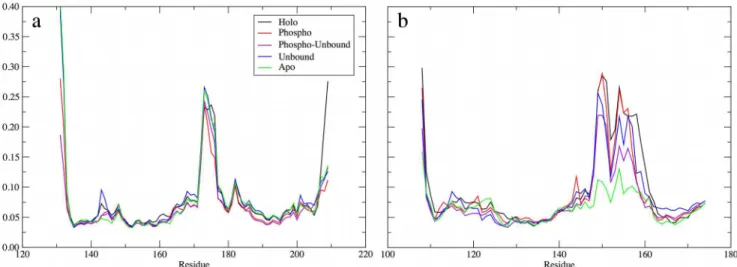
The dynamics of the hinge region and the phosphorylation state also had implications for the dynamics of the PPARγDBD. While it is intuitive to expect that the interactions of pSer245 of the PPARγLBD with the RXRαDBD (S2 Fig) will affect the dynamics of the RXRα DBD, it is not necessarily straightforward to assume that phosphorylation will have any effect on the dynamics of the more distant PPARγDBD, but our results indicate that such long-range effects exist. We measured the backbone RMSF of the residues in the DBD for both RXRαand PPARγ(Fig 4). Interestingly, phosphorylation of Ser245 had little impact on the dy-namics of the RXRαDBD (Fig 4A). While the RMSF of most of the residues in the RXRαDBD was slightly reduced upon phosphorylation of Ser245, the only notable decrease in RMSF oc-curred in residues 174–179, which reside in a solvent-exposed loop that is not involved in DNA binding and is not near pSer245. Thus, despite its proximity, pSer245 led to no major local perturbations in the dynamics of the RXRαDBD.
Conversely, the PPARγDBD was perturbed by phosphorylation and/or removal of BVT.13 and coactivator peptides (Fig 4B). While the DBD in the unbound and phospho complexes was only slightly more rigid overall, the phospho-unbound complex DBD was rigidified in a man-ner that reflects the combined effects of these two modifications. The DBD of the apo complex was dramatically rigidified, to an even greater extent than that of the phospho-unbound com-plex. Thus, the effect of removing BVT.13 and phosphorylating Ser245 is additive in terms of Table 2. Structural properties of PPARγ*.
Complex HH—H1 distance (nm) HH—H1 contacts HH—H1 angle (degrees)
Holo 1.6±0.2 195±54 65±9
Phospho 1.4±0.3 274±107 49±20
Phospho-Unbound 1.5±0.1 250±40 57±10
Unbound 1.5±0.2 250±45 63±10
Apo 1.6±0.2 214±47 63±17
*Data were averaged over thefinal 400 ns of three replicate simulations in each set. Values shown are averages and corresponding standard deviations.
rigidifying the PPARγDBD, which may have implications for DNA sequence recognition or binding. Given the changes in structure and dynamics of the LBD in both of these complexes, it is likely that increased fluctuations of the LBD and AF-2 site are compensated by increased rigidity of the DBD. Additionally, in the apo complex, the kinking of helix H3 and concomitant reorientation of the PPARγDBD relative to the LBD (S1 Fig), perturbed the DBD dynamics such that it packed differently within the complex and became more rigid. pSer245 in the phos-pho complex led to reduced RMSF in residues 151–153 and 157–160. Asn160 interacts directly with the PPRE sequence, in the minor groove of the bound DNA [4]. All of these observations suggest that long-range motions, communicated from the RXRαDBD-PPARγLBD interface (the location of phosphorylation), through the PPARγLBD (including the ligand-binding site and helix H3), affect the dynamics of the RXRαLBD-PPARγDBD interface and the PPARγ DBD itself. While the implications for DNA binding and stability remain to be fully under-stood, the fact that small, distant changes give rise to this phenomenon suggests a large degree of cooperativity within the PPARγ-RXRα-DNA complex.
Dynamics of the LBD-LBD Interface
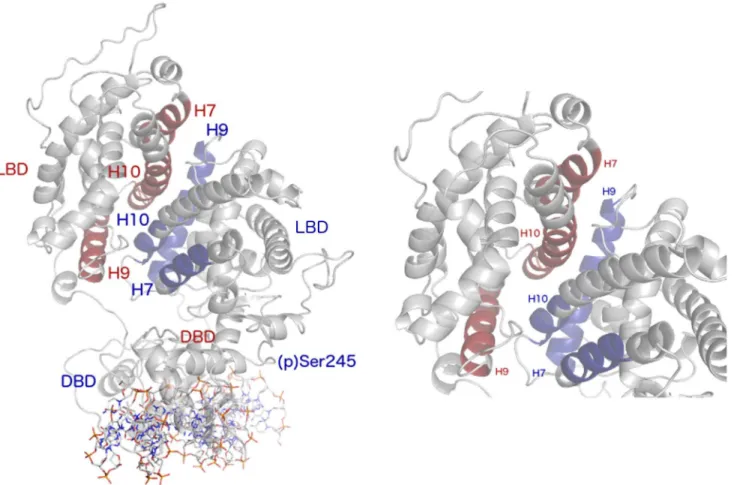
There are three main interfaces for protein-protein interactions within the PPARγ-RXRα com-plex; the LBD-LBD, the PPARγLBD-RXRαDBD, and the RXRαLBD-PPARγDBD. Given the large surface area of the LBD-LBD interface, encompassing helices H7, H9, and H10 of each protein (Fig 5) [4], it is reasonable to expect that LBD-LBD dynamics contribute to communi-cation across the ternary complex, especially given the observations regarding the PPARγDBD described above. To characterize the dynamics of the LBD-LBD interface, we monitored the number of heavy atom (non-hydrogen) contacts maintained over time and performed PCA on the interfacial helices.
The holo complex maintained the fewest heavy atom contacts (407 ± 58) over the final 400 ns of simulation time. The data set produced a narrow distribution (S4 Fig), indicating ho-mogeneity in the sampling. Contacts were increased in the remaining complexes, with
442 ± 63 contacts persisting in the phospho complex, and the apo and unbound complexes maintaining the largest number of contacts, with 451 ± 92 and 452 ± 60, respectively. In the phospho-unbound complex, 424 ± 62 contacts persisted. We also note that the apo complex Fig 4. Backbone RMSF of (a) RXRαand (b) PPARγDBD residues.RMSF was measured from a trajectory pooled from the final 400 ns of each replicate simulation, for a total of 1.2μs of sampling. A least-squares fit of backbone atoms in each DBD was performed prior to calculating the RMSF.
produced a bimodal distribution, with a considerable population centered at approximately 600 contacts, indicating a very tight interaction. While the differences in numbers of contacts are not significantly different, the results lead us to propose that proper function of the RXRα -PPARγcomplex requires plasticity at the LBD-LBD interface, and that phosphorylation of Ser245 or the absence of BVT.13 and/or coactivators modulates these dynamics by altering this plasticity.
We further characterized the dynamics of the LBD-LBD interface by conducting PCA (see Methods). First, the different motions of each complex were characterized, as differences emerged based on phosphorylation state and presence or absence of ligands and coactivator peptides. Next, the conformational overlap of the non-holo (phospho, apo, unbound, and phospho-unbound) complexes with the holo complex was assessed by projecting non-holo conformations onto the eigenvectors derived from the holo complex simulations.
If the LBD-LBD interface is visualized as a plane between the two protein subunits, the mo-tion along the first eigenvector in the holo complex was scissoring between the two LBDs, out of the plane of this interface (S5 Fig). The H10 helices of each protein formed a rigid pivot point. While H7 and the N-terminal end of H9 in PPARγapproached the C-terminal end of H9 in RXRα, the same helices in RXRαmoved in opposition. The net effect was an opening at one end of the interface, concomitant with a closing at the other end. A kink developed in RXRαH9 as part of its progression across this eigenvector. The scissoring motion was coupled Fig 5. The PPARγ-RXRαLBD-LBD interface.Labels in blue correspond to structural features of PPARγ, while those in red correspond to RXRα. At left is the full complex, including the PPRE DNA sequence. At right is a zoomed-in view of the LBD-LBD interface.
with a slight twisting motion between the two domains (the second eigenvector) in the plane of the dimerization interface such RXRαand PPARγrotated in opposite directions over time.
The interfacial dynamics of the non-holo complexes (S6–S9Figs) showed subtle differences from the holo complex. In the phospho complex (S6 Fig), the magnitude of the scissor motion was much larger than in the case of the holo complex. Whereas the C-terminal residues of RXRαH9 adopted a kinked structure in the holo complex, the N-terminal residues of p-PPARγH9 kinked, instead, likely due to a rigidifying effect of the ionic interactions between the p-PPARγLBD and the RXRαDBD due to pSer245 (S2 Fig). The primary mode of
LBD-LBD motion in the apo complex was twisting around H10, concomitant with in-plane ro-tation. The second eigenvector represented a sliding motion between the two LBD. Both the unbound and phospho-unbound complexes (S8andS9Figs, respectively) exhibited twisting between the two LBD as the principal mode of motion. In the unbound complex, a kink formed in RXRαH7. In the phospho-unbound complex, the N-terminal residues of PPARγH9 and RXRαH7 underwent scissor-like motion like the phospho complexes (S9 Fig). Thus, the phos-pho-unbound complex resembled both the phospho and unbound complexes.
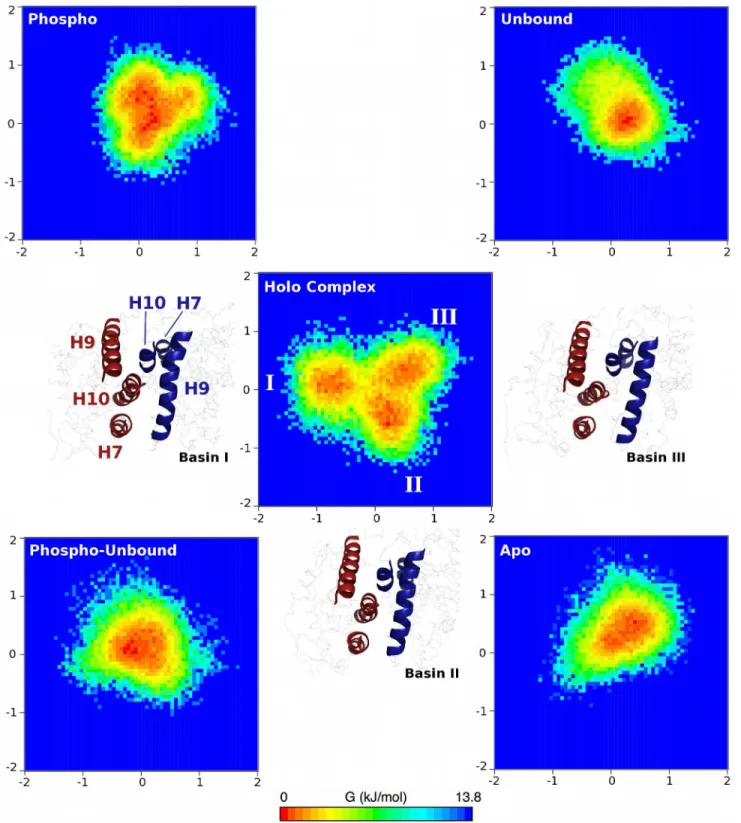
The findings from the interfacial PCA lead us to propose that the coupling of scissor-like and twisting motions of the holo complex is indicative of transcriptional activity. That is, the communication from one side of the complex (the RXRαDBD) to the other (the PPARγDBD) is mediated by the dynamics of the LBD-LBD interface, which may also be influenced by the presence of bound ligands and coactivators. The non-holo complexes exhibited altered dynam-ics that correspond to non-functional modes. The phospho complex behaved similarly to the holo complex, though the magnitude of these functional motions was diminished, indicating that binding of a partial agonist such as BVT.13 partially recovers functional dynamics, in agreement with experimental findings [15]. For a more quantitative comparison between these complexes and to visualize the phase space differences between the complexes, the conforma-tions of all of the non-holo complexes were projected onto the eigenvectors of the holo com-plex, with the probabilities of (λ1,λ2) combinations used to produce free energy surfaces (Fig 6, see equation inMethods).
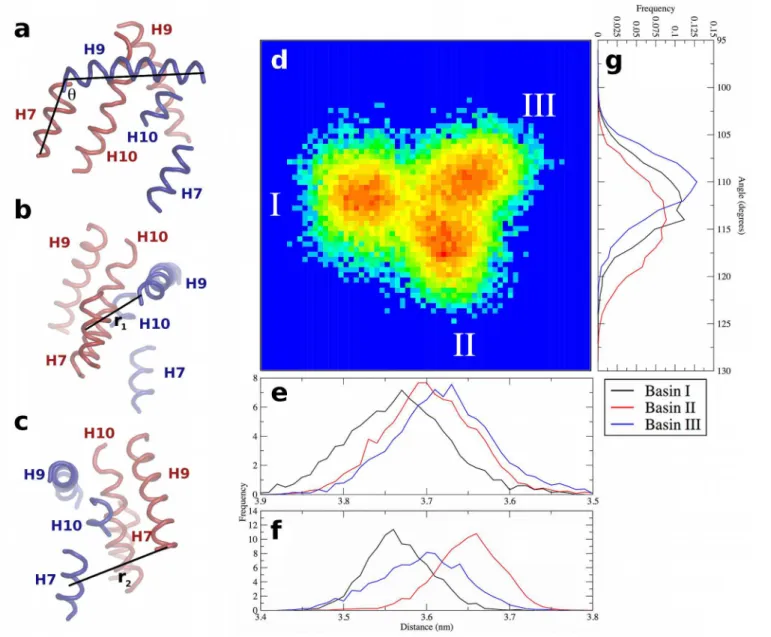
There are three minima in the free energy surfaces for the holo complex simulations, labeled Basins I, II, and III (Fig 6). Visualization of the trajectories indicates that the holo complex cy-cles through Basins II, I, and III before returning to Basin II. The basins are separated by barri-ers of no larger than 3.5 kJ mol-1, thus they can be readily crossed at physiological temperature. The changes in tertiary structure that comprise the configurations in these basins can be quan-tified in terms of a twisting angle (θ) and two distances (r1and r2) as shown inFig 7. The twist-ing angle is that formed by a vector drawn through H9 of PPARγfrom N- to C-terminal ends, and from the C-terminal end of PPARγH9 to the C-terminal end of RXRαH7 (Fig 7A). The two distances measure the extent to which either end of the interface is“open”or“closed,” with r1being the distance from the COM of Asn424 in PPARγto the COM of RXRαH7 (Fig 7B) and r2being the distance from the COM of the Lys407 in RXRαto the COM of PPARγH7 (Fig 7C). By measuring each of these quantities in the three basins (Fig 7E, 7F and 7G), it is possible to illustrate how the structural changes are mapped onto the free energy surface from PCA (Fig 7D, identical to the central image inFig 6). Though there is considerable overlap in these quantities, particularly distances r1and r2, the combined effects of simultaneous twisting and scissoring can characterize the configurations in each basin.
Basin I is characterized by an intermediate value ofθ(112 ± 4°) and r1at its minimum (3.57 ± 0.04 nm) and r2at its maximum (3.73 ± 0.06 nm). Thus, in Basin I, the effects of scis-soring motions are at their maximum, and the RXRαH9—PPARγH7 end of the interface is
Fig 6. Free energy surfaces of interfacial dynamics of all complexes studied here.Three free energy minima are identified in the holo complex simulations, and are labeled by Roman numerals. Images corresponding to representative holo complex conformations of each basin are shown, with the conformations being positioned most closely to the respective basins to which they correspond. Interfacial PPARγand RXRαhelices are in blue and red, respectively, and are labeled in the image nearest to Basin I. Positions along eigenvector 1 (x-axis) and eigenvector 2 (y-axis) are shown in nm for each free energy surface.
r1increases to 3.65 ± 0.04 nm. Thus an increase in rotation between the two subunits in struc-tures taken from Basin I to Basin II begins to open the previously“closed”end of the interface. In Basin III,θis at its minimum (110 ± 3θ), indicating the least twisted of the three basins. In Basin III, r1is at an intermediate value of 3.60 ± 0.05 nm, while r2is nearly unchanged (3.68 ± 0.06 nm) relative to Basin II. As a result, the transition between Basin II and Basin III can be described as a relaxation in the twist angle with a slight closing along r1. Further closing along r1and a slight increase in twist yields configurations populating Basin I. Thus, the transi-tions between any two basins can be described by 2–4° of twist between the LBD and opening or closing along one of the two characteristic distances at either end of the interface.
Fig 7. Characterization of PPARγ-RXRαtertiary structure dynamics at the LBD-LBD interface of the holo complex.(a) The twist angleθbetween the two subunits, and distances (b) r1and (c) r2. In panels (a—c), structural elements of PPARγand RXRαare in blue and red, respectively, and are labeled in each panel to indicate the relative orientation. Panel (d) is the free energy surface from PCA, enlarged fromFig 6, with basins labeled. Panels (e) and (f) show the distributions of r2and r1, respectively, in all three basins. Panel (g) shows the distributions ofθin all three basins. Note the x-axes in panels (e) and (f) are reversed to more clearly correspond to the properties of the basins, as described in the text. The legend in the bottom-right referring to the basins is applicable to panels (e—g).
The other complexes populated conformations that reflected only portions of the holo com-plex free energy surface. The phospho comcom-plex (Fig 6, top left) populates Basins II and III, but does not populate Basin I and heavily samples conformations in excess of +1.0 nm along eigen-vector 2 (twisting motion), a region not sampled at all in the holo complex. The phospho-un-bound complex (Fig 6, bottom left) samples conformations that do not belong discretely to any of the identified Basins, instead remaining trapped in the middle of the free energy surface. Thus, the binding of BVT.13 allows the phospho complex to sample some holo-like conforma-tions that are absent even when the coactivator peptides are bound. The apo complex (Fig 6, bottom right) only sparsely populates Basins I and III, and its free energy minimum is located between those two basins and towards the positive extreme of eigenvector 2, similar to the sam-pling of the phospho complex. If the apo form of the complex is considered to be an inactive complex, this finding indicates that the phospho complex populates inactive conformations, accounting for its reduced activity compared to the holo complex. Finally, the unbound com-plex (Fig 6, top right) shows narrow sampling along the holo complex eigenvectors, sampling conformations between Basins II and III, but belonging strongly to neither. The unbound com-plex also sampled apo-like conformations along eigenvector 2. Given that all of the non-holo complexes sampled large eigenvalues in the positive direction along eigenvector 2, we conclude that the presence of the BVT.13 partial agonist and the absence of phosphorylation on Ser245 limit the twisting motion at the LBD-LBD interface. The PCA results can be further interpreted in light of the interfacial contacts described above. The holo complex maintained the fewest in-terfacial contacts over time, allowing conformational freedom to sample all three Basins. The apo complex sampled conformations with dramatically increased contacts, consistent with a more rigid interface that does not populate functional states. The other complexes had inter-mediate plasticity, reflected in their occupancy of relatively narrow regions of the holo complex free energy surface (Fig 6).
Dynamics of the PPARγ
AF-2 Site
The structure and dynamics of the PPARγAF-2 region have implications for the ability of PPARγto bind coactivator proteins that dictate its transcriptional activity. Unlike the holo complex, the phospho complex showed displacements propagated along H1, H3, the H11-H12 loop, and H12, leading to greater mobility within the AF-2 region (Fig 2). As shown inFig 3, phosphorylation caused the H2’-H3 loop to behave differently than in the holo complex such that it moved to interact with the H11-H12 loop significantly more extensively (175 ± 52 heavy atom contacts over the final 400 ns compared to 36 ± 7 in the case of the holo complex). These interactions propagated forces to H12 in the AF-2 region, leading to destabilization. Thus, though the coactivator peptide remained bound during the simulations conducted here, the AF-2 region was more dynamic due to pSer245.
Discussion
In the present work, we have carried out extensive simulations of ternary RXRα-PPARγ1-DNA complexes, examining the influence of phosphorylation, ligands, and coactivators on collective motions. We have collected 1.5μs of sampling for each complex, representing the most com-plete assessment of PPARγdynamics using MD simulations to date. The experimental finding that pSer112 can shift the conformational ensemble of ligand-free PPARγLBD [14] motivated the present work. Since the structure of the A/B domain has not been determined, we focused on phosphorylation within the PPARγLBD. Since phosphorylation in a domain spatially dis-tant from the LBD influences the dynamics of the LBD and ligand binding, we set out to deter-mine if phosphorylation within the LBD would also impact functional dynamics.
It is important to recognize that some disagreement exists regarding the structure of the PPARγ-RXRα-DNA structure in solution. While the current work makes use of the only atom-ic-resolution structure that is available, work on the same structure in solution suggests that the complex adopts a more elongated conformation [22–24]. In solution, scattering data indi-cate that the PPARγΔNTD-RXRαΔNTD-DR1 complex (with N-terminal A/B domains deleted from each protein, the same complex examined here) adopts conformations with radius of gy-ration (Rg) values of approximately 37–39 Å [22,23]. In our simulations of the holo complex, the average Rgvalue was 30.2 ± 0.3 Å. Thus, it is clear that there are small differences between these structures, with the crystal structure giving rise to slightly more compact conformations than experimental measurements in solution. Given that detailed atomic-resolution structures from solution experiments are unavailable, the crystal structure utilized in this work is the most appropriate for approaching the problems at hand, though it is important to note the ca-veat that dynamics in solution may, in fact, be somewhat different. Additional experimental and theoretical work will be needed to further investigate these issues.
It also has been suggested that the use of static structures to assess dynamic systems and re-lationships can prove problematic in elucidating the details of the PPARγ-small molecule bind-ing process [25]. The use of MD simulations is useful in these cases because it sheds light on theories regarding events that occur on time and length scales that are inaccessible to most ex-perimental methods. We do not attempt to resolve the differences seen between static (crystal) structures, which can be influenced heavily by the conditions of the crystallization and data col-lection process. Instead, we aim to provide detailed insights into the larger puzzle that may help drive experimental efforts to resolve outstanding questions.
Another consideration in conducting this work is the relevance of the BVT.13-bound p-PPARγcomplex. We recognize that BVT.13 and related compounds (e.g., MRL24) inhibit Cdk5-mediated phosphorylation of PPARγ, though as noted by Choi et al. [15], it is likely that binding of these ligands results in a mixed population of phosphorylated and non-phosphory-lated forms. In addition, in a group of patients treated with rosiglitazone, which also inhibits phosphorylation of Ser245, most, but not all, had a decreased level of phosphorylation [15]. These observations suggest that multiple populations, which vary in terms of bound ligand and phosphorylation, will exist. Thus, the systems studied here, including the phosphorylated, li-gand-bound form of PPARγ, are relevant and are appropriate for comparison.
propensities to reorient within the PPARγbinding site or bind in different conformations. The issue of multiple possible binding modes versus active dynamic motion repositioning the li-gand after the initial binding event was not resolved in their work [25]. Our simulations suggest BVT.13 can bind in one conformation but does not remain locked in this conformation. Such switching could alter the conformational sampling of PPARγor potentially change the recruit-ment activity from one coactivator to another as a way to drive multiple gene regulation events. The change in binding mode also appears to be affected by phosphorylation, which would indi-cate this posttranslational modification plays a significant role in the specificity of the gene regulation process.
Our results further suggest that phosphorylation of Ser245 (Ser273 in PPARγ2) has far-reaching implications for the dynamics of PPARγand the complex as a whole. The pSer245 residue interacted very tightly with Lys145 of the RXRαDBD, quenching the motions of neigh-boring residues while leading to greater fluctuations in the positions of nearby helices H1 and H3. The result is that the LBD of the phospho complex, including the AF-2 region, is more dy-namic than in the case of the holo complex. Additionally, phosphorylation affected the PPARγ-RXRαLBD-LBD interface, rigidifying it and perturbing the twisting and scissoring motions that were revealed by PCA in the case of the holo complex. Our data suggest that in the holo PPARγcomplex, the LBD-LBD interface cycles between three conformational states, unlike the other complexes examined here, which occupy narrower regions of the holo com-plex free energy surface, or different regions altogether (Fig 6). The phosphorylated complex sampled a narrower conformational ensemble, including some states similar to the inactive apo complex. These findings agree with a proposal of Bruning et al. [26] that the gradient of PPARγtransactivation by ligand binding is not solely dependent upon changes in the AF-2 re-gion. Instead, they proposed that allosteric or other long-range dynamics contribute to these ef-fects, also suggesting a possible role for RXRαconformational sampling in this process. Our results, the first to provide atomic-resolution insight into this process, suggest that indeed such long-range allostery is at play, and that the LBD-LBD interface is dramatically impacted by phosphorylation and/or ligand binding.
We observed that phosphorylation of Ser245 had long-range effects on the dynamics of the PPARγhinge region and DBD. Rather than affect local interactions with the RXRαDBD, pSer245 exerted its effects across the complex and rigidified the PPARγDBD, especially Asn160, which binds the PPRE. The RMSF of the apo complex DBD was dramatically reduced, which we interpret as an indicator of reduced activity, given that the apo structure should be the least active of all of those studied here. If this is the case, the fact that a key DNA-binding sequence in the PPARγDBD was rigidified may explain the experimental observation that p-PPARγmodulates the expression of different genes than does the holo complex [15], that is, there may be some fundamental differences in the dynamics of protein-DNA interactions that alter gene expression. Previous work on the vitamin D receptor-RXRα-DNA [27] and gluco-corticoid receptor-DNA [28] complexes suggests that DNA binding impacts the conformation-al dynamics of the respective LBD. Thus, the function of nuclear hormone receptors appears to be dependent upon long-range communication between multiple protein domains and interac-tions with DNA.
Similarly, MD simulations also found that ligand binding influences a complex network of col-lective motions within the PPARγLBD [30]. Our study is the first to demonstrate the role of inter-protein cooperative motions within the full PPARγ-RXRα-DNA complex. Finally, our re-sults suggest that partial agonists likely partially recover activity in phosphorylated PPARγby (i) stabilizing AF-2, specifically helices H3 and H11 that are otherwise perturbed by phosphor-ylation and (ii) promoting the occupancy of some holo-like states of the PPARγ-RXRα LBD-LBD interface. These results confirm the importance of inter-domain interactions and dynamics in the proper functioning of the RXRα-PPARγ-DNA ternary complex, as suggested by Chandra et al. [4].
Methods
The structure of the PPARγ-RXRα-DNA complex was taken from PDB entry 3DZU [4]. The structure contains PPARγisoform 1, RXRα, LXXLL coactivator peptides (fragments of the larger proteins foundin vivo) bound to both PPARγand RXRα, retinoic acid bound to RXRα, and partial agonist BVT.13 bound to PPARγ. The heterodimeric protein complex is bound to the PPAR response element (PPRE). Missing loops in the protein structures were reconstructed with the ModLoop server (http://modbase.compbio.ucsf.edu/modloop/) [31,32]. This ternary complex is referred to as the holo complex. The phospho complex was prepared by adding a phosphate group to Ser245 of PPARγ(corresponding to Ser273 in PPARγ2 in the work of Choi et al. [15,16]) in the xLeap module of AmberTools (www.ambermd.org). Removal of retinoic acid and partial agonist BVT.13, but retention of coactivator peptides, from the holo complex yielded the unbound complex. Removal of retinoic acid, BVT.13, and coactivator peptides from the holo complex yielded the apo complex. The BVT.13 ligand was removed from PPARγ in the phospho complex (while retinoic acid was retained in RXRα) to yield the phospho-un-bound complex. These complexes (summarized inTable 1) were constructed to elucidate the role of each component (phosphorylation, ligands, and coactivator peptides) in the underlying dynamics of the PPARγ-RXRα-DNA complex.
The protein and DNA components of each complex were assigned parameters from the AMBER99SB-ILDN force field [33], and ligand (retinoic acid and BVT.13) parameters were generated using GAFF [34]. Ligand topologies for use in GROMACS are provided inS1 Table. Each complex was centered in a rhombic dodecahedral simulation cell with a minimum box-solute distance of 1.0 nm. The unit cell was then filled with TIP3P water [35] and ~150 mM NaCl, in addition to Na+counterions sufficient to neutralize the net charge on each complex. All ionizable amino acids were assigned their dominant protonation state at pH 7.4 according to pKapredictions by the H++ server (http://biophysics.cs.vt.edu/H++) [36–38], except the cysteine residues that coordinate Zn2+ions in each DBD; these residues were treated as anionic, as predicted by quantum mechanical calculations [39].
Simulations were carried out with GROMACS [40,41], version 4.6. All bonds were con-strained using the P-LINCS algorithm [42], allowing an integration time step of 2 fs. The Verlet cutoff scheme [43] was used with a minimum cutoff of 1.0 nm for short-range Lennard-Jones interactions and the real-space contribution to the smooth Particle Mesh Ewald algorithm [44,45], which was used to compute long-range electrostatic interactions. Dispersion correction was applied to energy and pressure terms and periodic boundary conditions were applied in all three dimensions.
Parrinello-Rahman barostat [47,48] to maintain pressure at 1 bar. Production simulations were carried out under an NPT ensemble in the absence of any restraints. Three independent simulations of 500 ns in length were conducted for a total of 1.5μs of sampling for each complex. Conver-gence of each trajectory was assessed by monitoring backbone root-mean-square deviation (RMSD) of each protein over time (S10andS11Figs). Backbone RMSD values were generally stable after the first 100 ns of each simulation. Analysis was carried out using programs within the GROMACS package. For PCA, snapshots from the final 400 ns of each trajectory were pooled to create a single“trajectory”representing 1.2μs of sampling for each complex. Doing so guarantees that the eigenvectors identified and resulting free energy surfaces were represen-tative of all three replicate simulations. To further assess convergence, PCA was performed again over the final 250 ns of each trajectory. Given that the same motions were observed and the same regions of phase space sampled, the results from the final 400 ns were used for the most complete and statistically rigorous analysis possible. PCA was carried out on each protein, first by fitting to backbone atoms in the protein to remove global rotational and translational modes. For interfacial PCA, structures were first fitted to the backbone of the helices consid-ered in the analysis (H7, H9, and H10) before diagonalizing the covariance matrix. Free energy surfaces were constructed from the PCA eigenvector plots using a two-dimensional histogram approach, according to the equation
DGðl
1;l2Þ ¼ kBT½lnðl1;l2Þ lnPmax
in whichλ1andλ2are the eigenvalues of thefirst and second eigenvectors, and Pmaxis the (λ1,
λ2) combination that occurs with the greatest frequency, thus defining the energy minimum of the surface. These free energies are not absolute or conformational free energies, as no enthal-pic or entroenthal-pic terms have been calculated.
Supporting Information
S1 Fig. Comparison of representative H3 conformations from the holo and apo complexes. For clarity, only PPARγis shown in a cartoon representation. H3 is shown in blue to better il-lustrate its conformation.
(TIF)
S2 Fig. The local environment around pSer245.Shown in sticks are pSer245 of PPARγ(blue) as well as Lys145 and Lys201 of RXRα(gray). Hydrophobic residues of RXRαthat define the interaction interface between the PPARγLBD and the RXRαDBD are shown as gray spheres. The double-stranded DNA molecule is shown as a cartoon.
(TIF)
S3 Fig. Backbone root-mean-square fluctuation (RMSF) of PPARγfor holo and phospho
complexes after fitting to backbone atoms in PPARγ.RMSF values for residues flanking pSer245 in the phospho complex are notably reduced relative to Ser245 in the holo complex. The most prominent structural features are labeled. DBD = DNA-binding domain, and helices are denoted as HH (“hinge helix,”see main text), H1, H3, etc.
(TIF)
S4 Fig. Probability distributions of interfacial heavy atom contacts for all five complexes. (TIF)
are shown in blue (dark and light representing extremes along the eigenvector), while RXRα helices are shown in red (dark and light again representing extremes). Each helix is labeled, with blue and red indicating PPARγand RXRα, respectively. The left and right panels are dif-ferent views, rotated around the vertical axis between the PPARγand RXRαLBD. H7 of RXRα and H9 of PPARγ“open”while H9 of RXRαand H7 of PPARγ“close,”and vice versa. Arrows indicate the eigenvalues along the eigenvector, with motions only illustrated if they were larger than 0.2 nm.
(TIF)
S6 Fig. Motions along eigenvector 1 for the phospho complex simulations.PPARγhelices are shown in blue (dark and light representing extremes along the eigenvector), while RXRα helices are shown in red (dark and light again representing extremes). Each helix is labeled, with blue and red indicating PPARγand RXRα, respectively. The left and right panels are dif-ferent views, rotated around the vertical axis between the PPARγand RXRαLBD. H7 of RXRα and H9 of PPARγ“close”while H9 of RXRαand H7 of PPARγ“open,”though the opening motion is muted compared to the holo complex, and vice versa. Arrows indicate the eigenval-ues along the eigenvector, with motions only illustrated if they were larger than 0.2 nm. (TIF)
S7 Fig. Motions along eigenvector 1 for the apo complex simulations.PPARγhelices are shown in blue (dark and light representing extremes along the eigenvector), while RXRα heli-ces are shown in red (dark and light again representing extremes). Each helix is labeled, with blue and red indicating PPARγand RXRα, respectively. The left and right panels are different views, rotated around the vertical axis between the PPARγand RXRαLBD. Arrows indicate the eigenvalues along the eigenvector, with motions only illustrated if they were larger than 0.2 nm.
(TIF)
S8 Fig. Motions along eigenvector 1 for the unbound complex simulations.PPARγhelices are shown in blue (dark and light representing extremes along the eigenvector), while RXRα helices are shown in red (dark and light again representing extremes). Each helix is labeled, with blue and red indicating PPARγand RXRα, respectively. The left and right panels are dif-ferent views, rotated around the vertical axis between the PPARγand RXRαLBD. Arrows indi-cate the eigenvalues along the eigenvector, with motions only illustrated if they were larger than 0.2 nm.
(TIF)
S9 Fig. Motions along eigenvector 1 for the phospho-unbound complex simulations. PPARγhelices are shown in blue (dark and light representing extremes along the eigenvector), while RXRαhelices are shown in red (dark and light again representing extremes). Each helix is labeled, with blue and red indicating PPARγand RXRα, respectively. The left and right pan-els are different views, rotated around the vertical axis between the PPARγand RXRαLBD. Ar-rows indicate the eigenvalues along the eigenvector, with motions only illustrated if they were larger than 0.2 nm.
(TIF)
S10 Fig. Backbone RMSD time series for both PPARγand RXRα.The RMSD for each pro-tein was calculated after performing a least-squares fit on the backbone atoms of that propro-tein to remove global rotational and translational motion.
S11 Fig. Backbone RMSD time series for the PPARγDBD (residues 108–175) and LBD (residues 207–476), and RXRαDBD (residues 132–199) and LBD (residues 230–455) after least-squares fitting to the backbone atoms in the domain.For this analysis, modeled loop regions were excluded.
(TIF)
S1 Table. Ligand topologies. (DOCX)
Acknowledgments
Financial support from the Virginia Tech College of Agriculture and Life Sciences Biodesign and Bioprocessing Research Center is gratefully acknowledged. The authors thank the adminis-trators of Advanced Research Computing for computing time on the BlueRidge and Hokie-Speed supercomputers. Use of HokieHokie-Speed was provided by NSF grant CNS-0960081.
Author Contributions
Conceived and designed the experiments: JAL DRB. Performed the experiments: JAL. Ana-lyzed the data: JAL SNL. Wrote the paper: JAL SNL JB DRB.
References
1. Tontonoz P, Hu E, Graves RA, Budavari AI, Spiegelman BM. mPPARγ2: tissue-specific regulator of an adipocyte enhancer. Genes Dev. 1994; 8: 1224–1234. PMID:7926726
2. Tontonoz P, Hu E, Devine J, Beale EG, Spiegelman BM. PPARγ2 Regulates Adipose Expression of the Phosphoenolpyruvate Carboxykinase Gene. Mol Cell Biol. 1995; 15: 351–357. PMID:7799943
3. Bain DL, Heneghan AF, Connaghan-Jones KD, Miura MT. Nuclear Receptor Structure: Implications for Function. Annu Rev Physiol. 2007; 69: 201–220. PMID:17137423
4. Chandra V, Huang P, Hamuro Y, Raghuram S, Wang Y, Burris TP, et al. Structure of the intact
PPAR-γ-RXR-αnuclear receptor complex on DNA. Nature. 2008; 456: 350–356. doi:10.1038/nature07413 PMID:19043829
5. Tontonoz P, Spiegelman BM. Fat and Beyond: The Diverse Biology of PPARγ. Annu Rev Biochem. 2008; 77: 289–312. doi:10.1146/annurev.biochem.77.061307.091829PMID:18518822
6. Lehmann JM, Moore LB, Smith-Oliver TA, Wilkison WO, Willson TM, Kliewer SA. An Antidiabetic Thia-zolidinedione Is a High Affinity Ligand for Peroxisome Proliferator-activated Receptorγ(PPARγ). J Biol Chem. 1995; 270: 12953–12956. PMID:7768881
7. Farce A, Renault N, Chavatte P. Structural Insight into PPARγLigands Binding. Curr Med Chem. 2009; 16: 1768–1789. PMID:19442144
8. Pochetti G, Godio C, Mitro N, Caruso D, Galmozzi A, Scurati S, et al. Insights into the Mechanism of Partial Agonism: Crystal Structures of the Peroxisome Proliferator-Activated ReceptorγLigand-Binding Domain in the Complex with Two Enantiomeric Ligands. J Biol Chem. 2007; 282: 17314–17324. PMID:17403688
9. Gelman L, Feige JN, Desvergne B. Molecular basis of selective PPARγmodulation for the treatment of Type 2 diabetes. Biochim Biophys Acta. 2007; 1771: 1094–1107. PMID:17459763
10. Lu I-L, Huang C-F, Peng Y-H, Lin Y-T, Hsieh H-P, Chen C-T, et al. Structure-Based Drug Design of a Novel Family of PPARγPartial Agonists: Virtual Screening, X-ray Crystallography, and in Vitro/in Vivo Biological Activities. J Med Chem. 2006; 49: 2703–2712. PMID:16640330
11. Malapaka RRV, Khoo S, Zhang J, Choi JH, Zhou XE, Xu Y, et al. Identification and Mechanism of 10-Carbon Fatty Acid as Modulating Ligand of Peroxisome Proliferator-activated Receptors. J Biol Chem. 2012; 287: 183–195. doi:10.1074/jbc.M111.294785PMID:22039047
12. Olefsky JM. Treatment of insulin resistance with peroxisome proliferator-activated receptorγagonists. J Clin Invest. 2000; 106: 467–472. PMID:10953021
14. Shao D, Rangwala SM, Bailey ST, Krakow SL, Reginato MJ, Lazar MA. Interdomain communication regulating ligand binding by PPAR-γ. Nature. 1998; 396: 377–380. PMID:9845075
15. Choi JH, Banks AS, Estall JL, Kajimura S, Boström P, Laznik D, et al. Anti-diabetic drugs inhibit obesi-ty-linked phosphorylation of PPARγby Cdk5. Nature. 2010; 466: 451–456. doi:10.1038/nature09291 PMID:20651683
16. Choi JH, Banks AS, Kamenecka TM, Busby SA, Chalmers MJ, Kumar N, et al. Antidiabetic actions of a non-agonist PPARγligand blocking Cdk5-mediated phosphorylation. Nature. 2011; 477: 477–481. doi: 10.1038/nature10383PMID:21892191
17. Gampe RT Jr., Montana VG, Lambert MH, Wisely GB, Milburn MV, Xu HE. Structural basis for autore-pression of reinoid X receptor by tetramer formation and the AF-2 helix. Genes Dev. 2000; 14: 2229–
2241. PMID:10970886
18. Bruning JB, Chalmers MJ, Prasad S, Busby SA, Kamenecka TM, He Y, et al. Partial Agonists Activate PPARγUsing a Helix 12 Independent Mechanism. Structure. 2007; 15: 1258–1271. PMID:17937915
19. Nolte RT, Wisely GB, Westin S, Cobb JE, Lambert MH, Kurokawa R, et al. Ligand binding and co-acti-vator assembly of the peroxisome proliferator-activated receptor-γ. Nature. 1998; 395: 137–143. PMID:9744270
20. Phillips KJ, Rosenbaum DM, Liu DR. Binding and Stability Determinants of the PPARγNuclear Recep-tor-Coactivator Interface As Revealed by Shotgun Alanine Scanning and in Vivo Selection. J Am Chem Soc. 2006; 128: 11298–11306. PMID:16925449
21. Li M, Pascual G, Glass CK. Peroxisome Proliferator-Activated Receptorγ-Dependent Repression of the Inducible Nitric Oxide Synthase Gene. Mol Cell Biol. 2000; 20: 4699–4707. PMID:10848596
22. Rochel N, Ciesielski F, Godet J, Moman E, Roessle M, Peluso-Iltis C, et al. Common architecture of nu-clear receptor heterodimers on DNA direct repeat elements with different spacings. Nat Struct Mol Biol. 2011; 18: 564–571. doi:10.1038/nsmb.2054PMID:21478865
23. Osz J, Pethouskov MV, Sirigu S, Svergun DI, Moras D, Rochel N. Solution Structures of PPARγ2/ RXRαComplexes. PPAR Res. 2012; 2012: 701412. doi:10.1155/2012/701412PMID:23319938
24. Bernardes A, Batista FAH, de Oliveira Neto M, Figueira ACM, Webb P, Saidemberg D, et al. Low-Reso-lution Molecular Models Reveal the Oligomeric State of the PPAR and the Conformational Organization of Its Domains in Solution. PLoS ONE. 2012; 7: e31852. doi:10.1371/journal.pone.0031852PMID: 22363753
25. Hughes TS, Chalmers MJ, Novick S, Kuruvilla DS, Chang MR, Kamenecak TM, et al. Ligand and Re-ceptor Dynamics Contribute to the Mechanism of Graded PPARγAgonism. Structure. 2012; 20: 139–
150. doi:10.1016/j.str.2011.10.018PMID:22244763
26. Bruning JB, Chalmers MJ, Prasad S, Busby SA, Kamenechka TM, He Y, et al. Partial Agonists Activate PPARγUsing a Helix 12 Independent Mechanism. Structure. 2007; 15: 1258–1271. PMID:17937915
27. Zhang J, Chalmers MJ, Stayrook KR, Burris LL, Wang Y, Busby SA, et al. DNA binding alters coactiva-tor interaction surfaces of the intact VDR-RXR complex. Nat Struct Mol Biol. 2011; 18: 556–563. doi: 10.1038/nsmb.2046PMID:21478866
28. Meijsing SH, Pufall MA, So AY, Bates DL, Chen L, Yamamoto KR. DNA Binding Site Sequence Directs Glucocorticoid Receptor Structure and Activity. Science. 2009; 324: 407–410. doi:10.1126/science. 1164265PMID:19372434
29. Chebaro Y, Amal I, Rochel N, Rochette-Egly C, Stote RH, Dejaegere A. Phosphorylation of the Retinoic Acid Receptor Alpha Induces a Mechanical Allosteric Regulation and Changes in Internal Dynamics. PLoS Comp Biol. 2013; 9: e1003012. doi:10.1371/journal.pcbi.1003012PMID:23637584
30. Fidelak J, Ferrer S, Oberlin M, Moras D, Dejaegere A, Stote RH. Dynamic correlation networks in human peroxisome proliferator-activated receptor-γnuclear receptor protein. Eur Biophys J. 2010; 39: 1503–1512. doi:10.1007/s00249-010-0608-9PMID:20496064
31. Fiser A, Do RK, Sali A. Modeling of loops in protein structures. Protein Sci. 2000; 9: 1753–1773. PMID: 11045621
32. Fiser A, Sali A. ModLoop: automated modeling of loops in protein structures. Bioinformatics. 2003; 19: 2500–2501. PMID:14668246
33. Lindorff-Larsen K, Piana S, Palmo K, Maragakis P, Klepeis JL, Dror RO, et al. Improved side-chain tor-sion potentials for the Amber ff99SB protein force field. Proteins. 2010; 78: 1950–1958. doi:10.1002/ prot.22711PMID:20408171
34. Wang J, Wolf RM, Caldwell JW, Kollman PA, Case DA. Development and Testing of a General Amber Force Field. J Comput Chem. 2004; 25: 1157–1174. PMID:15116359
36. Gordon JC, Myers JB, Folta T, Shoja V, Heath LS, Onufriev A. H++: a server for estimating pKas and adding missing hydrogens to macromolecules. Nucleic Acids Res. 2005; 33: W368–371. PMID: 15980491
37. Myers J, Grothaus G, Narayanan S, Onufriev A. A simple clustering algorithm can be accurate enough for use in calculations of pKs in macromolecules. Proteins. 2006; 63: 928–938. PMID:16493626
38. Anandakrishnan R, Aguilar B, Onufriev AV. H++ 3.0: automating pK prediction and the preparation of biomolecular structures for atomistic molecular modeling and simulation. Nucleic Acids Res. 2012; 40: W537–W541. doi:10.1093/nar/gks375PMID:22570416
39. Dudev T, Lim C Factors Governing the Protonation State of Cysteines in Proteins: An Ab Initio/CDM Study. J Am Chem Soc. 2002; 124: 6759–6766. PMID:12047197
40. Hess B, Kutzner C, van der Spoel D, Lindahl E. GROMACS 4: Algorithms for Highly Efficient, Load-Bal-anced, and Scalable Molecular Simulation. J Chem Theory Comput. 2008; 4: 435–447.
41. Pronk S, Páll S, Schulz R, Larsson P, Bjelkmar P, Apostolov R, et al. GROMACS 4.5: a high-throughput and highly parallel open source molecular simulation toolkit. Bioinformatics. 2013; 29: 845–854. doi: 10.1093/bioinformatics/btt055PMID:23407358
42. Hess B. P-LINCS: A Parallel Linear Constraint Solver for Molecular Simulation. J Chem Theory Com-put. 2008; 4: 116–122.
43. Verlet L. Computer "Experiments" on Classical Fluids. I. Thermodynamical Properties of Lennard-Jones Molecules. Phys Rev. 1967; 159: 98–103.
44. Darden T, York D, Pedersen L. Particle mesh Ewald: An N log(N) method for Ewald sums in large sys-tems. J Chem Phys. 1993; 98: 10089–10092.
45. Essmann U, Perera L, Berkowitz ML, Darden T, Lee H, Pedersen LG. A smooth particle mesh Ewald method. J Chem Phys. 1995; 103: 8577–8593.
46. Bussi G, Donadio D, Parrinello M. Canonical sampling through velocity rescaling. J Chem Phys. 2007; 126: 014101. PMID:17212484
47. Parrinello M, Rahman A. Polymorphic transitions in single crystals: A new molecular dynamics method. J Appl Phys. 1981; 52: 7182–7190.