J Pediatr (Rio J). 2014;90(4):344---355
www.jped.com.br
REVIEW ARTICLE
Evaluation of the medication process in pediatric
patients: a meta-analysis
夽
Despina Koumpagioti
a,∗, Christos Varounis
b, Eleni Kletsiou
b,
Charalampia Nteli
a, Vasiliki Matziou
caP & A Kyriakoy General Children’s Hospital, Athens, Greece bAttikon Hospital, Athens, Greece
cFaculty of Nursing, National and Kapodistrian University, Athens, Greece
Received 16 January 2014; accepted 28 January 2014 Available online 13 April 2014
KEYWORDS
Medication errors; Children;
Drug errors; Pediatric patients; Medication process; Meta-analysis
Abstract
Objective: to meta-analyze studies that have assessed the medication errors rate in pediatric patients during prescribing, dispensing, and drug administration.
Sources: searches were performed in the PubMed, Cochrane Library, and Trip databases, select-ing articles published in English from 2001 to 2010.
Summary of the findings: a total of 25 original studies that met inclusion criteria were selected, which referred to pediatric inpatients or pediatric patients in emergency departments aged 0-16 years, and assessed the frequency of medication errors in the stages of prescribing, dispensing, and drug administration.
Conclusions: the combined medication error rate for prescribing errors to medication orders was 0.175 (95% Confidence Interval: [CI] 0.108-0.270), the rate of prescribing errors to total medication errors was 0.342 (95% CI: 0.146-0.611), that of dispensing errors to total medication errors was 0.065 (95% CI: 0.026-0.154), and that ofadministration errors to total medication errors was 0.316 (95% CI: 0.148-0.550). Furthermore, the combined medication error rate for administration errors to drug administrations was 0.209 (95% CI: 0.152-0.281). Medication errors constitute a reality in healthcare services. The medication process is significantly prone to errors, especially during prescription and drug administration. Implementation of medication error reduction strategies is required in order to increase the safety and quality of pediatric healthcare.
© 2014 Sociedade Brasileira de Pediatria. Published by Elsevier Editora Ltda. All rights reserved.
夽
Please cite this article as: Koumpagioti D, Varounis C, Kletsiou E, Nteli C, Matziou V. Evaluation of the medication process in pediatric patients: a meta-analysis. J Pediatr (Rio J). 2014;90:344---55.
∗Corresponding author.
E-mail:[email protected] (D. Koumpagioti).
http://dx.doi.org/10.1016/j.jped.2014.01.008
Evaluation of the medication process in pediatric patients 345
PALAVRAS-CHAVE
Erros de medicac¸ão; Crianc¸as;
Erros de medicamentos; Pacientes pediátricos; Processo de medicac¸ão; Meta-análise
Avaliac¸ão do processo de medicac¸ão em pacientes pediátricos: meta-análise
Resumo
Objetivo: analisar estudos de meta-análise que avaliaram o índice de erros de medicac¸ão em pacientes pediátricos na prescric¸ão, liberac¸ão e administrac¸ão de medicamentos.
Fontes dos dados: foram feitas buscas nas bases de dados Pubmed, Biblioteca Cochrane e Trip, selecionando artigos publicados em inglês de 2001 a 2010.
Síntese dos dados: um total de 25 estudos originais que atenderam aos critérios de inclusão foi selecionado e está relacionado a pacientes pediátricos internados ou pacientes pediátricos nos Servic¸os de Emergência, com idades entre 0-16 anos. Esses estudos avaliaram a frequência de erros de medicac¸ão nas etapas de prescric¸ão, liberac¸ão e administrac¸ão de medicamentos.
Conclusões: o índice combinado de erros de medicac¸ão para erros na prescric¸ão/solicitac¸ão de medicac¸ão foi igual a 0,175 (com intervalos de confianc¸a (IC) de 95%: 0,108-0,270); para erros na prescric¸ão/total de erros de medicac¸ão foi 0,342, com IC de 95%: 0,146-0,611; para erros na liberac¸ão/total de erros de medicac¸ão foi 0,065, com IC de 95%: 0,026-0,154; e para erros na administrac¸ão/total de erros de medicac¸ão foi 0,316, com IC de 95%: 0,148-0,550. Adicional-mente, o índice combinado de erros de medicac¸ão para erros na administrac¸ão/administrac¸ão de medicamentos foi igual a 0,209, com IC de 95%: 0,152-0,281. Erros de medicac¸ão con-stituem uma realidade nos servic¸o de saúde. O processo de medicac¸ão é significativamente propenso a erros, principalmente na prescric¸ão e administrac¸ão de medicamentos. Precisa haver a implementac¸ão de estratégias de reduc¸ão dos erros de medicac¸ão para aumentar a seguranc¸a e a qualidade na prestac¸ão de cuidados de saúde pediátrica.
© 2014 Sociedade Brasileira de Pediatria. Publicado por Elsevier Editora Ltda. Todos os direitos reservados.
Introduction
Medication errors constitute a reality in healthcare systems, and are considered to be the most common type of medical errors, according to the Joint Commission.1 The pediatric
population is under the risk of medication errors due to the wide variation in body mass, which requires unique drug doses to be calculated, based on the patient’s weight or body surface, age, and clinical condition.2Particularly,
med-ication errors with the potential to cause harm are three times more likely in pediatric inpatients than in adults.3The
great majority of medication errors in children pertain to the stages of prescription and drug administration, according the results of systematic reviews and original studies.3---6
Consequently, according to the National Coordinating Council for Medication Error Reporting and Prevention, the aim of each healthcare organization should be the con-stant improvement of its systems in order to prevent harm caused by medication errors.7 Thus, the development of
medication error reduction strategies is an important part of ensuring the safety and quality of patient care in pedi-atric population.8The aim of this study was to meta-analyze
studies that have evaluated the frequency of pediatric medication errors during prescribing, dispensing, and drug administration, in order to highlight the vulnerability to errors of each step, and to improve medication process, leading to error reduction.
Methods
Definitions terms
For the needs of this meta-analysis, some basic defini-tions related to the medication errors were used, with the
approval of the review of the institution. The definition of medication process includes prescribing, transcribing or documenting, dispensing, administering, and monitoring the patient.9Medication error is considered as every error
dur-ing the medication use process.10 Prescribing errors include
incomplete, incorrect, inappropriate request at the time of physician order, illegibility and/or need for further interpre-tation, or any missing route, interval, concentration, rate, dose, and patient data (such as weight, age, or allergies).11
Dispensing error is assumed as any deviation or error deriv-ing from the receipt of the prescription in the pharmacy to the supply of a dispensed medicine to the patient.12Finally,
administration error is defined as any discrepancy occur-ring between the drug received by the patient and the drug therapy intended by the physician.12
Literature review
A systematic literature review was conducted from January of 2001 to December of 2010 using the PubMed, Cochrane, and Trip databases, using the key words ‘‘medication errors’’, ‘‘children’’, ‘‘drug errors’’, ‘‘pediatric patients’’, ‘‘medication process’’, and ‘‘meta-analysis’’. The litera-ture search was based on original studies that met the inclusion criteria quoted below:
• Studies published in English from January 1, 2001 to
December 31, 2010.
• Studies that referred to pediatric inpatients or pediatric
patients in emergency departments.
• Studies that included patients aged 0 to 16 years. • Studies that assessed the frequency of medication errors
346 Koumpagioti D et al.
• Studies that had the same numerators and denominators
for the data grouping.
The exclusion criteria involved studies with incomplete data whose clarification was not feasible, despite the researchers’ assistance for the retrieval of required infor-mation. Furthermore, the exclusion criteria involved studies that exclusively referred to:
• pediatric outpatients;
• specific drug categories, such as cardiological and
anti-neoplastics, among others;
• specific patient categories, such as oncology; and • adverse drug events (ADEs).
The studies used for this meta-analysis contained clear and unambiguous data related to pediatric medication errors, in these three stages of the process of medica-tion, and described the frequency of medication errors in each stage. The majority of these studies were systematic reviews, and their quality was assessed through the use of two scales. Due to the absence of a universal scale for the quality assessment of observational studies (that constitute the majority of the studies involved in this meta-analysis), and following the recommendations of the meta-analysis of observational studies in epidemiology guidelines,13the
qual-ity of key design components was assessed separately, and then used to generate a single aggregate score.14 For the
measurement of cohort studies quality, a scale of four ques-tions (such as cohort inclusion criteria, exposure definition, clinical outcomes, and adjustment for confounding varia-bles) was used, while each question was scored on a scale of 0 to 2, with a maximum quality score of 8, representing the highest quality score.14
The quality of the one randomized clinical control trial was assessed by a modified Jadad scale with a maximum of 3 points. A maximum of 2 points were earned for the randomization method, and a maximum of 1 point for the description of withdrawals and dropouts.15
Two independent reviewers screened the title and the abstract of each study for their correspondence to the inclusion criteria. In full text articles, two reviewers decided their eligibility, while the relevant information was extracted sequentially, so that the second reviewer was able to study the first reviewer’s extracted information.
Statistical Analysis
For each study, the following error rates were computed from the reported data: prescribing errors to medication orders, prescribing errors to total medication errors, dis-pensing errors to total medication errors, administration errors to total medication errors, and administration errors to drug administrations. For each error rate, the pooled estimates and 95% confidence intervals (95% CIs) were cal-culated using the random effects model, due to evidence of significant heterogeneity. Heterogeneity was investigated by use of I2 statistic. Publication bias was tested statistically
with Egger’s test, which estimates the publication bias by linear regression approach. Analyses were performed using the Comprehensive Meta-Analysis software (Comprehensive
Meta-Analysis Software) (CMA) (Biostat, Inc.). CMA uses computational algorithms to weight studies by inverse vari-ance. Statistical significance was set at a p-value level of 0.05.
Results
Literature search
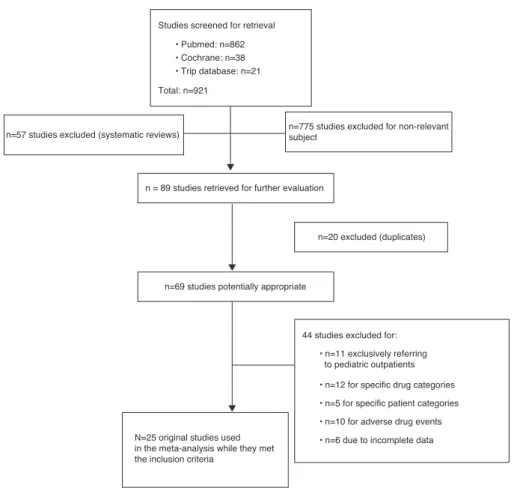
Through the systematic literature review, 921 original stud-ies and systematic reviews were identified, while 775 of those were excluded due to the absence of subject rele-vance, and 57 because they were systematic reviews. 89 studies remained and were evaluated further, while 20 of those were rejected due to the existence of the same stud-ies in different databases. Finally, from the remaining 69 studies, 44 were excluded because they didn’t meet the inclusion criteria. Consequently, 25 original studies were included in this meta-analysis. Fig. 1 represents the flow diagram and provides an overview of the literature review and studies’ selection.
Characteristics of the studies
Table 1 shows the basic characteristics of the 25 studies included in the meta-analysis. In a total of 25 studies, there were nine cohort studies,3,5,11,16---21
three retrospective cohort studies,22---24 seven
retrospec-tive studies,4,25---30 two interventional studies,31,32 one
quasi-experimental study,33 one cross-sectional study,34
one randomized controlled trial,35 and one
observa-tional study.36 Furthermore, the majority of the studies
relied on chart review for the data collection (17 of 25),3,5,11,18,20---22,24,26---32,34,35while four of the 25 studies relied
on error reporting systems,4,17,18,23,25 three of 25 studies
on observation,16,19,36 and one study on chart review and
interviews.33Regarding the types of medication errors
iden-tified through these studies, nine of 25 reported prescribing errors;11,24,26,28,30---33,35 three of 25 studies, administration
errors;16,19,36five of 25 studies, prescribing and
administra-tion errors;21,22,29,34 seven studies, all types of medication
errors;3---5,17,18,23,25 and one study reported prescribing and
dispensing errors.27 Finally, 17 studies referred to pediatric
inpatients,3---5,11,16---21,23,25,28,31---32,34,36 seven studies to
pedi-atric patients in emergency departments,22,24,26,29,30,33,35and
one study to pediatric inpatients and patients in emergency departments.27
In studies in which there was
intervention,5,11,17---18,21,23---24,28,29,31---36 data was obtained
from phase I only, as presented in Table 1.
Therefore, great heterogeneity between the studies was observed, due to the difference in parameters and condi-tions used for the data collection. Significant heterogeneity was observed in the manner that medication errors and their categories were defined by each study. Namely, there were studies in which administration errors included every error from the stage of drug dispensing in the ward by the nursing staff to drug administration, such as those by Chua et al.,19
Fontan et al.,21and Jain et al.27These studies, in this
Evaluation
of
the
medication
process
in
pediatric
patients
347
Table 1 Characteristics of the studies included in the meta-analysis.
Studies Study
Design
Setting Duration Instruments
used for the data collection
Error types Results Quality
Cowley et al.,4 2001 USA
Retrospective Pediatric Inpatients
01/1999 ---12/2000
Error reporting system
All types 143 prescribing errors, 449 dispensing errors, 1007 administration errors, in a total of 1,956
medication errors
-Kaushal et al.,3 2001 USA
Cohort PICU,
Medical/surgical wards,
short-stay medical ward
04/1999 ---05/1999
Chart review
All types 454 prescribing errors, 6 dispensing errors, 78 administration errors, in a total of 616 medication errors
7
Sangtawesin et al.,252003 Thailand
Retrospective PICU, NICU 09/2001
---11/2002
Error reporting system
All types 114 prescribing errors, 112 dispensing errors, 49 administration errors, in a total of 322 medication errors
-Kozer et al.,22 2002 Canada
Retrospective cohort
Emergency department
12 randomly days of 2000
Chart review
Prescribing, administration
271 prescribing errors per 1,678 medication orders, 59 administration errors per 1,532 charts
7
Cimino et al.,31 2004 USA
Interventional PICU 2 weeks Chart
review
Prescribing 3,259 errors per 12,026 medication orders
-Potts et al.,11 2004 USA
Cohort PICU 10/2001
---12/2001 (1stphase)
Chart review
Prescribing 2,049 errors per 6,803 medication orders
6
Prot et al.,16 2005 France
Cohort PICU, NICU,
general pediatric, and
nephrological unit
04/2002 ---03/2003
Observation Administration 538 errors per 1,719 drug administrations
7
Frey et al.,17 2002 Switzerland
Cohort PICU 01/01/2000
---31/12/2000
Error reporting system
All types 102 prescribing errors, 162 dispensing errors, 200 administration errors in a total of 275 medication errors
348
K
oumpagioti
D
et
al.
Table 1 (Continued)
Studies Study
Design
Setting Duration Instruments
used for the data collection
Error types Results Quality
Porter et al.,33 2008 USA
Quasi-experimental
Emergency department
06/2005 ---06/2006
Chart review, interviews
Prescribing 1,755 errors per 2,234 medication orders
-Taylor et al.,26 2005 USA
Retrospective Emergency department
01/1998 -06/1998
Chart review
Prescribing 311 errors per 358 medication orders
-Wang et al.,18 2007 USA
Cohort PICU, NICU,
pediatric ward
02/2002 ---04/2002
Chart review, error reporting system
All types 464 prescribing errors, 2 dispensing errors, 101 administration errors in a total of 865 medication errors
6
King et al.,23 2003 Canada
Retrospective cohort
Medical and surgical ward
04/1993 ---03/1996 (1stphase)
Error reporting system
All types 13 prescribing errors, 19 dispensing errors, 314 administration errors in a total of 416 medication errors
7
Kozer et al.,35 2005 Canada
Randomized control clinical trial
Emergency department
07/2001 Chart
review
Prescribing 68 errors per 411 medication orders
3 (Jadad score) Otero et al.,34
2008 Argentina
Cross-sectional
ICU, NICU pediatrics clinic
06/2002 (1stphase)
Chart review
Prescribing, administration
102 prescribing errors per 590 medication orders 99 administration errors per 1,174 drug administrations
-Fortescue et al.,52003 USA
Cohort PICU, NICU,
short-stay medical ward, medical/ surgical ward
04/1999 ---05/1999
Chart review
All types 479 prescribing errors, 6 dispensing errors, 79 administration errors in a total of 616 medication errors
5
Chua et al.,19 2010 Malaysia
Cohort Pediatric ward 11/2004
---01/2005
Observation Administration 100 errors per 857 drug administrations
5
Ghaleb et al.,20 2010 UK
Cohort PICU, NICU
medical and surgical ward
2004-2005 for 22 weeks
Chart review
Prescribing, administration
391 prescribing errors per 2,955 medication orders 429 administration errors per 1,544 drug
administrations
Evaluation
of
the
medication
process
in
pediatric
patients
349
Table 1 (Continued)
Studies Study
Design
Setting Duration Instruments
used for the data collection
Error types Results Quality
Fontan et al.,21 2003 France
Cohort Nephrological
Unit
02/1999 ---03/1999
Chart review
Prescribing, administration
937 prescribing errors per 4,532 medication orders 1077 administration errors per 4,135 drug
administrations
6
Raja Lope et al.,36 Malaysia
Observational NICU 02/2005
(1stphase)
Observation Administration 59 errors per 188 drug administrations
-Sard et al.,24 2008 USA
Retrospective cohort
Emergency department
2005 Chart
review
Prescribing 101 errors per 326 medication orders
7
Jain et al.,27 2009 India
Retrospective PICU, Emergency department
01/2004 ---04/2004
Chart review
Prescribing, dispensing
67 prescribing errors & 14 dispensing errors per 821 medication orders
-Kadmon et al.,282009 Israel
Retrospective PICU 09/2001
(1stphase)
Chart review
Prescribing 103 errors per 1,250 medication orders
-Larose et al.,29 2008 Canada
Retrospective Emergency department
2003 (1stphase)
Chart review
Prescribing, administration
32 prescribing errors & 23 administration errors per 372 medication orders
-Rinke et al.,30 2008 USA
Retrospective Emergency department
04/2005 ---09/2005
Chart review
Prescribing 81 errors per 1,073 medication orders
-Campino et al.,322009 Spain
Interventional NICU
09/2005-02/2006
Chart review
Prescribing 868 errors per 4,182 medication orders
350 Koumpagioti D et al.
Studies screened for retrieval
• Pubmed: n=862 • Cochrane: n=38 • Trip database: n=21
Total: n=921
n=775 studies excluded for non-relevant subject
n = 89 studies retrieved for further evaluation
n=69 studies potentially appropriate
n=20 excluded (duplicates)
44 studies excluded for:
• n=11 exclusively referring to pediatric outpatients
• n=12 for specific drug categories
• n=5 for specific patient categories
• n=10 for adverse drug events
• n=6 due to incomplete data n=57 studies excluded (systematic reviews)
Ν=25 original studies used in the meta-analysis while they met the inclusion criteria
Figure 1 Flow diagram of studies included in the meta-analysis.
errors. In other studies, dispensing errors were defined as errors during drug dispensing by the pharmacist.5,8,17,18,23,25
Difference was also noticed between the definitions of prescribing errors across the studies. While the majority of the studies used the broadest sense of the term ‘‘prescribing error’’,20,24,26,29,32---34as the one used for this meta-analysis,
there were studies that used the term prescribing error solely as any incomplete or ambiguous order.11,28
Moreover, there was a differentiation in the instruments used for the data collection by each study, the studies’ design, the age groups that took part in each study, the sett-ings, and the numerators and denominators used by each study for the assessment of the frequency of medication error occurrence.
Statistical Results
For the purposes of this study, five groups based on com-mon numerators and denominators were combined. The numerator and the denominator of each study constitute the estimated relative measure. Through the use of the esti-mated relative measure (numerator/denominator) of each study, integrated error rates were calculated for each of these groups. Most studies participated in more than one group. The first group, specifically, included prescribing errors in relation to the medication orders. The prescrib-ing errors were defined as numerators and the medication orders as denominators. The prescribing error rate per
medication orders was calculated as 0.175 (95% CI: 0.108-0.270; p-value < 0.001). The second group related to prescribing errors (numerator) and total medication errors (denominator). The integrated prescribing error rate was 0.342 (95% CI: 0.146-0.611; p-value = 0.246). The third group included dispensing errors (numerator) and total medication errors (denominator). The total dispensing error rate was estimated as 0.065 (95% CI: 0.026-0.154; p-value < 0.001). The fourth group consisted of administration errors as numerator and total medication errors as denominator, with a total administration error rate of 0.316 (95% CI: 0.148-0.550; p-value = 0.119). Finally, the fifth group con-tained administration errors per drug administration. The integrated administration error rate was 0.209, (95% CI: 0.152-0.281; p-value < 0.001).
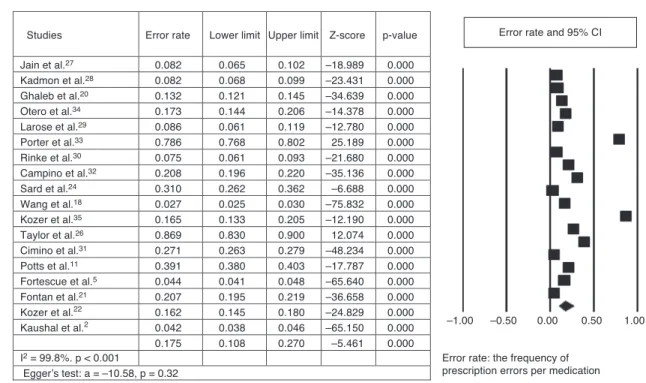
Prescribing errors per medication orders
Eighteen studies were used for this group. Nine of 18 studies referred exclusively to prescribing errors;11,26,30---33,35 five of
18, to prescribing and administration errors;20---22,29,34one of
18, to prescribing and dispensing errors;27and three of 18, to
all types of errors.3,5,18 Furthermore, all studies comprised
Evaluation of the medication process in pediatric patients 351
Error rate: the frequency of prescription errors per medication Studies Error rate Lower limit Upper limit Z-score p-value
Jain et al.27 0.082 0.065 0.102 –18.989 0.000
Kadmon et al.28 0.082 0.068 0.099 –23.431 0.000
Ghaleb et al.20 0.132 0.121 0.145 –34.639 0.000
Otero et al.34 0.173 0.144 0.206 –14.378 0.000
Larose et al.29 0.086 0.061 0.119 –12.780 0.000
Porter et al.33 0.786 0.768 0.802 25.189 0.000
Rinke et al.30 0.075 0.061 0.093 –21.680 0.000
Campino et al.32 0.208 0.196 0.220 –35.136 0.000
Sard et al.24 0.310 0.262 0.362 –6.688 0.000
Wang et al.18 0.027 0.025 0.030 –75.832 0.000
Kozer et al.35 0.165 0.133 0.205 –12.190 0.000
Taylor et al.26 0.869 0.830 0.900 12.074 0.000
Cimino et al.31 0.271 0.263 0.279 –48.234 0.000
Potts et al.11 0.391 0.380 0.403 –17.787 0.000
Fortescue et al.5 0.044 0.041 0.048 –65.640 0.000
Fontan et al.21 0.207 0.195 0.219 –36.658 0.000
Kozer et al.22 0.162 0.145 0.180 –24.829 0.000
Kaushal et al.2 0.042 0.038 0.046 –65.150 0.000
0.175 0.108 0.270 –5.461 0.000
–1.00 –0.50 0.00 0.50 1.00
I2 = 99.8%. p < 0.001
Egger’s test: a = –10.58, p = 0.32
Error rate and 95% CI
Figure 2 The estimated relative measures for prescription errors per medication order, with 95% CIs (95% Confidence Intervals), the integrated error rate, and the forest plot.
the integrated error rate was calculated as 0.175, (95% CI: 0.108-0.270;and p-value < 0.001). In Fig. 2, the forest plot is illustrated. The vertical axis of the forest plot represents the studies, while the horizontal axis, the estimated rel-ative measures. Squares illustrate the estimated relrel-ative measures of each study and the diamond, the integrated error rate calculated through the random effect model.
No potential publication bias was found by Egger’s test (intercept a =−0.400;95% CI: -1.594 to 0.792; p = 0.443).
Moreover, the heterogeneity between the studies was very high, as investigated by the I2 statistic (I2= 99.8%;
p < 0.001).
Prescribing errors per total medication errors
In this group, seven studies3,4,17,18,23,25 concerning all types
of errors with the inclusion of prescribing errors were included. Fig. 3 provides an overview of the referred
studies with their error rates. The integrated prescribing error rate estimated in a total of 5,066 medication errors from these seven studies was 0.342 (95% CI: 0.146-0.611; p-value = 0.246).Additionally, in the forest plot, the signif-icant heterogeneity between the studies is illustrated, as the estimated relative measures of each study (squares) are distributed heterogeneously around the integrated error rate (diamond). No potential publication bias was found by Egger’s test (intercept a = -12.40; 95% CI: -60.19 to 35.39; p > 0.05), and very high heterogeneity as I2> 50% (I2= 99.5%;
p < 0.001).
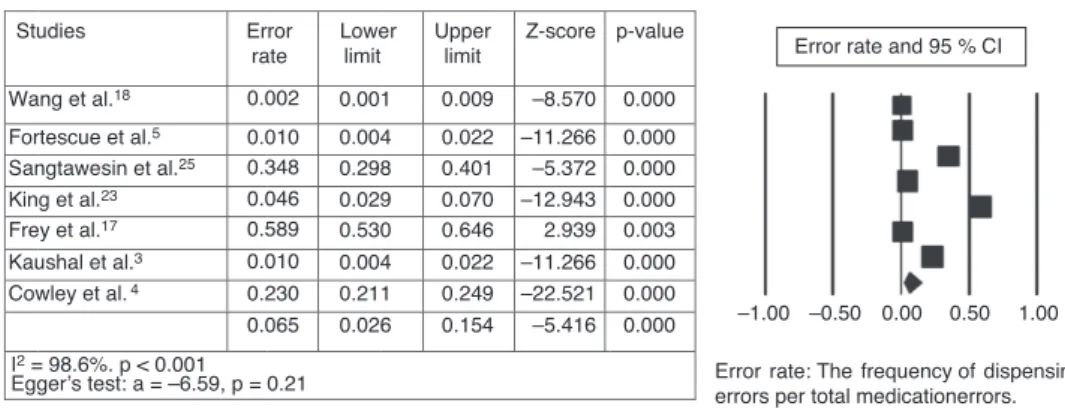
Dispensing errors per total medication errors
The same seven studies3,4,17,18,23,25 used for this group
refer to all types of errors, including dispensing errors. An overview of the studies and the forest plot is showcased in Fig. 4. The integrated dispensing error rate was 0.065
Studies
Wang et al.18
Fortescue et al.5 Sangtawesin et al.25
King et al.23 Frey et al.17 Kaushal et al.3 Cowley et al.4
Ι2 = 99.5%. p < 0.001
Egger’s test: a = –12.40, p = 0.53 Error rate
0.536
0.778 0.354
0.031 0.371 0.737 0.073 0.342
Lower limit 0.503
0.743 0.304
0.018 0.316 0.701 0.062 0.146
Upper limit 0.569
0.809 0.408
0.053 0.430 0.770 0.086 0.611
Z-score
2.140
12.919 –5.160
–12.186 –4.232 11.260 –29.241 –1.161
Error rate: The frequency of prescription errors per total medication errors. p-value
0.032
0.000 0.000
0.000 0.000 0.000 0.000
0.246 –1.00 –0.50 0.00 0.50 1.00 Error rate and 95% CI
352 Koumpagioti D et al.
Studies
Wang et al.18
Fortescue et al.5 Sangtawesin et al.25 King et al.23 Frey et al.17 Kaushal et al.3 Cowley et al.4
Ι2 = 98.6%. p < 0.001 Egger’s test: a = –6.59, p = 0.21
Error rate
0.002
0.010 0.348 0.046 0.589 0.010 0.230 0.065
Lower limit
0.001
0.004 0.298 0.029 0.530 0.004 0.211 0.026
Upper limit
0.009
0.022 0.401 0.070 0.646 0.022 0.249 0.154
Z-score
–8.570
–11.266 –5.372 –12.943 2.939 –11.266 –22.521 –5.416
Error rate: The frequency of dispensing errors per total medicationerrors. p-value
0.000
0.000 0.000 0.000 0.003 0.000 0.000 0.000
Error rate and 95 % CI
–1.00 –0.50 0.00 0.50 1.00
Figure 4 The estimated relative measures for dispensing errors per total medication errors, with 95% CIs (95% Confidence Intervals), the integrated error rate, and the forest plot.
(95% CI: 0.026-0.154; p-value < 0.001). Consequently, in a total of 5,066 medication errors, the random effect rate was measured to 6.5%.
No potential publication bias was found by Egger’s test (intercept a = -6.50; 95% CI: -18.17 to 5.15; p = 0.21), and very high heterogeneity as I2> 50% (I2= 98.6%; p < 0.001).
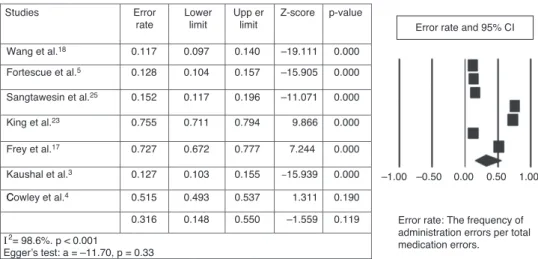
Administration errors per total medication errors
The same seven studies3,4,17,18,23,25 included in this group
reported all types of medication errors, as well as dispens-ing errors. Fig. 5 shows the estimated relative measures for each study, and the forest plot presents the distribu-tion of the studies around the integrated error rate. The administration error rate was 0.316 (95% CI: 0.148-0.550; p-value = 0.119). Thus, in a total of 5,066 medication errors, the random effect rate was 31.6%.
No potential publication bias was found by Egger’s test (intercept a = -11.70; 95% CI: -39.90 to 16.49; p = 0.33), and very high heterogeneity as I2> 50% (I2= 98.6%, p < 0.001).
Administration errors per drug administrations
Six studies16,19---21,34,36with common numerators
(administra-tion errors) and denominators (drug administra(administra-tions) were chosen for this group. For each study, the estimated rel-ative measures were calculated, as well as the integrated administration error rate, which measured 0.209 (95% CI: 0.152-0.281; p-value < 0.001). Fig. 6 provides an overview of the ratios of administration errors per drug administration and the forest plot that illustrates the studies’ contribu-tion to the value of the integrated error rate. In a total of 9,167 drug administrations, from these six studies, the random effect error rate was as 20.9%.
No potential publication bias was found by Egger’s test (intercept a = -8.28; 95% CI: -25.95 to 9.38; p = 0.26), and very high heterogeneity as I2> 50% (I2= 98.2%; p < 0.001).
Discussion
Medication errors cause serious problems in daily clinical practice and are of significant concern, especially for the pediatric population. Many of the members of the disci-plinary team may be involved in the causation of medication
errors, such as clinicians, nurses, pharmacists, although there is great speculation regarding their management and reduction. In this meta-analysis, the authors tried to esti-mate a more integrated result in relation to the frequency and nature of medication errors in pediatric patients, dur-ing the stages of prescribdur-ing, dispensdur-ing, and administration. For this objective, five different groups were created, after a careful selection of studies that met the goals of each group. Therefore, the integrated rate in relation to the pre-scribing errors per medication order was calculated as0.175, and in relation to the prescribing errors per total medication errors, dispensing errors per total medication errors, and administration errors per total medication errors were cal-culated as 0.342, 0.065, and 0.316, respectively. Moreover, the integrated rate for the ratio of administration errors per drug administration was estimated as 0.209.
This study highlighted the most vulnerable stages in the medication use process. The highest rates were observed in prescribing and drug administration, managed by clinicians and nurses, respectively. Additionally, comparing the results between the groups, the predominance of prescribing errors can be discerned, followed by administration errors; dis-pensing errors had the lowest rates. Due to the absence of other meta-analyses in relation to medication errors in children, it’s impossible to compare the results with other studies. Therefore, because of the occurrence of systematic reviews, the two stages of medication process (prescribing and administration) present the highest error rates, as shown in the study by Miller et al., in which prescribing errors varied between 3% and 37% and administration errors between 72% and 75%.6 Moreover, according to the review
of eight studies, which used observation for administration error identification, Ghaleb et al. highlighted administra-tion error rates per drug administraadministra-tion of 0.6% to 27%.2
These rates agree with that of the present meta-analysis, which was calculated as 20.9%. Moreover, Miller et al. estimated that 5% to 27% of medication orders for children contained an error throughout the entire medication pro-cess, involving prescribing, dispensing, and administration, based on three studies;6in the current meta-analysis, the
integrated error rate for prescribing errors per medication order approached 17.5%.
Evaluation of the medication process in pediatric patients 353
C Studies
Wang et al.18
Fortescue et al.5
Sangtawesin et al.25
King et al.23
Frey et al.17
Kaushal et al.3
Cowley et al.4
Ι2= 98.6%. p < 0.001
Egger’s test: a = –11.70, p = 0.33 0.117
0.128
0.152
0.755
0.727
0.127
0.515
0.316 Error rate
Lower limit
0.097
0.104
0.117
0.711
0.672
0.103
0.493
0.148
Upp er limit
0.140
0.157
0.196
0.794
0.777
0.155
0.537
0.550
Z-score
–19.111
–15.905
–11.071
9.866
7.244
–15.939
1.311
–1.559 p-value
0.000
0.000
0.000
0.000
0.000
0.000
0.190
0.119 Error rate: The frequency of administration errors per total medication errors.
Error rate and 95% CI
–1.00 –0.50 0.00 0.50 1.00
Figure 5 The estimated relative measures for administration errors per total medication errors, with 95% CIs (95% Confidence Intervals), the integrated error rate, and the forest plot.
Studies
Raja Lope et al.36
Ghaleb et al.2
Otero et al.34
Prot et al.16 Chua et al.19
Fontan et al.21
Ι2 = 98.2%. p < 0.001
Egger’s test: a = –8.28, p = 0.26 Error rate
0.117
0.314
0.276
0.084 0.070
0.313
0.260
0.209
Lower limit
0.097
0.254
0.291
0.247
0.152
Upper limitt
0.140
0.252 0.384
0.299
0.102
0.335
0.274
0.281 Z-score
–19.024
–4.977
–16.990
–22.707
–15.116
–29.452
–6.676 p-value
0.000
0.000
0.000
0.000
0.000
0.000
0.000
Error rate: the frequency of administration errors per total drug administrations.
–0.50 –0.25 0.00 0.25 0.50 Error rate and 95%% CI
Figure 6 The estimated relative measures for administration errors per drug administrations, with 95% CIs (95% Confidence Intervals), the integrated error rate, and the forest plot.
the dispensing error rates ranged between 5% and 58%, as calculated through the use of three studies, due to the het-erogeneity presented in the others studies.6
The use of I2statistic showcased significant
heterogene-ity between the studies, as I2was > 50% in all five groups.
This heterogeneity is reflected in the forest plots of each group, with the heterogeneous distribution of the studies around the integrated error rate. Furthermore, Egger’s test indicated the absence of potential publication bias.
The members of the disciplinary team manage the medi-cation delivery system and as a result, they become involved in medication errors of pediatric patients. A medication error is not the direct result of a sole member of the dis-ciplinary team’s misconduct, and the accusation of that person should not be pursued or recognized as a reward for reporting the error. The awareness of the existence of medication errors in clinical daily practice, as well as the interactive nature of the medication use process, with the participation of all members of the disciplinary team, leads to a better understanding of the errors. Consequently, the results of this meta-analysis offer useful information for healthcare professionals, as they provide the opportunity of understanding the nature and frequency of medication
errors, and the ability to re-evaluate and improve the med-ication process.
Furthermore, the existence of integrated error rates, related to medication errors in pediatric patients, can con-tribute to the understanding of the nature, frequency, and consequences of medication errors, as well as the necessity of the development of medication error reduction strate-gies, staff education, and clinical protocols and guidelines.
Limitations
The evaluation of the heterogeneity and the identification of its causes constitute parallel limitations of this meta-analysis. The selection of the studies solely published in English was a limitation, as well as the heterogeneity of the studies.
354 Koumpagioti D et al.
while pediatric intensive care units and neonatal intensive care units presented high rates in all types of medication errors.11,16---18,25,31,32,34,36
There was also a variation in the studies’ design (cohort, randomized controlled trial, cross-sectional, retrospective, interventional), as well as in the age groups that took part in each study. Some of the age groups, such as neonates, may be more vulnerable to medication errors than preschool or school age children, due to their organic prematurity, the very small amounts of therapeutic drug doses, or their serious clinical condition.
The denominators that each study used for the deter-mination of error frequency vary. Certain studies used handwritten orders or computerized orders as denomina-tors, while others were based on drug administrations. Computerized orders are more susceptible to the recog-nition of prescribing errors, in contrast to handwritten orders, where the identification of the error is at the dis-posal of the researcher or the professional who reported the error. Finally, there was a variety in the instruments that each study used for the data collection. Some stud-ies used chart reviews or observation, while others used error-reporting systems, thus minimizing the possibility of recognizing more errors, in contrast to using a combination of those instruments.6
In conclusion, medication errors in pediatric patients constitute a daily phenomenon in hospitals. Through this meta-analysis, it has been ascertained that the stages of prescription and administration were more prone to errors, as they demonstrated higher rates than the stage of dispens-ing. The stage of dispensing had the lowest error rates, with the pharmacist responsible for medication dispensing in the majority of the studies.
The results of this meta-analysis highlight the neces-sity to improve the way that both clinicians and nurses are managing the medication process during the pediatric care delivering. Furthermore, the communication between the members of the multidisciplinary team regarding medica-tion errors in children should be focused on adopmedica-tion of common definitions for medication errors and their cate-gories, staff education in recognizing medication errors, and implementation of error reporting in daily clinical practice. The establishment of medication error reduction strate-gies should constitute a goal for all healthcare institutions and a stimulus for the improvement of the pediatric care delivery.
Conflicts of interest
The authors declare no conflicts of interest.
References
1. The Joint Commission. Sentinel event alert: preventing pedi-atric medication errors. Issue 39, April 11, 2008. [cited 1 Aug 2011]. Available from: http://www.jointcommission.org/ SentinelEvents/SentinelEventAlert/sea 39.htm
2. Ghaleb MA, Barber N, Franklin BD, Yeung VW, Khaki ZF, Wong IC. Systematic review of medication errors in pediatric patients. Ann Pharmacother. 2006;40:1766---76.
3. Kaushal R, Bates DW, Landrigan C, McKenna KJ, Clapp MD, Fed-erico F, et al. Medication errors and adverse drug events in pediatric inpatients. JAMA. 2001;285:2114---20.
4. Cowley E, Williams R, Cousins D. Medication errors in chil-dren: a descriptive summary of medication error reports submitted to the United States pharmacopeia. Curr Ther Res. 2001;62:627---40.
5. Fortescue EB, Kaushal R, Landrigan CP, McKenna KJ, Clapp MD, Federico F, et al. Prioritizing strategies for preventing medi-cation errors and adverse drug events in pediatric inpatients. Pediatrics. 2003;111:722---9.
6. Miller MR, Robinson KA, Lubomski LH, Rinke ML, Pronovost PJ. Medication errors in paediatric care: a systematic review of epidemiology and an evaluation of evidence supporting reduction strategy recommendations. Qual Saf Health Care. 2007;16:116---26.
7. National Coordinating Council for Medication Error Repor-ting and Prevention. Statement from NCC MERP: use of medication error rates to compare health care organiza-tions is of no value. [cited 1 Oct 2011]. Available from: http://www.nccmerp.org/council/council2002-06-11.html 8. Gonzales K. Medication administration errors and the pediatric
population: a systematic search of the literature. J Pediatr Nurs. 2010;25:555---65.
9. United States Pharmacopeia. Medication use process. Rockville, MD: United States Pharmacopeia; 2004. [cited 1 Aug 2011]. Available from: http://www.usp.org/pdf/EN/ patientSafety/medicationUseProcess.pdf
10. Gandhi TK, Weingart SN, Seger AC, Borus J, Burdick E, et al. Outpatient prescribing errors and the impact of computerized prescribing. J Gen Intern Med. 2005;20:837---41.
11. Potts AL, Barr FE, Gregory DF, Wright L, Patel NR. Computer-ized physician order entry and medication errors in a pediatric critical care unit. Pediatrics. 2004;113:59---63.
12. Williams DJ. Medication errors. J R Coll Physicians Edinb. 2007;37:343---6.
13. Stroup DF, Berlin JA, Morton SC, Olkin I, Williamson GD, Rennie D, et al., Meta-analysis Of Observational Studies in Epidemiology (MOOSE) group. Meta-analysis of observational studies in epidemiology: a proposal for reporting. JAMA. 2000;283:2008---12.
14. Janda S, Park K, FitzGerald JM, Etminan M, Swiston J. Statins in COPD: a systematic review. Chest. 2009;136:734---43. 15. Jadad AR, Moore RA, Carroll D, Jenkinson C, Reynolds DJ,
Gavaghan DJ, et al. Assessing the quality of reports of ran-domized clinical trials: is blinding necessary? Control Clin Trials. 1996;17:1---12.
16. Prot S, Fontan JE, Alberti C, Bourdon O, Farnoux C, Macher MA, et al. Drug administration errors and their determinants in pediatric in-patients. Int J Qual Health Care. 2005;17: 381---9.
17. Frey B, Buettiker V, Hug MI, Waldvogel K, Gessler P, Ghelfi D, et al. Does critical incident reporting contribute to medication error prevention? Eur J Pediatr. 2002;161:594---9.
18. Wang JK, Herzog NS, Kaushal R, Park C, Mochizuki C, Weingarten SR. Prevention of pediatric medication errors by hospital phar-macists and the potential benefit of computerized physician order entry. Pediatrics. 2007;119:e77---85.
19. Chua SS, Chua HM, Omar A. Drug administration errors in pae-diatric wards: a direct observation approach. Eur J Pediatr. 2010;169:603---11.
20. Ghaleb MA, Barber N, Franklin BD, Wong IC. The incidence and nature of prescribing and medication administration errors in paediatric inpatients. Arch Dis Child. 2010;95:113---8.
Evaluation of the medication process in pediatric patients 355
22. Kozer E, Scolnik D, Macpherson A, Keays T, Shi K, Luk T, et al. Variables associated with medication errors in pediatric emer-gency medicine. Pediatrics. 2002;110:737---42.
23. King WJ, Paice N, Rangrej J, Forestell GJ, Swartz R. The effect of computerized physician order entry on medication errors and adverse drug events in pediatric inpatients. Pediatrics. 2003;112:506---9.
24. Sard BE, Walsh KE, Doros G, Hannon M, Moschetti W, Bauchner H. Retrospective evaluation of a computerized physician order entry adaptation to prevent prescribing errors in a pediatric emergency department. Pediatrics. 2008;122:782---7.
25. Sangtawesin V, Kanjanapattanakul W, Srisan P, Nawasiri W, Ingchareonsunthorn P. Medication errors at Queen Sirikit National Institute of Child Health. J Med Assoc Thai. 2003;86:S570---5.
26. Taylor BL, Selbst SM, Shah AE. Prescription writing errors in the pediatric emergency department. Pediatr Emerg Care. 2005;21:822---7.
27. Jain S, Basu S, Parmar VR. Medication errors in neonates admit-ted in intensive care unit and emergency department. Indian J Med Sci. 2009;63:145---51.
28. Kadmon G, Bron-Harlev E, Nahum E, Schiller O, Haski G, Shonfeld T. Computerized order entry with limited decision support to prevent prescription errors in a PICU. Pediatrics. 2009;124:935---40.
29. Larose G, Bailey B, Lebel D. Quality of orders for medication in the resuscitation room of a pediatric emergency department. Pediatr Emerg Care. 2008;24:609---14.
30. Rinke ML, Moon M, Clark JS, Mudd S, Miller MR. Prescribing errors in a pediatric emergency department. Pediatr Emerg Care. 2008;24:1---8.
31. Cimino MA, Kirschbaum MS, Brodsky L, Shaha SH. Child Health Accountability Initiative. Assessing medication prescrib-ing errors in pediatric intensive care units. Pediatr Crit Care Med. 2004;5:124---32.
32. Campino A, Lopez-Herrera MC, Lopez-de-Heredia I, Valls-i-Soler A. Educational strategy to reduce medication errors in a neonatal intensive care unit. Acta Paediatr. 2009;98: 782---5.
33. Porter SC, Kaushal R, Forbes PW, Goldmann D, Kalish LA. Impact of a patient-centered technology on medication errors during pediatric emergency care. Ambul Pediatr. 2008;8: 329---35.
34. Otero P, Leyton A, Mariani G, Ceriani Cernadas JM, Patient Safety Committee. Medication errors in pediatric inpatients: prevalence and results of a prevention program. Pediatrics. 2008;122:e737---43.
35. Kozer E, Scolnik D, MacPherson A, Rauchwerger D, Koren G. Using a preprinted order sheet to reduce prescription errors in a pediatric emergency department: a randomized, controlled trial. Pediatrics. 2005;116:1299---302.