Responsiveness of glycogen breakdown
to cyclic AMP in perfused liver from rats
with insulin-induced hypoglycemia
1Departamento de Farmácia e Farmacologia, Universidade Estadual de Maringá,
Maringá, PR, Brasil
2Departamento de Fisiologia e Biofísica, Universidade de São Paulo, São Paulo,
SP, Brasil M. Vardanega-Peicher1,
R. Curi2, S. Pagliarini e Silva1
K.F. Nascimento1
and R.B. Bazotte1
Abstract
The responsiveness of glycogen breakdown to cAMP was investi-gated in isolated perfused liver from male Wistar fed rats (200-220 g) with insulin-induced hypoglycemia. The activation of glycogenolysis by 3 µM cAMP was decreased (P<0.05) in livers from rats with hypoglycemia induced by the administration of insulin or during the direct infusion of insulin into the isolated liver. The direct effect of insulin on glycogen catabolism promoted by 3 µM cAMP occurred as early as 3 min after starting insulin infusion. In contrast, the cAMP agonists resistant to phosphodiesterases, 8Br-cAMP and 6MB-cAMP, used at the same concentration as cAMP, i.e., 3 µM, did not modify the effect of insulin. The data suggest that the decreased hepatic respon-siveness of glycogen breakdown during insulin-induced hypoglyce-mia is a direct effect of insulin decreasing the intracellular levels of cAMP.
Correspondence
R.B. Bazotte
Departamento de Farmácia e Farmacologia
Universidade Estadual de Maringá 87020-900 Maringá, PR Brasil
Fax: +55-44-263-6231 E-mail: [email protected]
Research supported by CNPq, CAPES and PRONEX (No. 168/97). S. Pagliarini e Silva and K.F. Nascimento are recipients of CNPq fellowships.
Received December 17, 2001 Accepted September 4, 2002
Key words ·Insulin-induced
hypoglycemia ·Cyclic AMP
·Glycogen breakdown
·Liver metabolism
Introduction
During insulin-induced hypoglycemia, hepatic glucose production must increase to match the energy demands of the brain. In the fed state, when liver glycogen stores are present, the hepatic response to insulin-induced hypoglycemia operates primarily through glycogenolysis (1,2) rather than glu-coneogenesis (3). Furthermore, there is con-siderable evidence that during insulin-induced hypoglycemia glucagon and epineph-rine are important counter-regulatory hor-mones involved in the activation of glycogen breakdown (4,5).
Recently we demonstrated (6) that the administration of insulin at pharmacological levels was capable of inhibiting isoprote-renol-induced hepatic glycogen breakdown. Because the activation of hepatic glyco-genolysis promoted by ß-adrenergic agonists is mediated by adenosine-3'-5'-cyclic mono-phosphate (cAMP), we decided to investi-gate the participation of cAMP in this effect (6).
break-down to cAMP during insulin-induced hy-poglycemia. For this purpose, we used in situ perfused liver. This technique has the advantage of determining metabolic rates on the basis of the composition of the perfusate in the intact organ (8,9).
Furthermore, in order to obtain informa-tion about the participainforma-tion of insulin in hepatic responsiveness to cAMP, additional experiments measuring the direct effect of insulin on glycogen catabolism promoted by cAMP and analogues were performed.
Material and Methods
Male Wistar fed rats (200-220 g) were employed. Insulin rats received an intraper-itoneal (ip) injection of 1 IU/kg of Neosulin®
R(regular insulin obtained from Biobrás, Montes Claros, MG, Brazil). Control rats were injected with the same volume of sa-line. One hour after the administration of insulin or saline the rats were anesthetized ip
with 40 mg/kg sodium pentobarbital. After laparotomy, blood was collected from the vena cava for the measurement of glucose (10) and insulin (11). As expected, insulin rats showed increased (P<0.05) insulinemia (436.0 ± 13.2 µIU/ml, N = 23) compared to control rats (47.6 ± 3.8 µIU/ml, N = 23) and decreased (P<0.05) glycemia (42.1 ± 2.0 mg/dl, N = 23) compared to the control group (139 ± 2.4 mg/dl, N = 23). Since hypoglycemia was established 60 min after insulin injection, this period of time was chosen to carry out the first set of experi-ments with isolated perfused livers. Thus, 60 min after the administration of insulin or saline the rats were anesthetized ip with 40 mg/kg sodium pentobarbital. After lapa-rotomy, the livers were perfused as previ-ously described (6,8,9,12).
To determine the effect of cyclic nucleo-tides on glycogen catabolism, cAMP con-centrations capable of producing about 50% (i.e., 3 µM) and 100% (i.e., 15 µM) of
maxi-For N6
,2'-O-dibutyryl-adenosine-3'-5'-cyclic monophosphate (DB-cAMP) the concentra-tions needed for 50 and 100% catabolism were 0.10 and 0.15 µM, respectively (results not shown). Therefore, after a pre-infusion period (10 min) livers from insulin and con-trol rats were perfused for 20 min (10-30 min) with cAMP or DB-cAMP dissolved in the perfusion fluid followed by a post-infu-sion period (20 min) to allow a return to basal levels. Thus, the activation of glucose (10), L-lactate (13) and pyruvate (14) pro-duction was taken to be the difference be-tween the rates of release of these com-pounds during (10-30 min) and before (0-10 min) the infusion of cAMP or DB-cAMP. Glycogen catabolism was calculated to be the sum of glucose plus the half-sum of L-lactate and pyruvate [glucose + 1/2 (L-lac-tate + pyruvate)]. The release of these me-tabolites provides the rate of glycogenolysis because pyruvate oxidation, pentose-mono-phosphate shunt and recycling of pyruvate to glucose are minimal (15). All metabolic meas-urements are expressed as µmol
.
min-1.
g-1.In the second set of experiments the di-rect effect of insulin on the kinetics of the activation of glycogen catabolism promoted by 3 µM cAMP was investigated. Thus, after a pre-infusion period of 10 min, livers from control rats were perfused for 15 min (10-25 min) with 3 µM cAMP, followed by a com-bined infusion of 3 µM cAMP and 500 µIU/ ml insulin for 10 min (25-35 min). The con-centration of insulin used was similar to that obtained for insulin rats 60 min after insulin administration. The effect of insulin on the activation of glycogen catabolism promoted by cAMP was measured as de-scribed above.
phosphate (6MB-cAMP) was investigated. Thus, after a pre-infusion period of 10 min, livers from control rats were perfused for 20 min (10-30 min) with a combined infusion of insulin (500 µIU/ml) and a cyclic nucleo-tide (cAMP, DB-cAMP, 8Br-cAMP or 6MB-cAMP) followed by a post-infusion period of 20 min to allow a return to basal levels. The activation of glycogen catabolism was measured as the difference between the rates of glycogenolysis during (10-30 min) and before (0-10 min) the infusion of the cyclic nucleotides.
The computer program GraphPad Prism (version 2.0) was used to calculate the area under the curve, expressed as µmol/g liver fresh weight. Data were analyzed
statisti-cally by the unpaired Student t-test. A 95% level of confidence (P<0.05) was accepted for all comparisons. Results are reported as means ± SEM.
Results
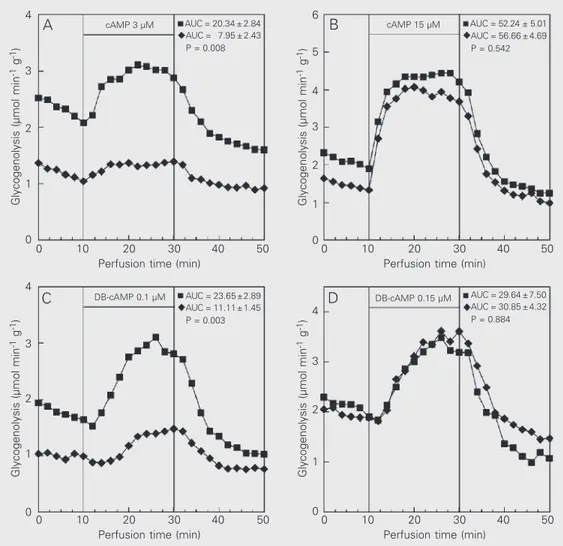
In the first set of experiments the effect of cAMP and DB-cAMP on glycogen catabo-lism in livers from control and insulin rats was compared. As shown in Figure 1, the infusion of cAMP or DB-cAMP promoted a rapid increase in hepatic glycogenolysis. However, the values obtained for cAMP (3 µM) and DB-cAMP (0.10 µM) were lower (P<0.05) in the insulin group (Figure 1A,C). In contrast, the increase of glycogenolysis
Figure 1. Effect of adenosine-3'-5'-cyclic monophosphate (cAMP) (panels A and B) and dibutyryl cAMP (DB-cAMP) (pan-els C and D) on glycogenolysis. The data are reported as the means of 4-6 perfused livers ob-tained from rats killed 60 min after the injection of saline (con-trol, squares) or insulin (1 IU/kg, lozenges). The area under the curve (AUC) data (µmol/g liver fresh weight ± SEM) are pre-sented in the figure. The statisti-cal test used was the unpaired Student t-test.
Glycogenolysis (µmol min
-1 g -1)
4
cAMP 15 µM AUC = 52.24 ± 5.01 AUC = 56.66 ± 4.69 P = 0.542 AUC = 20.34 ± 2.84
AUC = 7.95 ± 2.43 P = 0.008
3
2
1
0
0 10 20 30 40 50
Perfusion time (min)
0 10 20 30 40 50
Perfusion time (min)
0 10 20 30 40 50
Perfusion time (min)
0 10 20 30 40 50
Perfusion time (min)
cAMP 3 µM
AUC = 23.65 ± 2.89 AUC = 11.11 ± 1.45 P = 0.003
DB-cAMP 0.1 µM AUC = 29.64 ± 7.50
AUC = 30.85 ± 4.32 P = 0.884 DB-cAMP 0.15 µM
Glycogenolysis (µmol min
-1 g -1)
4
3
2
1
0
Glycogenolysis (µmol min
-1 g -1)
4
3
2
1
0
Glycogenolysis (µmol min
-1 g -1) 5
4
3
1
0 6
2
A B
promoted by cAMP (15 µM) and DB-cAMP (0.15 µM) in the control and insulin groups was not different (Figure 1B,D).
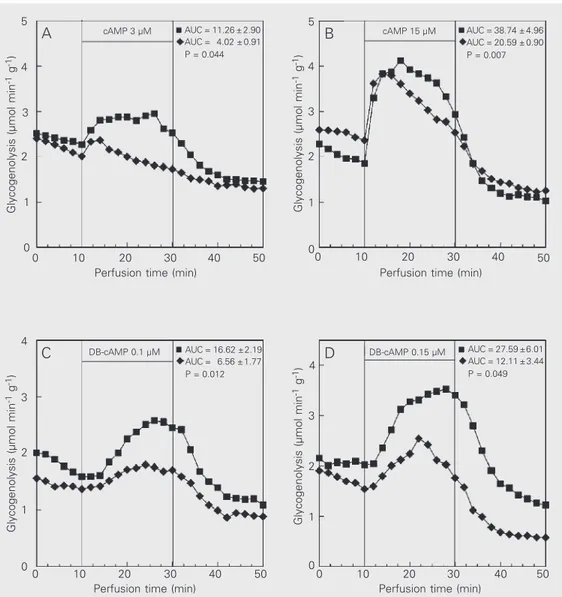
Because insulin showed a direct effect on the activation of glycogen catabolism pro-moted by cAMP (Figure 2), we assessed the effect of insulin perfusion on glycogen ca-tabolism promoted by cAMP and analogues (DB-cAMP, 8Br-cAMP, 6MB-cAMP). As shown in Figure 3, activation of hepatic glycogenolysis with cAMP (3 and 15 µM) and DB-cAMP (0.1 and 0.15 µM) was sig-nificantly reduced (P<0.05) when insulin was present in the perfusion fluid (Figure 3).
Figure 2. Effect of insulin on the activation of glycogenolysis pro-moted by adenosine-3'-5'-cyclic monophosphate (cAMP). The data are reported as the means ± SEM of 4 experiments. The areas under the curve (µmol/g liver fresh weight ± SEM)during the infusion of 3 µM cAMP (10-25 min) and 3 µM cAMP + 500 µIU/ml insulin (25-35 min) were 12.81 ± 2.45 and 4.88 ± 1.51, respectively. The statistical test used was the unpaired Student t-test and the P value obtained was 0.033.
Glycogenolysis (µmol min
-1 g -1)
4
3
2
1
0
10 20 30 40 50 60 70
0
Perfusion time (min)
Figure 3. Effect of adenosine-3'-5'-cyclic monophosphate (cAMP) (panels A and B) and dibutyryl cyclic AMP (DB-cAMP) (panels C and D) on glycogenolysis in the presence (lozenges) and ab-sence (squares) of insulin (500 µIU/ml). The data are reported as the means of 4-6 individual liver perfusion experiments. The area under the curve (AUC) data (µmol/g liver fresh weight ± SEM) are presented in the fig-ure. The statistical test used was the unpaired Student t-test. Glycogenolysis (µmol min
-1 g -1)
5
cAMP 15 µM AUC = 38.74 ± 4.96 AUC = 20.59 ± 0.90 P = 0.007 AUC = 11.26 ± 2.90
AUC = 4.02 ± 0.91 P = 0.044
3
2
1
0
0 10 20 30 40 50
Perfusion time (min)
0 10 20 30 40 50
Perfusion time (min)
0 10 20 30 40 50
Perfusion time (min)
0 10 20 30 40 50
Perfusion time (min)
cAMP 3 µM
AUC = 16.62 ± 2.19 AUC = 6.56 ± 1.77 P = 0.012
DB-cAMP 0.1 µM AUC = 27.59 ± 6.01
AUC = 12.11 ± 3.44 P = 0.049 DB-cAMP 0.15 µM
Glycogenolysis (µmol min
-1 g -1)
4
3
2
1
0
Glycogenolysis (µmol min
-1 g -1) 4
3
2
1
0
Glycogenolysis (µmol min
-1 g -1)
5
4
3
1
0 2 4
A B
C D
cAMP 3 µM
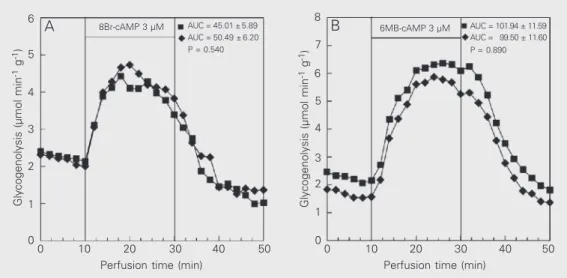
In contrast, the increase of glycogenolysis promoted by 3 µM 8Br-cAMP (Figure 4A) or 3 µM 6MB-cAMP (Figure 4B) was not influenced by the presence of insulin.
Discussion
Hepatic glycogen breakdown in the liver is regulated in an opposite manner by insulin and cAMP-elevating agents. Recent studies from our laboratory have shown decreased responsiveness of glycogen breakdown to isoproterenol in livers from rats with insulin-induced hypoglycemia (6). Because post-receptor mechanisms mediated by cAMP are important to activate hepatic glycogenoly-sis during insulin-induced hypoglycemia, we investigated this second messenger. Thus, by using cAMP and DB-cAMP at levels that produce about 50% of the maximal effect on glycogen catabolism (3 and 0.10 µM, re-spectively), we found a decreased hepatic responsiveness of glycogen catabolism dur-ing insulin-induced hypoglycemia (Figure 1A,C). However, no difference (Figure 1B,D) was observed when the concentrations of cAMP and DB-cAMP which produce the maximal glycogen catabolism were employed (15 and 0.15 µM, respectively).
To overcome the influence of counter-regulatory factors which might have been
released during insulin-induced hypoglyce-mia we examined the direct effect of insulin on hepatic glycogenolysis promoted by cAMP (3 µM). As shown in Figure 2, insulin decreased (P<0.05) the hepatic responsive-ness to cAMP, with the effect occurring as early as 3 min after the beginning of insulin infusion.
Since insulin showed a direct effect on hepatic responsiveness to cAMP we decided to study the direct effect of insulin on glyco-genolysis promoted by cAMP and DB-cAMP at the concentrations used in the first set of experiments. Thus, in contrast to insulin rats, we observed decreased activation of glyco-genolysis (Figure 3) not only with 3 µM cAMP or 0.1 µM DB-cAMP but also with 15 µM cAMP or 0.15 µM DB-cAMP. Thus, the direct effect of insulin was more intense than that observed in the livers from rats with insulin-induced hypoglycemia (Figure 1).
The direct effect of insulin on the activa-tion of glycogen catabolism promoted by 15 µM cAMP or 0.1 µM DB-cAMP can be obtained with 0.3 µM 8Br-cAMP (data not shown). Since 8Br-cAMP is more resistant than cAMP to hydrolysis by phosphodi-esterases, it is possible to overcome the in-fluence of these enzymes by employing higher concentrations of 8Br-cAMP. Therefore, for comparison with the results obtained with 3
Glycogenolysis (µmol min
-1 g -1) 5
6MB-cAMP 3 µM AUC = 101.94 ± 11.59 AUC = 99.50 ± 11.60 P =0.890 AUC = 45.01 ± 5.89
AUC = 50.49 ± 6.20 P = 0.540
3
2
1
0
0 10 20 30 40 50
Perfusion time (min)
0 10 20 30 40 50
Perfusion time (min)
8Br-cAMP 3 µM
Glycogenolysis (µmol min
-1 g -1)
8
7
4
2
0 3 4
A B
6
6
5
1
Figure 4. Effect of 8-bromo-adenosine-3'-5'-cyclic mono-phosphate (8Br-cAMP) (panel A) or N6
µM cAMP we employed 3 µM 8Br-cAMP. In view of the fact that the activation of glycogen catabolism promoted by 3 µM 8Br-cAMP was not influenced by insulin infu-sion (Figure 4A) and considering that this cAMP analogue operates as a protein kinase agonist (16), we may suggest that insulin affects the amount of cAMP in the liver.
Whereas 8Br-cAMP is susceptible to hy-drolysis by phosphodiesterase 3B, 6MB-cAMP is resistant to hydrolysis by this en-zyme due to the covalent modification at the N6
position (17). Thus, using 6MB-cAMP at a concentration which permits comparison with cAMP and 8Br-cAMP (i.e., 3 µM), we observed that the activation of glycogen ca-tabolism promoted by 3 µM 6MB-cAMP was not influenced by insulin infusion (Fig-ure 4B). Consequently, the direct effect of insulin appears to be mediated mainly by the phosphodiesterase present in the liver, i.e., phosphodiesterase 3B.
Recently we reported that the decreased hepatic responsiveness to isoproterenol oc-curred at least 30 min after insulin adminis-tration (1). In contrast, we show here that the direct effect of insulin on hepatic respon-siveness to cAMP occurred as early as 3 min
after the beginning of insulin infusion (Fig-ure 2). Since insulin acutely decreases the activation of glycogenolysis promoted by cAMP, this suggests the activation of phos-phodiesterase 3B (18) and inhibition of adenylate cyclase (19).
Thus, our previous report (1) and the results obtained here suggest that the de-creased hepatic responsiveness to isoprote-renol is mediated not only by the adrenergic desensitization promoted by the release of catecholamines during insulin-induced hy-poglycemia (6,20), but also by a direct effect of insulin decreasing the cellular levels of cAMP. Additionally, we suggest that both mechanisms operated simultaneously in the liver, but that the decreased responsiveness of glycogenolysis mediated by insulin oc-curred prior to the adrenergic desensitiza-tion mediated by catecholamines released during insulin-induced hypoglycemia.
Acknowledgments
The authors are grateful to Mr. Carlos Eduardo de Oliveira and Solidalva Caruso de Oliveira for skillful technical assistance.
References
1. Vardanega-Peicher M, Lopes G, Lima FB, Curi R, Nakano LC & Bazotte RB (2000). Time sequence of changes in the responsive-ness of glycogen breakdown to adrenergic agonists in perfused liver of rats with insulin-induced hypoglycemia. Brazilian Journal of Medi-cal and BiologiMedi-cal Research, 33: 805-813.
2. Moore MC, Connolly CC & Cherrington AD (1998). Autoregulation of hepatic glucose production. European Journal of Endocrinology, 138: 40-48.
3. Souza HM, Borba-Murad GR, Ceddia RB, Curi R, Vardanega-Peicher M & Bazotte RB (2001). Rat liver responsiveness to gluconeogenic substrates during insulin-induced hypoglycemia. Brazilian Journal of Medical and Biological Research, 34: 771-777.
4. Jackson PA, Cardin S, Coffey CS, Neal DW, Allen EJ, Penaloza AR, Snead WL & Cherrington AD (2000). Effect of hepatic denervation on the counterregulatory response to insulin-induced hypoglycemia in the dog. American Journal of Physiology, 279: E1249-E1257. 5. Heptulla RA, Tamborlane WV, Ma TY, Rife F & Sherwin RS (2001).
Oral glucose augments the counterregulatory hormone response
Endocrinology and Metabolism, 86: 645-648.
6. Lopes G, Lima FB, Hell NS, Vardanega M & Bazotte RB (1998). The responsiveness of glycogen catabolism to adrenergic agonists dur-ing insulin-induced hypoglycemia (IIH) in rat livers. General Pharma-cology, 30: 593-599.
7. Vicentini GE, Constantin J, Lopez CE & Bracht A (2000). Transport of cyclic AMP and synthetic analogs in the perfused rat liver. Biochemi-cal Pharmacology, 59: 1187-1201.
8. Bazotte RB, Constantin J, Curi R, Kemmelmeier FS, Hell NS & Bracht A (1989). The sensitivity of glycogenolysis to glucagon, epi-nephrine and cyanide in livers from rats in different metabolic condi-tions. Research Communications in Chemical Pathology and Phar-macology, 64: 193-205.
9. Bazotte RB, Pereira B, Highan S, Shoshan-Barmatz V & Kraus-Friedmann N (1991). Effects of ryanodine on calcium sequestration in the rat liver. Biochemical Pharmacology, 42: 1799-1803. 10. Bergmeyer HU & Bernt E (1974). Determination of glucose with
Meth-USA, 1205-1215.
11. Desbuquois B & Aurbach GD (1971). Use of polyethyleneglycol to separate free and antibody-bound peptide hormones in radioimmu-noassays. Journal of Clinical Endocrinology, 33: 732-738.
12. Ceddia RB, Lopes G, Souza HM, Borba-Murad GR, William Jr WN, Bazotte RB & Curi R (1999). Acute effects of leptin on glucose metabolism of in situ rat perfused livers and isolated hepatocytes. International Journal of Obesity, 23: 1207-1212.
13. Czok R & Lamprecht W (1974). Pyruvate, phosphoenolpyruvate and D-glycerate-2-phosphate. In: Bergmeyer HU (Editor), Methods of Enzymatic Analysis. Vol. 2. Academic Press, New York, NY, USA, 1446-1448.
14. Gutmann I & Wahlefeld W (1974). L-(+)-Lactate. Determination with lactate dehydrogenase and NAD. In: Bergmeyer HU (Editor), Meth-ods of Enzymatic Analysis. Vol. 2. Academic Press, New York, NY, USA, 1464-1472.
15. Kimmig R, Mauch TJ, Kerzl W, Schwabe U & Scholz R (1983). Actions of glucagon on flux rates in perfused rat liver. 1. Kinetics of the inhibitory effect on glycolysis and the stimulatory effect on glycogenolysis. European Journal of Biochemistry, 136: 609-616.
16. Zhao AZ, Shinohara MM, Huang D, Shimizu M, Eldar-Finkelman H, Krebs EG, Beavo JA & Bornfeldt KE (2000). Leptin induces insulin-like signaling that antagonizes cAMP elevation by glucagon in hepa-tocytes. Journal of Biological Chemistry, 15: 11348-11354. 17. Hermsdorf T & Dettmer D (1998). Combined effects of insulin and
dexamethasone on cyclic AMP phosphodiesterase 3 and glycogen metabolism in cultured rat hepatocytes. Cellular Signalling, 10: 629-635.
18. Kitamura T, Kitamura Y, Kuroda S, Hino Y, Ando M, Kotani K, Konishi H, Matsuzaki H, Kikkawa U, Ogawa W & Kasuga M (1999). Insulin-induced phosphorylation and activation of cyclic nucleotide phos-phodiesterase 3B by the serine-threonine kinase Akt. Molecular and Cellular Biology, 19: 6286-6296.
19. Irvine F, Wallace AV, Sarawak SR & Houslay MD (1993). Extracellular calcium modulates insulin’s action on enzymes controlling cyclic AMP metabolism in intact hepatocytes. Biochemical Journal, 264: 249-253.