Rat live r re spo nsive ne ss to
gluco ne o ge nic substrate s during
insulin-induce d hypo glyce m ia
1Departamento de Ciências Fisiológicas,
Universidade Estadual de Londrina, Londrina, PR, Brasil
2Departamento de Educação Física,
Universidade Federal Fluminense, Niterói, RJ, Brasil
3Departamento de Fisiologia e Biofísica,
Universidade de São Paulo, São Paulo, SP, Brasil
4Departamento de Farmácia e Farmacologia,
Universidade Estadual de Maringá, Maringá, PR, Brasil H.M. de Souza1,
G.R. Borba-Murad1,
R.B. Ceddia2, R. Curi3,
M. Vardanega-Peicher4
and R.B. Bazotte4
Abstract
Hepatic responsiveness to gluconeogenic substrates during insulin-induced hypoglycemia was investigated. For this purpose, livers were perfused with a saturating concentration of 2 mM glycerol, 5 mM L-alanine or 5 mM L-glutamine as gluconeogenic substrates. All experi-ments were performed 1 h after an ip injection of saline (CN group) or 1 IU/kg of insulin (IN group). The IN group showed higher (P<0.05) hepatic glucose production from glycerol, L-alanine and L-glutamine and higher (P<0.05) production of L-lactate, pyruvate and urea from L-alanine and L-glutamine. In addition, ip injection of 100 mg/kg glycerol, L-alanine and L-glutamine promoted glucose recovery. The results indicate that the hepatic capacity to produce glucose from gluconeogenic precursors was increased during insulin-induced hy-poglycemia.
Co rre spo nde nce R.B. Bazotte
Departamento de Farmácia e Farmacologia, UEM 87020-900 Maringá, PR Brasil
Fax: + 55-44-263-6231 E-mail: rbbazotte@ uem.br
Research supported by PRO NEX (No. 168/97), CNPq and CAPES. Publication supported by FAPESP.
Received O ctober 4, 2000 Accepted March 20, 2001
Ke y wo rds
·Insulin-induced hypoglycemia
·Hepatic glucose production
·Gluconeogenesis
·Alanine
·Glutamine
Intro ductio n
Although insulin inhibits key enzymes of gluconeogenesis (1) and the mobilization of gluconeogenic substrates to the liver (2-5), it is well established that insulin-induced hy-poglycemia (IIH) provokes the release of hormones (6-11), which stimulate hepatic gluconeogenesis (11-16).
Although the participation of hepatic glu-coneogenesis in glucose recovery has been extensively investigated, relatively little is known about the hepatic responsiveness to gluconeogenic substrates during IIH. Thus, it is not clear whether the higher hepatic
variability of blood glucose precursors (22-25).
Moreover, if the hepatic responsiveness to gluconeogenic substrates is augmented during IIH, the possibility of obtaining cose recovery by the administration of glu-cose precursors should be considered. For this reason, we also investigated the effect of the administration of gluconeogenic precur-sors on glycemia during IIH.
Mate rial and Me tho ds
Male Wistar rats weighing 200 g, aged around 7 weeks and submitted to 6 h of food deprivation were employed.
All experiments were initiated at 2:00 pm to minimize circadian variations. At that time, 1 IU/kg of regular insulin (hypoglycemic rats, IN group) or saline (control rats, CN group) was administered intraperitoneally (ip). Since hypoglycemia has been demon-strated to occur 1 h after insulin administra-tion (23-25), this time was selected for all experiments.
Isolated perfused livers were used as de-scribed previously (24,25). The major ad-vantage of using an isolated organ such as the liver is that the effects measured are attributable directly to the liver and no extra-hepatic influence interferes with the results. Even though some techniques remove the liver from the animal, we prefer to leave it in situ. An advantage of leaving the liver in situ is the continuous secretion of bile into the intestine.
Thus, 1 h after the administration of insu-lin (Neosuinsu-lin®
, Biobrás, Montes Claros, MG, Brazil) or saline, all rats were anesthetized ip with pentobarbital sodium (40 mg/kg). After laparotomy, blood was collected from the vena cava for the measurement of glucose (26), glycerol (27), alanine (28) and L-glutamine (29).
After blood collection, the livers were perfused in situ through the portal vein. Since a proper supply of oxygen is crucial, the
liver received a perfusion fluid saturated with oxygen (95% O2/5% CO2) at a high
flow rate (4 ml/g). The viability of the liver during the perfusion was indicated by the absence of any leaking and/or tissue swell-ing.
To evaluate the maximal capacity of the liver to produce glucose, L-lactate, pyruvate and urea from saturating concentrations of 2 mM glycerol, 5 mM alanine or 5 mM L-glutamine, each substrate was infused be-tween the 10th and 30th min of the perfusion period, followed by a period of post-infusion (20 min) to allow the return to basal levels. Samples of the effluent perfusion fluid were collected at 2-min intervals for a total collec-tion period of 30 min and analyzed for D-glucose, L-lactate, pyruvate and urea. Thus, the maximal hepatic capacity to pro-duce glucose, L-lactate, pyruvate and urea was measured as the difference between the rates of these products released during (10-30 min) and before (0-10 min) substrate infusion. The differences permitted us to obtain and compare the areas under the curves (AUC) for control and hypoglycemic rats.
D-glucose was measured by the glucose-oxidase method (26). L-Lactate (30) is oxi-dized to pyruvate by nicotinamide adenine dinucleotide (NAD) in the enzymatic reac-tion catalyzed by lactate dehydrogenase (LDH). The reduction of NAD is propor-tional to the substrate converted and is meas-ured spectrophotometrically at 340 nm. Simi-larly, pyruvate (31) is reduced to L-lactate by NADH in the enzymatic reaction catalyzed by LDH. The oxidation of NADH is propor-tional to the substrate converted and is meas-ured spectrophotometrically at 340 nm. Ad-ditionally, urea (32) was measured using urease. The ammoniaresulting from enzy-matic hydrolysis of urea reacts with phenol and hypochlorite, producing the blue dye indophenol, which is proportional to urea concentration.
adminis-tration of gluconeogenic substrates on glu-cose recovery, 100 mg/kg glycerol, 100 mg/ kg L-alanine or 100 mg/kg L-glutamine was injected ip 30 min after insulin administra-tion. In these experiments two control groups which received saline or glucose (100 mg/ kg) were employed. Glycemia was meas-ured in blood samples collected by decapita-tion 30 min later, i.e., 60 min after insulin injection.
The computer program GraphPad Prism (version 2.0) was used to calculate the AUC, expressed as µmol/g. Statistical analyses were performed using the unpaired Student t-test and the Primer Biostatistics program. A 95% level of confidence (P<0.05) was accepted for all comparisons. Results are reported as means ± SEM.
Re sults
Insulin administration decreased (P<0.05) the blood concentration of glucose and glyc-erol. However, blood levels of L-alanine and L-glutamine were similar to those observed in the control animals (Table 1).
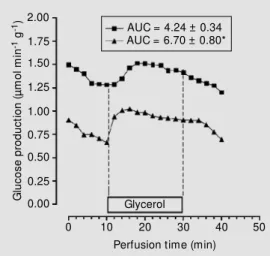
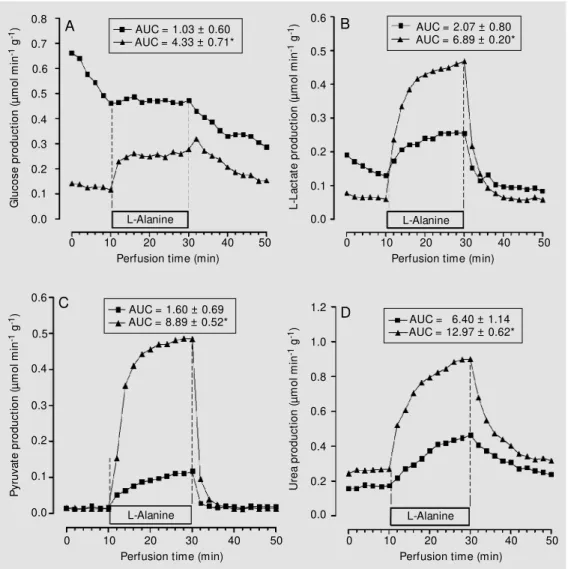
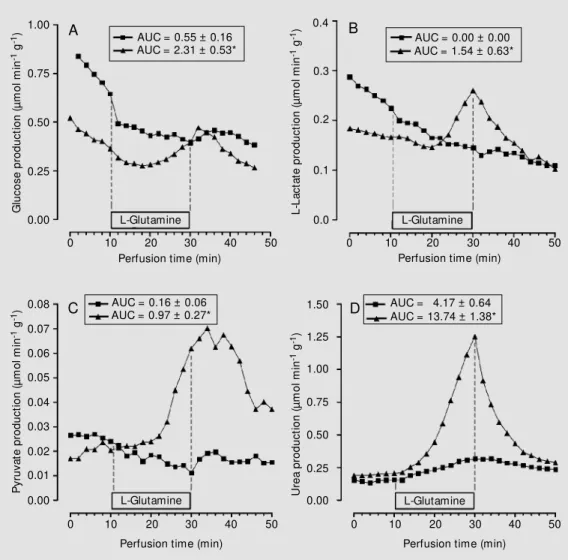
The maximal hepatic capacity to produce glucose was first evaluated for glycerol. As shown in Figure 1, the infusion of a saturat-ing concentration of glycerol promoted a rapid increase in hepatic glucose production for both animal groups (IN and CN). The AUC values calculated by subtracting the basal rates indicated a more intense (P<0.05) activation of glucose production by glycerol for the IN group. Similarly, livers from the IN group showed higher (P<0.05) produc-tion of glucose, L-lactate, pyruvate and urea during the infusion of L-alanine (Figure 2) and L-glutamine (Figure 3) than the CN group.
Moreover, the effect of ip administration of 100 mg/kg glycerol, 100 mg/kg L-alanine or 100 mg/kg L-glutamine on glycemia dur-ing IIH was investigated. As shown in Figure 4, rats which received an ip injection of glycerol, L-alanine or L-glutamine had higher
glycemia (P<0.05) than rats which received saline or glucose.
D iscussio n
Perfused livers from fasted rats produce negligible amounts of glucose in the absence of gluconeogenic precursors. The addition of glycerol, L-alanine or L-glutamine in-creases the rate of glucose production in proportion to the amount of the glucose pre-cursor until a saturating concentration is reached (data not shown). Thus, by using a saturating concentration of gluconeogenic precursors it was possible to measure the maximal capacity of the liver to produce glucose from specific substrates (24,25).
On the other hand, the most common substrates for gluconeogenesis, such as L-lactate and L-alanine, cross the liver cell
Table 1. Blood levels of glucose, glycerol, L-ala-nine and L-glutamine (in mM ) 60 min after saline (CN group) or insulin (IN group) administration.
CN IN
Glucose 6.95 ± 0.320 2.82 ± 0.26* Glycerol 0.057 ± 0.003 0.045 ± 0.002* L-Alanine 0.19 ± 0.01 0.21 ± 0.01 L-Glutamine 0.90 ± 0.04 1.05 ± 0.05
Data are reported as means ± SEM (N = 10). * P<0.05 vs CN group (unpaired Student t-test).
G
lu
c
o
s
e
p
ro
d
u
c
ti
o
n
(
µ
m
o
l
m
in
-1 g
-1) 2.00 AUC = 4.24 ± 0.34
AUC = 6.70 ± 0.80* 1.75
1.50
1.25
1.00
0.75
0.50
0.25
0.00
0 10 20 30 40 50
Perfusion time (min) Glycerol
Figure 1. Effect of glycerol (2 mM ) on glucose production in rats w hich received saline (CN group, squares) or 1 IU/kg of regular insulin (IN group, tri-angles). Data are reported as the mean of 5 individual liver perfu-sion experim ents. The livers w ere perfused as described in M aterial and M ethods. AUC = area under the curve. * P<0.05
membrane and are then converted to pyru-vate. From the cytosol, pyruvate enters the mitochondria where it is carboxylated and then leaves the mitochondria as aspartate or malate. In the cytosol these compounds are converted to oxaloacetate, then to phospho-enolpyruvate and after various steps they are converted to glucose by microsomal glu-cose-6-phosphatase and released from the hepatocyte. Since this complex pathway de-pends on oxygen supply and several cellular compartments (plasma membrane, cytosol, mitochondria and microsomal fraction), the production of glucose, L-lactate and pyru-vate from L-alanine can be used as a marker of the integrity of this metabolic pathway. An absence of glucose production and/or a
high L-lactate/pyruvate ratio indicate low viability and/or poor oxygenation. Thus, L-alanine works as a good marker of the qual-ity of the organ preparation.
Therefore, by using a saturating concen-tration of 2 mM glycerol, 5 mM L-alanine or 5 mM L-glutamine we obtained data com-patible with the view that the ability of the liver to produce glucose increases during IIH. This conclusion is based on the observa-tion that livers from hypoglycemic rats show higher glucose production from glycerol (Fig-ure 1), L-alanine (Fig(Fig-ure 2A) and L-gluta-mine (Figure 3A). Part of these results can be explained by the fact that there is an in-creased release of counterregulatory hor-mones during IIH (6-10) which antagonize
G
lu
c
o
s
e
p
ro
d
u
c
ti
o
n
(
µ
m
o
l
m
in
-1 g -1)
0.7
0.6
0.5
0.4
0.3
0.2
0.1
0.0 0.8
L
-L
a
c
ta
te
p
ro
d
u
c
ti
o
n
(
µ
m
o
l
m
in
-1 g -1)
0.6
0.5
0.4
0.3
0.2
0.1
0.0
P
y
ru
v
a
te
p
ro
d
u
c
ti
o
n
(
µ
m
o
l
m
in
-1 g -1)
0.6
0.5
0.4
0.3
0.2
0.1
0.0
U
re
a
p
ro
d
u
c
ti
o
n
(
µ
m
o
l
m
in
-1 g -1)
1.0
0.8
0.6
0.4
0.2
0.0 1.2
0 10 20 30 40 50
Perfusion time (min) L-Alanine
0 10 20 30 40 50
Perfusion time (min)
0 10 20 30 40 50
Perfusion time (min)
0 10 20 30 40 50
Perfusion time (min)
L-Alanine
L-Alanine L-Alanine
AUC = 1.03 ± 0.60 AUC = 4.33 ± 0.71*
AUC = 2.07 ± 0.80 AUC = 6.89 ± 0.20*
AUC = 6.40 ± 1.14 AUC = 12.97 ± 0.62* AUC = 1.60 ± 0.69
AUC = 8.89 ± 0.52*
A
C
D B
Figure 2. Effect of L-alanine (5 mM ) on glucose (panel A), L-lac-tate (panel B), pyruvate (panel C) and urea production (panel D) in rats w hich received saline (CN group, squares) or 1 IU/kg of regular insulin (IN group, tri-angles). Data are reported as the mean of 4 individual liver perfu-sion experim ent s. The livers w ere perfused as described in M aterial and M ethods. AUC = area under the curve. * P<0.05
the effects of insulin on the gluconeogenesis key enzymes (1,33), i.e., pyruvate kinase and phosphoenolpyruvate carboxykinase. However, the participation of these enzymes is not the whole story since substrates that enter the gluconeogenic pathway at the tri-ose phosphate step (glycerol) were similarly affected by IIH.
The higher hepatic glucose production from L-alanine exhibited by the IN group was probably the result of the increased catabolism of this amino acid, inferred by the higher (P<0.05) urea production (Figure 2D) which favored the generation of gluco-neogenic intermediaries in the liver. In agree-ment with this observation, the IN group showed higher (P<0.05) hepatic production
of L-lactate (Figure 2B) and pyruvate (Fig-ure 2C) during L-alanine infusion. Conse-quently, the increased availability of L-lac-tate and pyruvate in the hepatocyte favored gluconeogenesis (34,35) and helped to ex-plain the higher hepatic glucose production showed by the IN group during the L-alanine infusion (Figure 2A).
Livers from the IN group also showed higher (P<0.05) hepatic production of L-lactate, pyruvate and urea from L-glutamine (Figure 3). The higher production of urea (Figure 3D, P<0.05) was probably due to the increased catabolism of L-glutamine, which contributed to the higher capacity of glucose production. On the other hand, since glu-tamine is not a precursor of pyruvate or
L-Figure 3. Effect of L-glutamine (5 mM ) on glucose (panel A), L-lactate (panel B), pyruvate (panel C) and urea production (panel D) in rats w hich received saline (CN group, squares) or 1 IU/kg of regular insulin (IN group, tri-angles). Data are reported as the mean of 4 individual liver perfu-sion experim ent s. The livers w ere perfused as described in M aterial and M ethods. AUC = area under the curve. * P<0.05
vs saline (unpaired Student t -test).
G
lu
c
o
s
e
p
ro
d
u
c
ti
o
n
(
µ
m
o
l
m
in
-1 g -1)
0.75
0.50
0.25
0.00 1.00
L
-L
a
c
ta
te
p
ro
d
u
c
ti
o
n
(
µ
m
o
l
m
in
-1 g -1)
0.4
0.3
0.2
0.1
0.0
P
y
ru
v
a
te
p
ro
d
u
c
ti
o
n
(
µ
m
o
l
m
in
-1 g -1)
0.08
0.07
0.06
0.05
0.04
0.01
0.00 U
re
a
p
ro
d
u
c
ti
o
n
(
µ
m
o
l
m
in
-1 g -1) 1.25
1.00
0.75
0.50
0.25
0.00 1.50
0 10 20 30 40 50
Perfusion time (min) L-Glutamine
0 10 20 30 40 50
Perfusion time (min)
0 10 20 30 40 50
Perfusion time (min)
0 10 20 30 40 50
Perfusion time (min)
L-Glutamine
L-Glutamine L-Glutamine
AUC = 0.55 ± 0.16 AUC = 2.31 ± 0.53*
AUC = 0.00 ± 0.00 AUC = 1.54 ± 0.63*
AUC = 4.17 ± 0.64 AUC = 13.74 ± 1.38* AUC = 0.16 ± 0.06
AUC = 0.97 ± 0.27*
A
C D
B
0.03
lactate directly and because the kinetics and magnitude of L-lactate and pyruvate tion followed the kinetics of glucose produc-tion (Figure 3A), it is possible that the pyru-vate and L-lactate produced during L-gluta-mine infusion came from glycolysis. In addi-tion, we observed a delay in the conversion of L-glutamine to glucose, pyruvate, L-lac-tate and urea (Figure 3), an effect that may be attributed to the slow activation of hepatic glutaminase (36,37).
Since during IIH, blood glucose precur-sors investigated were decreased or main-tained (Table 1) and the hepatic capacity to
produce glucose from these substrates was increased (Figures 1, 2, and 3), we deter-mined whether the ip injection of these pre-cursors (glycerol, L-alanine and L-glutamine, each 100 mg/kg) could promote glucose re-covery.
As illustrated in Figure 4, rats that re-ceived glycerol, L-alanine or L-glutamine 30 min after insulin administration showed higher (P<0.05) glycemia than the controls. Moreover, the absence of glycemia recovery during glucose administration, in contrast to gluconeogenic substrate injection, was un-expected.
Thus, we conclude that the administra-tion of gluconeogenic precursors during IIH promoted glucose recovery due to the in-creased hepatic responsiveness to gluconeo-genic substrates. Finally, our previous re-sults (24,25), taken together with those of the present study, suggest the possibility of the administration of glucose precursors for the treatment of IIH, particularly in condi-tions in which therapy with glucagon is not effective. G ly c e m ia ( m g /d l) 100 123456 123456 123456 123456 123456 123456 123456 123456 123456 123456 123456 123456 123456 123456 123456 123456 123456 123456 123456 123456 123456 123456 123456 123456 123456 123456 123456 123456 123456 123456 123456 123456 123456 123456 123456 123456 123456 123456 123456 123456 123456 123456 123456 123456 123456 123456 123456 123456 123456 123456 123456 123456 123456 123456 123456 123456 123456 123456 123456 123456 12345 12345 12345 12345 12345 12345 12345 12345 12345 12345 12345 12345 12345 12345 12345 12345 12345 12345 12345 12345 12345 12345 12345 12345 12345 12345 123456 123456 123456 123456 123456 123456 123456 123456 123456 123456 123456 123456 123456 123456 123456 123456 123456 123456 123456 123456 123456 123456 123456 80 60 40 20 0
C Gl G A Gt
Re fe re nce s
1. Pilks SJ & Granner DK (1992). M olecular physiology of the regulation of hepatic gluconeogenesis and glycolysis. Annual Review of Physiology, 54: 885-909. 2. Nurjhan N, Campbell PJ, Kennedy FP,
M iles JM & Gerich JE (1986). Insulin dose-response characteristics for suppression of glycerol release and conversion to glu-cose in humans. Diabetes,35: 1326-1331. 3. Freyse EJ, Fischer U, Albrecht G, M arx S & Keilacker H (1987). The effect of pre-hepatic insulin administration on alanine flux rates in diabetic dogs. Diabetologia, 30: 402-408.
4. Lew is GF, Zinman B, Groenew oud Y, Vranic M & Giacca A (1996). Hepatic glu-cose production is regulated both by di-rect hepatic and extrahepatic effects of insulin in humans. Diabetes, 45: 454-462. 5. Sindelar DK, Chu CA, Rohlie M , Neal DW, Sw ift LL & Cherrington AD (1997). The role of fatty acids in mediating the effects of peripheral insulin on hepatic glucose
production in the conscious dog. Diabe-tes, 46: 187-196.
6. Rizza RA, Cryer PE & Gerich JE (1979). Role of glucagon, catecholamines, and grow t h horm one in hum an glucose counterregulation. Effects of somatosta-tin and combined alfa- and beta-adrener-gic blockade on plasma glucose recovery and glucose flux rates after insulin-in-duced hypoglycemia. Journal of Clinical Investigation, 64: 62-71.
7. Fanelli CG, De Feo P, Porcellat IF, Perriello G, Torlone E, Santeusanio F, Brunetti P & Bolli GB (1992). Adrenergic mechanisms contribute to the late phase of hypoglyce-mic glucose counterregulation in humans by stimulating lipolysis. Journal of Clinical Investigation,89: 2005-2013.
8. Nair KS, Welle SL & Tito J (1990). Effect of plasma amino acid replacement on glu-cagon and substrate responses to insulin-induced hypoglycemia in humans. Diabe-tes, 39: 376-382.
9. Davis SN, Dobbins R, Tarumi C, Jacobs J, Neal D & Cherrington AD (1995). Para-doxal insulin-induced increase in gluco-neogenesis in response to prolonged hy-poglycemia in conscious dogs. American Journal of Physiology, 268 (Part 1): E521-E531.
10. Lew is GF, Carpentier A, Bilinski D, Giacca A & Vranic M (1999). Counterregulatory response to hypoglycemia differs accord-ing to the insulin delivery route, but does not affect glucose production in normal humans. Journal of Clinical Endocrinology and M etabolism, 84: 1037-1046. 11. Caprio S, Saccà L, Tamborlane WV &
Sherw in RS (1988). Relationship betw een changes in glucose production and gluco-neogenesis during mild hypoglycemia in humans. M etabolism, 37: 707-710. 12. Frizzell RT, Hendrick GK, Biggers DW,
Lacy DB, Donahue DP, Green DR, Carr RK, Williams PE, Stevenson RW & Cher-rington AD (1988). Role of gluconeogene-Figure 4. Effect of saline (C),
glu-cose (Gl), glycerol (G), L-alanine (A) and L-glutamine (Gt) on gly-cemia. All substances (100 mg/ kg, ip) w ere administered 30 min after insulin injection and glyce-mia w as measured 60 min after insulin administration. Data are reported as means ± SEM of 7-9 rats. * P<0.05 vs C group (un-paired Student t-test).
* *
sis in sustaining glucose production dur-ing hypoglycemia caused by continuous insulin infusion in conscious dogs. Diabe-tes, 37: 749-759.
13. Lecavalier L, Bolli G, Cryer P & Gerich J (1989). Contributions of gluconeogenesis and glycogenolysis during glucose count erregulat ion in norm al hum ans.
American Journal of Physiology, 256: E844-E851.
14. Garber AJ, Cryer PE, Santiago JV, Hay-mond M W, Pagliara A & Kipnis DM (1976). The role of adrenergic mechanisms in the substrate and hormonal response to insu-lin-induced hypoglycemia in man. Journal of Clinical Investigation, 58: 7-15. 15. Clarke WL, Santiago JV, Thomas L,
Ben-Galim E, Haymond M W & Cryer PE (1979). Adrenergic mechanisms in recovery from hypoglycemia in man: adrenergic block-ade. American Journal of Physiology, 236: E147-E152.
16. Cryer P (1993). Glucose counterregula-tion: prevention and correction of hypogly-cemia in humans. American Journal of Physiology, 264: E149-E155.
17. Hourani H, Lacy B, Eltayeb K & Abumrad NN (1992). The role of central nervous system in modulating glucose and protein metabolism during insulin-induced hy-poglycemia. Brain Research, 587: 276-284.
18. Fanelli C, Calderone S, Epifano L, De Vincenzo A, M odarelli F, Pampanelli S, Perriello G, De Feo P, Brunetti P, Gerich JE & Bolli GB (1993). Demonstration of a critical role for free fatty acids in mediat-ing counterregulatory stimulation of glu-coneogenesis and suppression of glucose utilization in humans. Journal of Clinical Investigation,92: 1617-1622.
19. De Feo P, Perriello G, Torlone E, Ventura M M , Fanelli C, Santeusanio F, Brunetti P, Gerich JE & Bolli GB (1989). Contribution of cortisol to glucose counterregulation in humans. American Journal of Physiology, 257: E35-E42.
20. De Feo P, Perriello G, De Cosmo S, Ventura M M , Campbell PJ, Brunetti P, Gerich JE & Bolli GB (1986). Comparison of glucose counterregulation during
short-term and prolonged hypoglycemia in nor-mal humans. Diabetes, 35: 563-569. 21. De Feo P, Perriello G, Santeusanio F,
Brunetti P, Bolli G & Haymond M N (1992). Differential effects of insulin-induced hy-poglycemia on plasma branched-chain and non-branched-chain amino acid con-centration in humans. Diabetes and M e-tabolism, 18: 277-282.
22. Ceddia RB, Lopes G, Souza HM , Borba-M urad GR, William Jr WN, Bazotte RB & Curi R (1999). Acute effects of leptin on glucose metabolism of in situ rat perfused livers and isolated hepatocytes. Interna-tional Journal of Obesity, 23: 1207-1212. 23. Souza HM , Hell NS, Lopes G & Bazotte RB (1994). Effect of combined adminis-tration of counterregulatory hormones during insulin-induced hypoglycemia in rats: lipolysis mediated by a ß-adrenergic mechanism contributes to hyperglycemia.
Brazilian Journal of M edical and Biological Research, 27: 2883-2887.
24. Souza HM , Hell NS, Lopes G & Bazotte RB (1996). Synergistic effect of counter-regulatory hormones during insulin-in-duced hypoglycemia in rats: participation of lipolysis and gluconeogenesis to hyper-glycemia. Acta Pharmacologica Sinica, 17: 455-459.
25. Vardanega-Peicher M , Lopes G, Lima FB, Curi R, Nakano LC & Bazotte RB (2000). Time sequence of changes in the respon-siveness of glycogen breakdow n to adre-nergic agonists in perfused livers of rats w ith insulin-induced hypoglycemia. Bra-zilian Journal of M edical and Biological Research,33: 805-813.
26. Bergmeyer HU & Bernt E (1974). Deter-mination of glucose w ith glucose-oxidase and peroxidase. In: Bergmeyer HU (Edi-tor), M ethods of Enzymatic Analysis. Vol. 2. Academic Press, New York, 1205-1215. 27. Wieland O (1974). Glycerol UV-method. In: Bergmeyer HU (Editor), M ethods of Enzymatic Analysis. Vol. 2. Academic Press, New York, 1405-1408.
28. W illiam son DH (1974). Determ ination w ith alanine dehydrogenase. In: Berg-meyer HU (Editor), M ethods of Enzymatic Analysis. Vol. 2. Academic Press, New
York, 1679-1682.
29. Lund P (1974). Determination w ith gluta-minase and glutamate dehydrogenase. In: Bergmeyer HU (Editor), M ethods of Enzy-matic Analysis. Vol. 2. Academic Press, New York, 1719-1722.
30. Gutmann I & Wahlefeld W (1974). L-(+)-Lactate. Determination w ith lactate dehy-drogenase and NAD. In: Bergmeyer HU (Editor), M ethods of Enzymatic Analysis.
Vol. 2. Academic Press, New York, 1464-1472.
31. Czok R & Lamprecht W (1974). Pyruvate, phosphoenolpyruvate and D-glycerate-2-phosphate. In: Bergmeyer HU (Editor),
M ethods of Enzymatic Analysis. Vol. 2. Academic Press, New York, 1446-1448. 32. Gutmann I & Bergmeyer HU (1974).
De-termination of urea, indicator reaction w ith phenol and hypochlorite. In: Berg-meyer HU (Editor), M ethods of Enzymatic Analysis. Vol. 2. Academic Press, New York, 1790-1798.
33. Lager I (1991). The insulin-antagonistic ef-fect of the counterregulatory hormones.
Journal of Internal M edicine, 229: 41-47. 34. Jahoor F, Klein S & Wolfe R (1992). M
ech-anism of regulation of glucose production by lipolysis in humans. American Journal of Physiology, 262: E353-E358. 35. Dekker E, Hellerstein M K, Romijn JA,
Neese RA, Peshu N, Endert E, M arsh K & Sauerw ein HP (1997). Glucose homeosta-sis in children w ith falciparum malaria: precursor supply limits gluconeogenesis and glucose production. Journal of Clini-cal Endocrinology and M etabolism, 82: 2514-2521.
36. Häussinger D, Weiss L & Sies H (1975). Activation of pyruvate dehydrogenase during metabolism of ammonium ions in haemoglobin-free perfused rat liver. Euro-pean Journal of Biochemistry, 52: 421-431.