www.rpped.com.br
REVISTA
PAULISTA
DE
PEDIATRIA
ORIGINAL
ARTICLE
Socioeconomic,
cultural
and
demographic
maternal
factors
associated
with
dietary
patterns
of
infants
Andréa
Marques
Sotero
a,∗,
Poliana
Coelho
Cabral
b,
Giselia
Alves
Pontes
da
Silva
caUniversidadedePernambuco(UPE),Petrolina,PE,Brazil
bDepartamentodeNutric¸ão,UniversidadeFederaldePernambuco(UFPE),Recife,PE,Brazil cPediatria,UniversidadeFederaldePernambuco(UFPE),Recife,PE,Brazil
Received31October2014;accepted17March2015 Availableonline24August2015
KEYWORDS Foodhabits; Foodconsumption; Infant
Abstract
Objective: Toanalyzedietarypatternsofinfantsanditsassociationwithmaternal
socioecono-mic,cultural,anddemographicvariables.
Methods: Across-sectionalstudywasconductedwithtwogroupsofmothersofchildrenupto24
months(n=202)livinginthecityofMaceió,Alagoas,NortheastBrazil.Thecasegroupconsisted
ofmothersenrolledinaFamilyHealthUnit.Thecomparisongroupconsistedofmotherswho tooktheirchildrentotwoprivatepediatricofficesofthecity.Dietaryintakewasassessedusing aqualitativeandvalidatedfoodfrequencyquestionnaire(FFQ).TheevaluationoftheFFQwas performedbyamethodinwhichtheoverallrateofconsumptionfrequencyisconvertedintoa score.
Results: Childrenofhigherincomefamiliesandmotherswithbettereducationlevel(control
group)showedthehighestmedianofconsumptionscoresforfruitsandvegetables(p<0.01)and
meat,offal,andeggs(p<0.01),whencomparedwithchildrenofthecasegroup.Ontheother
hand,themedianofconsumptionscoresofmanufacturedgoodswashigheramongchildrenin thecasegroup(p<0.01).
Conclusions: Maternalsocioeconomicstatusinfluencedthequalityoffoodofferedtotheinfant.
Inthecasegroup,childrenupto24monthsalreadyconsumedindustrialproductsinsteadof healthyfoodsontheirmenu.
©2015SociedadedePediatriadeS˜aoPaulo.PublishedbyElsevierEditoraLtda.Thisisanopen accessarticleundertheCCBY-license(https://creativecommons.org/licenses/by/4.0/).
DOIoforiginalarticle:http://dx.doi.org/10.1016/j.rpped.2015.03.006
∗Correspondingauthor.
E-mail:[email protected](A.M.Sotero).
2359-3482/©2015SociedadedePediatriadeS˜aoPaulo.PublishedbyElsevierEditoraLtda.ThisisanopenaccessarticleundertheCC
PALAVRAS-CHAVE Hábitosalimentares; Consumode
alimentos; Lactente
Fatoressocioeconômicos,culturaisedemográficosmaternosassociadosaopadrão
alimentardelactentes
Resumo
Objetivo: Analisaropadrãodeconsumoalimentardelactentesesuaassociac¸ãocomvariáveis
socioeconômicas,culturaisedemográficasmaternas.
Métodos: Foi realizadoum estudodecortetransversal,envolvendodoisgruposde mãesde
crianc¸asaté24meses(n=202)residentesnacidadedeMaceió-Alagoas.Ogrupocasofoi
con-stituídopormãescadastradasemumaUnidadedeSaúdedaFamília.Ogrupocomparac¸ãofoi constituídodemãesquelevaramseusfilhosparaatendimentoemdoisconsultórios particu-laresdePediatriadacidade.Oconsumoalimentarfoiavaliadoutilizandoumquestionáriode frequênciaalimentar(QFA)qualitativoevalidado.OQFAfoiavaliadopelométodonoqualo cômputogeraldafrequênciadoconsumoéconvertidoemescore.
Resultados: Ascrianc¸ascommaiorrendafamiliaremãescommelhorníveldeescolaridade
(grupo comparac¸ão) apresentaram as maioresmedianasde escores de consumo dos grupos alimentaresdefrutas,legumeseverduras(p<0,01)ecarnes,miúdoseovos(p<0,01),quando comparadasàscrianc¸asdogrupocaso.Poroutrolado,asmedianasdeescoresdeconsumode produtosindustrializadosforammaiselevadasentreascrianc¸asdogrupocaso(p<0,01).
Conclusões: Onívelsocioeconômicomaternoinfluenciounaqualidadedaalimentac¸ãoquefoi
oferecidaaolactente,pois,nogrupocaso,crianc¸asdeaté24mesesjápossuíamnoseucardápio produtosindustrializados,emdetrimentodoconsumodealimentossaudáveis.
©2015SociedadedePediatriadeS˜aoPaulo.PublicadoporElsevierEditoraLtda.Esteéumartigo OpenAccesssobalicençaCCBY(https://creativecommons.org/licenses/by/4.0/deed.pt).
Introduction
Adequatenutritioninthefirst2yearsoflifeisessential,as thisisaperiodcharacterizedbyrapidgrowth,development andformationofeatinghabitsthatmayremainthroughout life.1,2
Exclusive breastfeedingup to6 monthsand, afterthis age,breastfeedingupto2yearsormore,combinedwiththe opportune introduction of balanced complementary foods (CF),areemphasizedbytheWorldHealthOrganization as importantpublichealthmeasures,withaneffectiveimpact on the decreased risk for development of chronic non-communicablediseases(NCDs)suchasobesity,hypertension anddiabetesmellitus.1,3However,studiesperformedinthe
last30yearsshowthatthefrequencyofNCDshasincreased inallBrazilianregions andsocialclasses,especially child-hood obesity, with prevalence rates ranging from 5 to 18%.4
Feedingpractices,inadditiontobeingdeterminantsof healthstatusin children,arestronglyassociatedwiththe purchasing power of families, as they directly influence theavailability,quantityandqualityofconsumedfood.5In
recentyears,therehavebeenchangesintheeatinghabits ofthepopulation, especiallyregardingthesubstitution of homemadeandnaturalfoodsbyprocessedfoods,considered superfluous, with high energy density and low nutritional quality.5,6The advertisingmarket,globalization,therapid
paceof lifeinbigcities andwomen’swork outsideofthe householdhavealsocontributedtothesechanges.7
The identification of dietary patterns of infants is an importantstudy objectinnutritionalepidemiology,aimed to understand one of the factors responsible for health in childhood.8 On the other hand, there is need for
improvement in the means of assessing dietary patterns throughtheuseofnewmethodologies.9
Thus,theuseofthefoodconsumptionfrequencymethod, analyzedthroughscores,maybeausefultoolinthe assess-mentoffoodqualityofferedtotheinfant.Therefore,this studyaimstoanalyzethepatternoffoodintakeofinfants and itsassociation withmaternal socioeconomic, cultural anddemographicvariables.
Method
Across-sectionalstudywascarriedout,involvingtwogroups ofmothersofchildrenagedupto24monthslivinginthecity ofMaceió,stateofAlagoas,Brazil.Thecasegroupconsisted ofmothersenrolledattheCarlaNogueiraFamilyHealthUnit (FHU),locatedinalow-incomeneighborhoodbelongingto the VIHealthDistrict. The comparisongroup consisted of mothers who tooktheir children totwo private pediatric officesofthecity.
Inclusioncriteriawere:mothers ofchildrenagedupto 24 months and who had a working TV set at home, as television hasbecometheculturalfactor thatmore often disseminatesmessagesaboutunhealthyfoods.1The
exclu-sion criteria were: adolescent mothers and, also for the comparisongroup,motherswhohadthedoctor’s consulta-tionfeepaidbyanotherpersonoutsidethefamily.
ReviewBoardofUniversidadeFederaldePernambucoandit wasapprovedonJanuary23,2012,underprotocolnumber 0437.0.172.000-11.
The samplesizewasestimated usingtheEPI-INFO soft-ware, version 3.5. For the sample calculation, it was consideredthat49.0%ofthemothersoflowsocioeconomic statusintroducesuperfluousfoodatanearlyage,basedon thestudybySpinelli,SouzaandSouza,10 and28.0% ofthe
mothers,duetobettersocioeconomicstatus,donot intro-ducethem,assumingarelativeriskof2.5ofnotintroducing superfluous food at an early age for a significance level of95% (1-␣)anda powerequalto80% (1-),witharatio betweenthecase/comparisongroupof1:1.Theestimated valueofthesamplewas92mother---infantbinomialsineach group,adding10%bygrouptocompensateforlosses, result-ing ina sample of 100 binomials in each group.The final samplecomprisedatotalof200mother---infants.
Datacollectionwasperformed in thefirsthalf of2012 by twotrainednutritionists,who interviewedthe biologi-calmothersofchildrenattheFHUandtheprivateoffices. The following data were collected: socioeconomic (fam-ilyincomeinminimumwages,at thetimeR$622.00,later distributedintoquartiles),cultural(behaviorregarding tele-vision),demographic(maternalage,occupation,numberof livebirths,motherliving withpartner,head ofthe house-hold,maternalandheadofthehouseholdeducationallevel) and child health (breastfeeding, complementary feeding andprenatalsupport).Forthisstudy,the‘‘breastfeeding’’ variablewasbasedonthedefinitionadoptedbytheWHO,11
whenthechildreceivesbreastmilkstraightfromthebreast orexpressed,regardlessofthechildreceivingothertypes offoodsornot.
Aimingtostandardizeformcompletion, we prepareda manual with guidelines for the interviewers and variable codification. The toolswere pre-tested withmotherswho attendedtheFHU30daysbeforedatacollectionstarted.
Food intake,the outcomevariable,wasassessed using aqualitativefoodfrequencyquestionnaire(FFQ)validated byColuccietal.,12whichwasadaptedfortheagegroupof
childrenupto24monthsinordertobettermatchthe pro-posedobjectives.TheFFQassessmentwasperformedusing themethodproposedbyFornésetal.,13inwhichtheoverall
rateofconsumptionfrequencyisconvertedintoascore. Thescoresweresetasfollows:
1. FoodswererecordedthroughtheFFQ,consistingof 63 food items and classified into four consumption cate-gories:rare/never,daily,weekly,ormonthly.
2. Fortheconsumptionfrequencyofeachfoodtobe con-sideredasmonthlyconsumption,aweightwasassigned toeachcategoryofconsumptionfrequency.
3. The daily consumption frequency was established as maximum weight value (weight=1). The other weights
were obtained according to the following equation: weight=(1/30)×(a), where a correspond to the
num-ber of days consumption occurred during the month. Whenareferredtotheweeklyconsumption,thenumber wasconvertedtothe monthly consumption frequency, multiplying it by 4, considering that the month has 4 weeks. For example, for a food item eaten 4 times inaweek, themonthly consumptionfrequency was16
timesamonth.Thus,theweightforthefrequencywas: weight=(1/30)×(16)=0.533.
4. After calculating the weight of the consumption fre-quencyofeachitem,theanalyzedfoodswereinserted into six food groups established by the Brazilian Food Guideforchildrenunder2years13:groupIconsistedof
foodsthatwerecarbohydratesources(breadsand cere-als),whichcomprisethepyramidbase;groupIIconsisted of foods that were sources of vitamins, minerals and fiber(fruitsandvegetables);groupIIIconsistedoffoods thatweresourcesofanimalproteinandlegumes(meat, viscera, eggs and beans); group IV consisted of foods thatweresourcesofcalcium(milkanddairyproducts); group V consisted of foods at the top of the pyramid (sugars, sweets, fats and oils), and group VIconsisted ofprocessedfoodsconsideredtobesuperfluous,which, accordingtotheBrazilianFoodGuideforchildrenunder 2 years, should not beoffered to children at this age range,astheyhaveexcessiveamountsoflipidsand/or sugarsorcontainundesirablesubstancesforconsumption bythisagegroup,suchasdyesandchemical preserva-tives(beef broth,industrialized soup, instantnoodles, artificial juice, soda, processedsweets, gelatin, sand-wichcookies, snacks,butterypopcorn,chocolatemilk, candy, sugary breakfastcereals, chocolates, processed babyfood,sausages,hotdogs,hamburgersandsalami).
The consumption frequency scores were calculated by thesumoftheconsumptionfrequencyvaluesforfoods cor-respondingtoeachgroup.The scoreIwasrepresentedby the sum of consumption values of foods that comprised groupI,scoreIIbythesumofconsumptionvaluesoffoods thatcomprised group II, and so on.However, considering thatthefoodgroupsestablishedforthisstudyconsistedof differentnumbersoffood,themeanscoreofeachgroupwas consideredtocharacterizethefoodconsumptionpattern.
The database was entered into the Epi Info software, version 6.04 (CDC/WHO, Atlanta, GA, USA), with double entry,andsubsequentuseofthevalidatemoduletocheck any typos. Forstatistical analysis, we usedthe SPSS ver-sion12.0(SPSSInc.,Chicago,IL,USA).Thechi-squaretest was used to compare the frequencies between case and comparisongroups. Because they arevariables in ordinal scale,thefrequencyscores offoodintakeweredescribed as medians and interquartile range (IQ). The association betweenfoodintakeandexplanatoryvariableswasassessed byMann---WhitneyUtest (two medians)andKruskalWallis (overtwomedians),usingtheMann---WhitneyUtest subse-quently.Ap value<0.05wasusedinthevalidationofthe assessedassociations.
Results
Atotal of 202 mothers were interviewed: 51% (n=103) in
thecasegroup,whohadtheirchildrentreatedattheCarla NogueiraFHU,and49%(n=99)inthecomparisongroup,who
hadtheir children treated at two privateoffices. Table 1
showsthe socioeconomicand demographiccharacteristics ofthestudygroups.
Table1 Socioeconomicanddemographicvariables,accordingtothegroups,Maceio-AL,2012.
Variables Case Comparison Total pa
n % n % n %
Maternalage(years)
≤28 81 78.6 26 26.3 107 53.0 <0.001
>28 22 21.4 73 73.7 95 47.0
Maternaloccupation
Doesnotwork/homemaker 48 46.6 10 10.3 58 28.7 <0.001 Unemployed 38 36.9 15 14.4 53 26.2
Employed 17 16.5 74 75.3 91 45.0
Numberoflivebirths
1 32 31.1 58 58.6 90 44.6 <0.001 2and3 53 51.5 40 40.4 93 46.0
>3 18 17.5 1 1.0 19 9.4
Motherliveswithpartner
Yes 86 83.5 90 90.9 176 87.1 0.08
No 17 16.5 9 9.1 26 12.9
Headofhousehold
Mother 10 9.8 11 11.1 21 10.4 0.77 Father 85 82.4 80 80.8 165 81.7
Grandmother 5 4.9 3 3.0 8 4.0
Other 3 2.9 5 5.1 8 4.0
Maternalschooling(years)
<4 5 4.9 0 0.0 5 2.5 <0.001 4---8 96 93.2 16 16.2 112 55.4
>8 2 1.9 83 83.8 85 42.1
Headofhouseholdschooling(years)
<4 17 16.5 0 0.0 17 8.4 <0.001 4---8 83 80.6 23 23.2 106 52.5
>8 3 2.9 76 76.8 79 39.1
Familypercapitaincome(quartilesofminimumwages)
≤0.20 58 56.3 0 0.0 58 28.7 <0.001
0.20---0.55 42 40.8 3 3.0 45 22.3 0.55---2.71 3 2.9 47 47.5 50 24.8
≥2.71 0 0.0 49 50.5 49 24.3
Childcaregiver
Mother 99 96.1 62 62.6 161 79.7 <0.001 Maid/nanny 0 0.0 27 27.3 27 13.4
Others 4 3.9 10 10.1 14 6.9
aStatisticalsignificanceobtainedbytheChi-squaretest.
mothersandfrequentlyhadmorethanonechildwhen com-pared to mothers from the comparison group, and these differenceswerestatisticallysignificant(p<0.001).
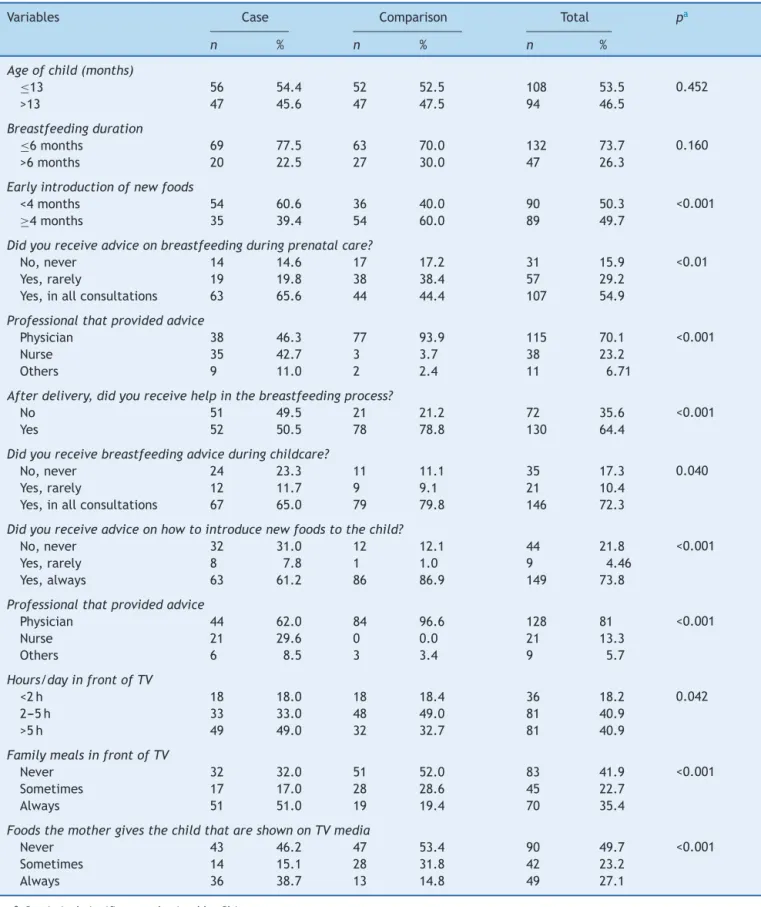
Table 2 shows no difference between the groups regarding the duration of breastfeeding, with approxi-mately 70.0% of children beingbreastfed for ≤6 months.
On theother hand, although thecomparison group moth-ers receivedless advice on breastfeeding duringprenatal care(44.4%×63.0%;p<0.01),afterbirththesemotherswere
the ones whohad more help with thebreastfeeding pro-cess(p<0.001)andhighervolumeofadviceonbreastfeeding
(p=0.04)andtheintroductionofnewfoods(p<0.001),when
comparedtothecasegroupmothers.
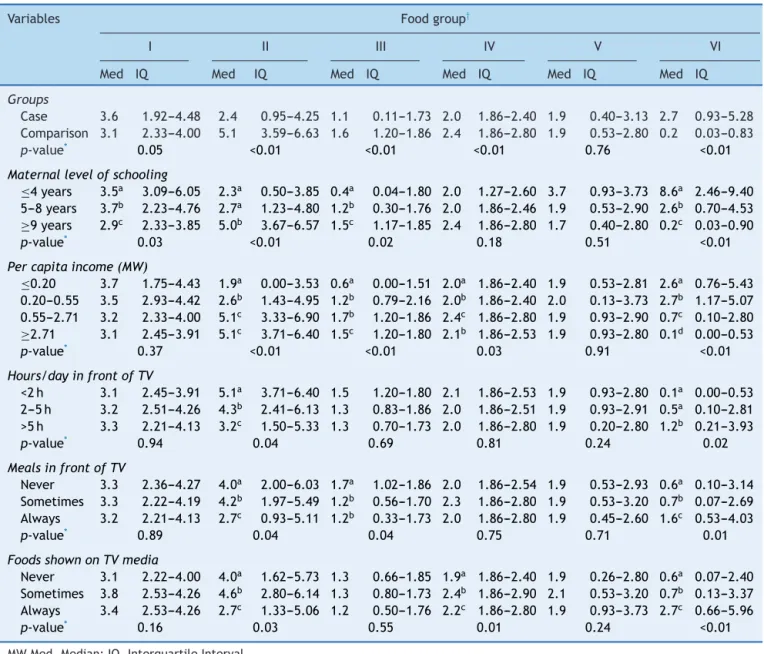
Thechildren’sfoodintakescoresshowninTable3 demon-stratethat thehigher thematernal educationallevel and householdincome,thehighertheconsumptionoffoodsthat belongtogroupsII(fruitsandvegetables)andIII(meat, vis-ceraandeggs).Theconsumptionofprocessedproductswas significantly higherwhenmothers confirmed lower educa-tionallevelsandfamilyincome.
Table2 Behavioralandnutritionaladvicevariablesrelatedtothechildren’shealth,accordingtothecasegroupand compar-ison,Maceio,AL,2012.
Variables Case Comparison Total pa
n % n % n %
Ageofchild(months)
≤13 56 54.4 52 52.5 108 53.5 0.452
>13 47 45.6 47 47.5 94 46.5
Breastfeedingduration
≤6months 69 77.5 63 70.0 132 73.7 0.160
>6months 20 22.5 27 30.0 47 26.3
Earlyintroductionofnewfoods
<4months 54 60.6 36 40.0 90 50.3 <0.001
≥4months 35 39.4 54 60.0 89 49.7
Didyoureceiveadviceonbreastfeedingduringprenatalcare?
No,never 14 14.6 17 17.2 31 15.9 <0.01 Yes,rarely 19 19.8 38 38.4 57 29.2
Yes,inallconsultations 63 65.6 44 44.4 107 54.9
Professionalthatprovidedadvice
Physician 38 46.3 77 93.9 115 70.1 <0.001 Nurse 35 42.7 3 3.7 38 23.2
Others 9 11.0 2 2.4 11 6.71
Afterdelivery,didyoureceivehelpinthebreastfeedingprocess?
No 51 49.5 21 21.2 72 35.6 <0.001 Yes 52 50.5 78 78.8 130 64.4
Didyoureceivebreastfeedingadviceduringchildcare?
No,never 24 23.3 11 11.1 35 17.3 0.040 Yes,rarely 12 11.7 9 9.1 21 10.4
Yes,inallconsultations 67 65.0 79 79.8 146 72.3
Didyoureceiveadviceonhowtointroducenewfoodstothechild?
No,never 32 31.0 12 12.1 44 21.8 <0.001 Yes,rarely 8 7.8 1 1.0 9 4.46
Yes,always 63 61.2 86 86.9 149 73.8
Professionalthatprovidedadvice
Physician 44 62.0 84 96.6 128 81 <0.001 Nurse 21 29.6 0 0.0 21 13.3
Others 6 8.5 3 3.4 9 5.7
Hours/dayinfrontofTV
<2h 18 18.0 18 18.4 36 18.2 0.042 2---5h 33 33.0 48 49.0 81 40.9
>5h 49 49.0 32 32.7 81 40.9
FamilymealsinfrontofTV
Never 32 32.0 51 52.0 83 41.9 <0.001 Sometimes 17 17.0 28 28.6 45 22.7
Always 51 51.0 19 19.4 70 35.4
FoodsthemothergivesthechildthatareshownonTVmedia
Never 43 46.2 47 53.4 90 49.7 <0.001 Sometimes 14 15.1 28 31.8 42 23.2
Always 36 38.7 13 14.8 49 27.1
Table3 Mediansandinterquartilerangesoffoodconsumptionscores,accordingtosocioeconomicandmaternaldemographic variables,andofthechildreninthecasegroupandcomparisongroup,Maceio,AL,2012.
Variables Foodgroup†
I II III IV V VI
Med IQ Med IQ Med IQ Med IQ Med IQ Med IQ
Groups
Case 3.6 1.92---4.48 2.4 0.95---4.25 1.1 0.11---1.73 2.0 1.86---2.40 1.9 0.40---3.13 2.7 0.93---5.28 Comparison 3.1 2.33---4.00 5.1 3.59---6.63 1.6 1.20---1.86 2.4 1.86---2.80 1.9 0.53---2.80 0.2 0.03---0.83
p-value* 0.05 <0.01 <0.01 <0.01 0.76 <0.01 Maternallevelofschooling
≤4years 3.5a 3.09---6.05 2.3a 0.50---3.85 0.4a 0.04---1.80 2.0 1.27---2.60 3.7 0.93---3.73 8.6a 2.46---9.40
5---8years 3.7b 2.23---4.76 2.7a 1.23---4.80 1.2b 0.30---1.76 2.0 1.86---2.46 1.9 0.53---2.90 2.6b 0.70---4.53 ≥9years 2.9c 2.33---3.85 5.0b 3.67---6.57 1.5c 1.17---1.85 2.4 1.86---2.80 1.7 0.40---2.80 0.2c 0.03---0.90
p-value* 0.03 <0.01 0.02 0.18 0.51 <0.01 Percapitaincome(MW)
≤0.20 3.7 1.75---4.43 1.9a 0.00---3.53 0.6a 0.00---1.51 2.0a 1.86---2.40 1.9 0.53---2.81 2.6a 0.76---5.43
0.20---0.55 3.5 2.93---4.42 2.6b 1.43---4.95 1.2b 0.79---2.16 2.0b 1.86---2.40 2.0 0.13---3.73 2.7b 1.17---5.07
0.55---2.71 3.2 2.33---4.00 5.1c 3.33---6.90 1.7b 1.20---1.86 2.4c 1.86---2.80 1.9 0.93---2.90 0.7c 0.10---2.80 ≥2.71 3.1 2.45---3.91 5.1c 3.71---6.40 1.5c 1.20---1.80 2.1b 1.86---2.53 1.9 0.93---2.80 0.1d 0.00---0.53
p-value* 0.37 <0.01 <0.01 0.03 0.91 <0.01 Hours/dayinfrontofTV
<2h 3.1 2.45---3.91 5.1a 3.71---6.40 1.5 1.20---1.80 2.1 1.86---2.53 1.9 0.93---2.80 0.1a 0.00---0.53
2---5h 3.2 2.51---4.26 4.3b 2.41---6.13 1.3 0.83---1.86 2.0 1.86---2.51 1.9 0.93---2.91 0.5a 0.10---2.81
>5h 3.3 2.21---4.13 3.2c 1.50---5.33 1.3 0.70---1.73 2.0 1.86---2.80 1.9 0.20---2.80 1.2b 0.21---3.93
p-value* 0.94 0.04 0.69 0.81 0.24 0.02 MealsinfrontofTV
Never 3.3 2.36---4.27 4.0a 2.00---6.03 1.7a 1.02---1.86 2.0 1.86---2.54 1.9 0.53---2.93 0.6a 0.10---3.14
Sometimes 3.3 2.22---4.19 4.2b 1.97---5.49 1.2b 0.56---1.70 2.3 1.86---2.80 1.9 0.53---3.20 0.7b 0.07---2.69
Always 3.2 2.21---4.13 2.7c 0.93---5.11 1.2b 0.33---1.73 2.0 1.86---2.80 1.9 0.45---2.60 1.6c 0.53---4.03
p-value* 0.89 0.04 0.04 0.75 0.71 0.01 FoodsshownonTVmedia
Never 3.1 2.22---4.00 4.0a 1.62---5.73 1.3 0.66---1.85 1.9a 1.86---2.40 1.9 0.26---2.80 0.6a 0.07---2.40
Sometimes 3.8 2.53---4.26 4.6b 2.80---6.14 1.3 0.80---1.73 2.4b 1.86---2.90 2.1 0.53---3.20 0.7b 0.13---3.37
Always 3.4 2.53---4.26 2.7c 1.33---5.06 1.2 0.50---1.76 2.2c 1.86---2.80 1.9 0.93---3.73 2.7c 0.66---5.96
p-value* 0.16 0.03 0.55 0.01 0.24 <0.01
MWMed,Median;IQ,InterquartileInterval.
a,b,c,dDifferentletters,statisticaldifferencesbetweenthecategories. * KruskalWallisTest.Subsequenttest:Mann---WhitneyUtest.
† Group I:breadsandcereals.GroupII:fruitsandvegetables.Group III:meat,viscera,eggsandbeans. GroupIV:Milkand dairy
products.GroupV:sugars,sweets,fatsandoils.GroupVI:processedfoodsconsideredtobesuperfluous.
alsomorecommoninchildrenwhose mothershadoffered themfoodsshownintelevisionadvertisements.
Discussion
Theresultspointtolowadherencetobreastfeeding,lackof helpandadvicefromhealthprofessionalsregardingfeeding practicesofinfantsandinadequatefoodconsumptioninthe first2 yearsof life,more frequently observedin mothers belongingtofamilieswithlowerincomeandlowereducation levels.
In recent years, therehas been innumerable scientific evidenceemphasizingtheimportanceof exclusive breast-feedingin the first6 monthsof lifeand themaintenance
ofbreastfeedinguntilthechildisatleast2yearsold.3,14,15
Despitethisevidence,thedurationofbreastfeedinginthis study was≤6 months in 70.0% of children, higher values
thanthosereportedinnationalliterature.14,16,17Also,itwas
verifiedahighfrequencyofearlyintroduction(<4months) ofotherfoods,mainlyamongchildrenfromthecasegroup (60.6%)versusthecomparisongroup(40.0%,p<0.001).This
ofhealth,18whichdoesnotseemtohaveoccurred.Despite
the government’s investment in health policies that pro-motepreventionstrategiesandnutritionaladviceasroutine practiceinhealthcareservices,19,20theimplementationof
thesepoliciesisyettobecomeacommonpractice through-outthe country, whichprobably wouldbe abletochange thisreality.
Consideringthisview,thepracticeobservedattheFHU suggests lack of knowledge or inattentiveness in putting these policies to use, as more than one-quarter of the assisted mothers reported never having received advice regardingtheintroductionofnewfoods.Therefore,itseems that the activities of the FHU multidisciplinary team are focusedontheperformanceofspecific tasksand achieve-ment of goals, or onexcess of demand, which affect the qualityofthecareprovidedtothepopulation,asobserved inotherstudies.21,22
However, it is noteworthy the fact that the mother’s lackofnutritionaleducationisacommonrealityinBrazil, as studies show that children up to 24 months are being weaned at an increasingly earlier age and the introduc-tionofcomplementaryfoodsisoccurringatthewrongway andtime.1,5,6,23 Datafromthe IIBreastfeeding Prevalence
Research,17attheFederalDistrictandstatecapitals,show
thatinfantsalreadyconsumecookiesand/orsnacksand,in theNortheastregion,thisconsumptionincludedalmosthalf ofthechildrenaged6months(44.1%).
In the comparison group, whose mothers had better incomeandeducationallevels,therewasahigher consump-tion of foods from groups II and III, which are beneficial andessentialtochildren’shealth,withlowerconsumption of processed foods. This finding suggests that the access toinformation thatprocessed products areunessentialin thefirst2yearsoflifestilldependsonbettersocio-cultural level,i.e.,thatthenutritionofachilddependsnotonlyon theaccesstoadequatefood,butaboveall,onthefamily’s educationallevelandculture.24,25
In the present study, which evaluated food consump-tion through scores, it was observed an agreement with other reports in the literature that evaluated the food intake of children using different methodologies. Aquino andPhilippi,23studyingchildren’sconsumptionofprocessed
foods,assessedbycountingtheconsumedportions,founda highsugarconsumptioninchildrenwhosefamilieshadlower income(1stquartileofpercapitaincomeR$59.19).Toloni etal.6evaluatedinfants’consumptionofprocessedproducts
throughconsumed portions and found that approximately twothirdsofthe childrenreceivedfoods withobesogenic potential before 12 months of life, such as instant noo-dles, snacks, sandwich cookies, artificial juice, soda and candy/lollipops/chocolate.Themotherswhoofferedthese foods totheir infants had,at a greater proportion,lower educationallevel,lowerincomeandwereyounger.
Anothervariableobservedinthestudyandthatcanhave a negative influence on food quality of the infants was themother’ssedentary lifehabits, suchasspending more time watching television. In the case group, most moth-ers reported this behavior, which possibly contributed to the higher consumption score of processed foods among infants fromthis group. Studies have observed poor eat-ingpatternsinfamilieswhowatchtelevisionat mealtime, withhigherconsumptionofhigh-caloriefoods bychildren,
adolescents and adults. In Brazil, in Florianopolis, Fiates et al.26 observed that, while the family watched
televi-sion,there wasa higher consumption of foods that were sourcesof simple carbohydratesand fats,suggesting that families who watch television at mealtime can get dis-tractedandlosecontroloverfoodconsumption,byignoring internal satiety signals,which can lead to excessivefood intake.27---29 Thesechangesinfoodconsumptioncanhavea
greatimpactonchildren,asgoodeatinghabitsare essen-tialforthepreventionofchronicdiseasesandconsolidation of healthybehaviors in childhood,which will extendinto adulthood.11,30
It is noteworthy that this is a cross-sectional study in which information was provided by mothers/guardians throughfoodrecall,whichcanresultinimprecisionsabout the period of introduction of new foods and duration of breastfeeding.1 However,this memorybiasmust nothave
substantially influenced the results, as only mothers of infants participated in this research and the introduction of new foods in the diet occurred a few months before theinterview;anotherbenefitwasthatdatacollectionwas carriedoutbytwotrainednutritionists.Itisalsoworth men-tioningthatthedatashownheredonotreflecttherealityof allprivatepracticesandallFHUsinthecapitalofAlagoas, becausethestudywasnotapopulation-basedone.However, thestudydesignallowsustospeculatethatthefindingscan beappliedinsimilarcontexts.
In conclusion, the results suggest that maternal socio-economic status influencesthe qualityof food offered to theinfant,sincein thecasegroupchildren agedupto24 months had already been introduced to processed foods, attheexpenseofhealthyfoodconsumption.Thedataalso suggestthattheinfluenceoftelevisionmediaandthelack ofsupportfromhealthcareprofessionalscontributetothe earlyintroductionofinappropriatefoodpractices.
It is necessary to implement intervention measures, bothin health careservicesand privatepractices,aiming tooffer advice to mothers and promote healthy comple-mentaryfeeding. It is necessary toassess dietary intakes in researches aimed to establish health status, as they allowcharacterizingtherisklevelandvulnerabilityofthe population to overeating, aswell adapting and proposing interventionmeasurestoensurehealth,particularlyinthe populationgroupagedupto2years,whichisthetimewhen dietisoneofthedeterminantsofgrowthrateand develop-ment.
Funding
Thisstudydidnotreceivefunding.
Conflicts
of
interest
Theauthorsdeclarenoconflictsofinterest.
Acknowledgements
Director and Community Health Agents of Carla Nogueira FHUandthepediatricianswhocollaboratedwiththe recruit-mentofmothers.
References
1.ToloniMH,Longo-SilvaG,KonstantynerT,TaddeiJA.Consumo de alimentos industrializados porlactentes matriculados em creches.RevPaulPediatr.2014;32:37---43.
2.Dias MC, Freire LM, Franceschini SC. Recomendac¸ões para alimentac¸ãocomplementardecrianc¸asmenoresdedoisanos. RevNutr.2010;23:475---86.
3.Datillo AM,Birch L, KrebsNF, LakeA, TaverasEM, Saavedra JM. Need for earlyinterventions in the prevention of pedi-atricoverweight:a reviewand upcomingdirections. JObes. 2012;2012:1---18.
4.Brasil---InstitutoBrasileirodeGeografiaeEstatística.Pesquisa deOrc¸amentosFamiliares(POF)2002---2003:antropometriae análise do estado nutricional de crianc¸as eadolescentes no Brasil.RiodeJaneiro:IBGE;2006.
5.Barbosa RM,CrocciaC, CarvalhoCG.Consumo alimentarde crianc¸as com base napirâmide alimentarinfantil. Rev Nutr. 2005;18:633---41.
6.ToloniMH,Longo-SilvaG,GoulartRM,TaddeiJA.Introduc¸ãode alimentosindustrializadosedealimentosdeusotradicionalna dietadecrianc¸asdecrechespúblicasnomunicípiodeSãoPaulo. RevNutr.2011;24:61---70.
7.ModdieR,StucklerD,MonteiroC,etal.Profitsandpandemics: preventionofharmfuleffects oftabacco,alcohol,and ultra-processedfoodanddrinkindustries.Lancet.2013;381:670---9. 8.HolandaLB,Barros-FilhoAA.Métodosaplicadoseminquéritos
alimentares.RevPaulPediatr.2006;24:62---70.
9.Assis AM,BarretoML. Epidemiologianutricional. In: Almeida FilhoN,BarretoML,editors.Epidemiologia&Saúde.Guanabara Koogan:RiodeJaneiro;2011.
10.Spinelli MG, Souza SB, Souza JM. Consumo, por crianc¸as
menores de um ano de idade,de alimentos industrializados
considerados supérfluos [página naInternet]. Ed Moreira Jr;
2001.p.666---72.Availablein:http://www.moreirajr.com.br/
revistas.asp?fase=r003&idmateria=1771[accessed20.01.15]. 11.Brasil---MinistériodaSaúde.SecretariadeAtenc¸ãoàSaúde
---departamentodeatenc¸ãobásica.In:Saúdedacrianc¸a:nutric¸ão infantil. Aleitamento materno e alimentac¸ão complementar. Brasília:MinistériodaSaúde;2009.
12.ColucciAC,PhilippiST,SlaterB.Desenvolvimentodeum ques-tionário defrequência alimentar paraavaliac¸ão do consumo alimentarde crianc¸asde2 a5 anosdeidade. RevBras Epi-demiol.2004;7:393---401.
13.Fornés NS, Martins IS, Vélaquez-Meléndez G, Latorre MR. Escoresdeconsumoalimentareníveislipêmicosempopulac¸ão deSãoPaulo,Brasil.RevSaudePublica.2002;36:12---8.
14.CaetanoMC,OrtizTT,SilvaSG,SouzaFI,SarniRO. Complemen-taryfeeding:inappropriatepracticesininfants.JPediatr(Rio J).2010;86:196---201.
15.FerreiraHS,VieiraED,CabralJuniorCR,QueirozMD. Aleita-mento materno portrinta dias ou mais éfator de protec¸ão contra sobrepeso em pré-escolares da região semiárida de Alagoas.RevAssocMedBras.2010;56:74---80.
16.SaldivaSR,VenancioSI,GouveiaAG,CastroAL,EscuderMM, GiuglianiER. Influênciaregional noconsumoprecoce de ali-mentosdiferentesdoleitematernoemmenoresdeseismeses residentesnascapitaisbrasileiraseDistritoFederal.CadSaude Publica.2011;27:2253---62.
17.Brasil ---Ministério da Saúde.Secretaria deAtenc¸ão à Saúde --- departamento de ac¸ões programáticas e estratégicas. II. Pesquisadeprevalênciadealeitamentomaternonascapitais BrasileiraseDistritosFederais.Brasília:Ministério daSaúde; 2009.
18.Cervera DP, Parreira BD, Goulart BF. Educac¸ão em saúde: percepc¸ãodosenfermeirosdaatenc¸ãobásicaemUberaba(MG). CiencSaudeColet.2011;16:1547---54.
19.Brasil--- MinistériodaSaúde. Secretariade PolíticadeSaúde --- coordenac¸ão geral dapolítica de alimentac¸ão enutric¸ão. Dez passos para uma alimentac¸ão saudável: guia alimentar paracrianc¸asmenoresde2anos.Brasília:MinistériodaSaúde; 2002.
20.Brasil--- MinistériodaSaúde. Secretariade PolíticadeSaúde --- coordenac¸ão geral dapolítica de alimentac¸ão enutric¸ão. EstratégiaNacionalparaAlimentac¸ãoComplementarSaudável. Brasília:MinistériodaSaúde;2010.
21.Gonc¸alvesRJ,SoaresRA,TrollTC,CyrinoEG.Sermédicono PSF:formac¸ãoacadêmica,perspectivasetrabalhocotidiano. REBEM.2009;33:382---92.
22.Camargo KR Jr, Campos SE, Bustamante-Teixeira MT, et al. Avaliac¸ãodaatenc¸ãobásicapelaóticapolítico-institucionale daorganizac¸ãodaatenc¸ãocomênfasenaintegralidade.Cad SaudePublica.2008;24:58---68.
23.deAquinoRC,PhilippiST.Associationofchildren’sconsumption ofprocessedfoodsandfamilyincomeinthecityofSãoPaulo, Brazil.RevSaudePublica.2002;36:655---60.
24.Santos CS, Lima LS, Javorski M. Fatores que interferem na transic¸ão alimentar de crianc¸as entre cinco e oito meses: investigac¸ãoemServic¸odePuericulturadoRecife,Brasil.Rev BrasSaudeMaterInfant.2007;7:373---80.
25.Simon VG, Souza JM, Souza SB. Introduc¸ão de alimentos complementaresesuarelac¸ãocom variáveisdemográficas e socioeconômicas,emcrianc¸asnoprimeiroanodevida, nasci-dasemHospitalUniversitárionomunicípiodeSãoPaulo.Rev BrasEpidemiol.2003;6:29---38.
26.Fiates GM, Amboni RD, Teixeira E. Television use and food choices of children: qualitative approach. Appetite. 2008;50:12---8.
27.PellaiA,VetranoS,NobileM,LutiC.Thereversepyramid:a quali-quantitativestudyaboutfoodadvertisinginsidechildren’s televisionprogrammes.MinervaPediatr.2012;64:15---26.
28.Hare-BruunH,NielsenBM,Kristensen PL,Møller NC,Togo P, HeitmannBL. Televisionviewing,foodpreferences,and food habits among children: a prospective epidemiological study. BMCPublicHealth.2011;11:311.
29.Barr-AndersonDJ,LarsonNI,NelsonMC,Neumark-SztainerD, StoryM.Doestelevisionviewingpredictdietaryintakefiveyears laterhighschoolstudentsand youngadults?IntJBehavNutr PhysAct.2009;6:1---8.