CLINICAL SCIENCE
IInsituto do Coração, Faculdade de Medicina da Universidade de São Paulo – São Paulo/SP, Brazil.
IIFaculdade de Medicina, Pontifícia Universidade Católica do Paraná - Pa-raná, Brazil.
Email: [email protected]
Received for publication on January 28, 2008 Accepted for publication on April 06, 2008
HIGH RATIO OF TRIGLYCERIDES TO
HDL-CHOLESTEROL PREDICTS EXTENSIVE CORONARY
DISEASE
Protasio Lemos da Luz,I Desiderio Favarato,I Jose Rocha Faria-Neto Junior,II
Pedro Lemos,I Antonio Carlos Palandri ChagasI
doi: 10.1590/S1807-59322008000400003
da Luz PL, Favarato D, Faria-Neto Jr JR, Lemos P; Chagas ACP. High ratio of triglycerides to HDL-cholesterol ratio predicts extensive coronary disease. Clinics. 2008;63:427-32.
An abnormal ratio of triglycerides to HDL-cholesterol (TG/HDL-c) indicates an atherogenic lipid profile and a risk for the devel-opment of coronary disease.
OBJECTIVE: To investigate the association between lipid levels, specifically TG/HDL-c, and the extent of coronary disease.
METHODS: High-risk patients (n = 374) submitted for coronary angiography had their lipid variables measured and coronary
disease extent scored by the Friesinger index.
RESULTS: The subjects consisted of 220 males and 154 females, age 57.2 ± 11.1 years, with total cholesterol of 210± 50.3 mg/
dL, triglycerides of 173.8 ± 169.8 mg/dL, HDL-cholesterol (HDL-c) of 40.1 ± 12.8 mg/dL, LDL-cholesterol (LDL-c) of 137.3 ± 46.2 mg/dL, TG/HDL-c of 5.1 ± 5.3, and a Friesinger index of 6.6 ± 4.7. The relationship between the extent of coronary disease (dichotomized by a Friesenger index of 5 and lipid levels (normal vs. abnormal) was statistically significant for the following: triglycerides, odds ratio of 2.02 (1.31-3.1; p = 0.0018); HDL-c, odds ratio of 2.21 (1.42-3.43; p = 0.0005); and TG/HDL-c, odds ratio of 2.01(1.30-3.09; p = 0.0018). However, the relationship was not significant between extent of coronary disease and total cholesterol [1.25 (0.82-1.91; p = 0.33)] or LDL-c [1.47 (0.96-2.25; p = 0.0842)]. The chi-square for linear trends for Friesinger > 4 and lipid quartiles was statistically significant for triglycerides (p = 0.0017), HDL-c (p = 0.0001), and TG/HDL-c (p = 0.0018), but not for total cholesterol (p = 0.393) or LDL-c (p = 0.0568). The multivariate analysis by logistic regression OR gave 1.3 ± 0.79 (p = .0001) for TG/HDL-c, 0.779 ± 0.074 (p = .0001) for HDL-c, and 1.234 ± 0.097 (p = 0.03) for LDL. Analysis of receiver operating characteristic curves showed that only TG/HDL-c and HDL-c were useful for detecting extensive coronary disease, with the former more strongly associated with disease.
CONCLUSIONS: Although some lipid variables were associated with the extent of coronary disease, the ratio of triglycerides to
HDL-cholesterol showed the strongest association with extent.
KEYWORDS: Lipids. Triglycerides. HDL. Cholesterol. Coronary disease.
INTRODUCTION
Lipid abnormalities have long been suspected to contribute to atherosclerosis; several epidemiological and cohort studies have established a strong association between total cholesterol, LDL-cholesterol (LDL-c), or low
HDL-cholesterol (HDL-c) and the incidence of atherosclerosis-related diseases, such as ischemic heart disease, stroke, and peripheral vascular disease.
Recently, lipid particle subfractions have also been implicated in the atherogenic process. Small dense LDL particles are more atherogenic than larger buoyant ones, and different HDL subfractions play different roles in atherogenesis. The larger and less dense HDL2 particles are considered protective, while the small dense HDL3 particles are atherogenic.1,2 The former correlate inversely with serum
triglycerides and small dense LDL.3 The ratio of triglycerides
with the plasma level of small, dense LDL particles. A TG/HDL-c ratio of 3.8 divides the distribution of LDL phenotypes, with 79% of phenotype B greater than this value, and 81% of phenotype A lower than this value4. We
recently analyzed the relationship between plasma lipids and development of coronary artery disease (CAD) as manifested by angina, positive ischemic tests, or significant obstructive lesions in the coronary angiogram. We found that an TG/ HDL-c ratio >4 is the most powerful independent predictor of CAD development5. Thus, this ratio shows promise as an
attractive surrogate index of the atherogenicity of the plasma lipid profile. However, little data exist on the association between TG/HDL-c ratio and the extent or severity of lesions in coronary disease.
Objectives - To evaluate the correlation between lipid
variables, especially the TG/HDL-c ratio, and the extent of coronary disease in patients investigated for suspected CAD.
Study design – Eligible patients were outpatients who
underwent diagnostic coronary angiography for suspected coronary disease.
The presence of risk factors were defined as follows: hypercholesterolemia (total cholesterol >200 mg/ dL), hypertriglyceridemia (>150 mg/dL), high LDL-cholesterolemia (LDL-c) (>130 mg/dL), low HDL-cholesterolemia (HDL-c) (<40 mg/dL for male and <50 mg/dL for female), elevated TG/HDL-c ratio (>4), diabetes mellitus (fasting glucose q126 mg/dL, casual or GTT over 200 mg/dL, or current use of oral hypoglycemiant or insulin), hypertension (cutoff points were 140/90 mm Hg), and status as a current smoker.
Laboratory tests for total cholesterol and fractions, triglycerides, and glycemia were performed using standard techniques.
Coronary lesion extent was evaluated using the Friesinger index6. This classification uses the following categories: 0, no
arteriographic abnormalities; 1, trivial irregularities (lesions from 1-29%); 2, lesions from 30-68%; 3, multiple narrowing in the same vessel, and the segment has either one lesion with a morphology defined as multiple, diffuse or tubular, or two segments with stenosis of 30-68%; 4, at least one lesion of 69-100%, except in the proximal segment where it should be less than 100%; and 5, occlusion of a proximal segment of a vessel. Left main lesions were counted as proximal lesions of both left descending and circumflex arteries. Coronary lesions were scored by experts blinded to patient lipid profiles.
Statistics - Statistics were calculated by univariate
analysis with chi-square and non-parametric ANOVA (Kruskal-Wallis), followed by multivariate analysis using stepwise forward logistic regression to assess the
independent influence of lipid variables on extent of coronary disease extension, dichotomized by a Friesinger index of 5.
RESULTS
The subjects included 374 patients, 165 (60.2%) men and 109 (39.8%) women, with a mean age of 57 ± 11.5 years. Total cholesterol was 214 ± 50.2 mg/dL; triglycerides, 167.9±91.7 mg/dL; HDL-c, 38.5 ± 11.9 mg/dL; LDL-c, 142.9 ± 45 mg/dL; TG/HDL-c, 5.1 ± 4.0; and Friesinger index, 6.9 ± 4.4. Hypertensive and dyslipidemic subjects were predominantly male. Table 1 shows demographics of the patient sample, as well as the distribution of coronary lesions.
Extensive coronary disease, by univariate analysis, presented a direct relationship with the quartiles of total triglycerides, and TG/HDL-c, and an inverse relationship with HDL-c quartiles (Table 2).
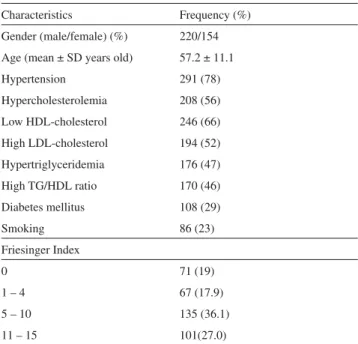
Table 1 - Demographic characteristics of patient sample and
Friesinger index frequency
Characteristics Frequency (%)
Gender (male/female) (%) 220/154 Age (mean ± SD years old) 57.2 ± 11.1
Hypertension 291 (78)
Hypercholesterolemia 208 (56) Low HDL-cholesterol 246 (66) High LDL-cholesterol 194 (52) Hypertriglyceridemia 176 (47)
High TG/HDL ratio 170 (46)
Diabetes mellitus 108 (29)
Smoking 86 (23)
Friesinger Index
0 71 (19)
1 – 4 67 (17.9)
5 – 10 135 (36.1)
11 – 15 101(27.0)
Table 2 - Frequency of extensive coronary disease (Friesinger
index q5) by lipid quartile
Q1 Q2 Q3 Q4 P (linear
trend) Total Cholesterol 70.2 47.9 62.8 71.7 0.393
LDL-cholesterol 64.9 50.5 62.9 75 0.0568
HDL-cholesterol 75 69.8 63.2 42.5 0.0001
Triglycerides 55.3 56.8 72.8 76.7 0.0017
TG/HDL-c 47.9 63.0 66.7 75.3 0.0001
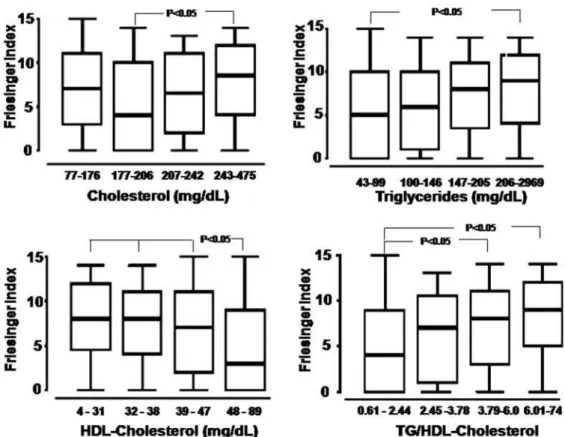
The odds ratios for the extent of coronary disease between the fourth and first quartiles were as follows: total cholesterol, 1.08, 95%CI (0.57-2.03), p = 0.87; LDL-c, 1.62, 95%CI (0.86-3.06), p = 0.15; triglycerides, 1.7, 95%CI (0.94-3.08), p = 0.986; HDL-c, 0.25, 95%CI (0.13-0.46), p = 0.0001; and TG/HDL-c, 3.31, 95%CI (1.78-6.14), p = 0.0002 (Figure 1). This analysis showed that only HDL-c and TG/HDL-c show statistically significant frequency differences between the fourth and first quartiles, and that the difference was larger for TG/HDL-c. The non-parametric ANOVA (Kruskal-Wallis) demonstrated a significant association between extensive coronary disease and the lipid variable quartiles. However, only HDL-c and TG/ HDL-c--primarily the latter--showed statistically significant differences in median Friesinger index between abnormal values and normal ones. Total cholesterol and LDL-c showed a similar distribution and Figure 2 therefore presents only the Friesinger distribution for the quartiles of total cholesterol, triglycerides, HDL-c, and TG/HDL-c.
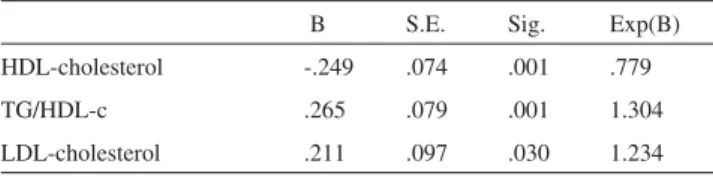
The multivariate analysis by logistic regression included these lipid variables, and it showed that the TG/HDL-c ratio showed the strongest correlation [association] with extent of coronary disease. Increasing the HDL-c quartile led to a 22% decrease in extent, while increasing the LDL-c or TG/ HDL-c quartiles led to a 23% and 30% increase in disease extent, respectively (Table 3).
Of the 246 subjects with low HDL-c, 171 (69.5%) had extensive coronary disease, and of the 170 subjects with high TG/HDL-c, 122 (72%) had extensive coronary disease. This
Figure 1 - Odds ratios between fourth and first quartiles of lipid variables for extensive coronary disease (Friesinger index >4)
may be due to the fact that HDL-c and Triglycerides levels were discordant in 35 (25%) of subjects with low extents of disease and in 75 (32%) of subjects with extensive coronary disease. Thus, taking both variables into account by using the Triglycerides to HDL-c ratio increased the accuracy of detecting extensive coronary disease.
Analysis of the ROC curves showed the following areas under the curves: 0.35 for HDL-c (p = 0.0001), 0.55 for LDL-c (p = 0.131), and 0.63 for TG/HDL-c (p = 0.0001).
DISCUSSION
We found a relationship between the extent of coronary disease and lipid variables using univariate analysis. In a multivariate model that included these variables, the ratio of triglycerides to HDL-cholesterol was found to be a powerful independent indicator of extensive coronary disease.
Despite the fact that small, dense LDL particles are an established risk factor for cardiovascular disease, the assessment of their subfractions by current methods have been too technically demanding to be applicable in a routine
Table 3 - Results of multivariate analysis
B S.E. Sig. Exp(B)
HDL-cholesterol -.249 .074 .001 .779
TG/HDL-c .265 .079 .001 1.304
clinical laboratory. The usual techniques include density gradient ultracentrifugation,7non-denaturing gradient gel
electrophoresis (NDGGE),8and nuclear magnetic resonance
(NMR) spectroscopy,9which have the disadvantages of being
labor-intensive, technically demanding, expensive, or slow to produce results. As a result, these precise and accurate techniques are not widely used in clinical settings. Thus, developing surrogate markers of lipid particle profiles are of great clinical and economic importance.
Several studies have attempted to determine the risk levels for CAD using lipid indexes or formulas.10 The goal
of this work is to manage patients better in order to prevent cardiac events. Of particular interest are ratios that have atherogenic particles in the numerator and HDL-c or its constituents in the denominator. The ratio of total cholesterol to HDL-c11,12 and, to a lesser extent, the ratio of LDL-c to
HDL-c13have been shown to be better predictors of CAD
than lipid alone. More recently, in the INTERHEART case-control study, the apoB/apoA1 ratio was shown to be the strongest risk factor associated with myocardial infarction.14
This ratio had already been proposed as an accurate predictor of risk for major coronary events in the AFCAPS/TexCAPS15
and AMORIS16 studies.
The ratio TG/HDL-c, initially proposed by Gaziano et
al,17 is an atherogenic index that has proven to be a highly
significant independent predictor of myocardial infarction, even stronger than TC/HDL-c and LDL-c/HDL-c. The Copenhagen Male Study showed triglycerides on their own to be another strong risk factor, but it found that stratifying triglyceride levels by HDL-c levels led to more accurate detection of increased risk of coronary disease.18
The atherogenic link between high triglycerides and HDL-c is due to the higher plasma concentration of triglyceride-rich, very low-density lipoprotein that generates small, dense LDL during lipid exchange and lipolysis. These LDL particles accumulate in the circulation and form small, dense HDL particles, which undergo accelerated catabolism, thus closing the atherogenic circle.19,20
The present study indicates that TG/HDL-c, which we previously showed to be an indicator of development of coronary heart disease development,5 is also related to the
severity of vessel compromise. Thus this ratio is an easy, non-invasive means of predicting the presence and extent of coronary atherosclerosis.
Study limitations. We studied a high-risk subset of
patients, who showed a higher prevalence of coronary disease than the general population. We compared only lipid variables, and did not take into account the current
use of medication or the inflammatory state of the patients. Since the commonly used statin and angiotensin enzyme inhibitors and angiotensin II receptor blockers may alter the inflammatory state, they may weaken the relationship between total cholesterol and LDL-cholesterol and the extent of coronary disease. This is because they act more on LDL-cholesterol and less on HDL-LDL-cholesterol and triglycerides.
CONCLUSION
Nearly all routinely assessed lipid variables were associated with the extent of coronary disease, but only the ratio of triglycerides to HDL-cholesterol or to HDL-c were robustly associated with disease extent. Elevation in the ratio of TG to HDL-c was the single most powerful predictor of extensive coronary heart disease among all the lipid variables examined.
REFERENCES
1. Miller NE. Associations of high-density lipoprotein subclasses and apolipoproteins with ischemic heart disease and coronary atherosclerosis, Am Heart J. 1987;113:589–97.
2. Robinson D, Ferns GA, Bevan EA, Stocks J, Williams PT, Galton DJ. High density lipoprotein subfractions and coronary risk factors in normal men, Arteriosclerosis. 1987;7:341-6.
3. Williams PT, Krauss RM, Vranizan KM, Stefanick ML, Wood PDS, Lindgren FT. Associations of lipoproteins and apolipoproteins with gradient gel electrophoresis estimates of high density lipoprotein subfractions in men and women, Arterioscler Thromb. 1992;12:332-40.
4. Hanak V, Munoz J, Teaque J, Stanley A Jr, Bittner V. Accuracy of the triglyceride to high-density lipoprotein cholesterol ratio for prediction of the low-density lipoprotein phenotype B, Am J Cardiol. 2004;94:219-22.
5. Da luz PL, Cesena FH, Favarato D, Cerqueira ES. Comparison of serum lipid values in patients with coronary artery disease at <50, 50 to 59, 60 to 69, and >70 years of age, Am J Cardiol. 2005;96:1640-3.
6. Rinqqvist I, Fisher LD, Mock M, Davis KB, Wedel H, Chaitman BR, et al. The Coronary Artery Surgery Study. Prognostic Value of Angiographic Indices of Coronary Artery Disease from the Coronary Artery Surgery Study (CASS), J Clin Invest. 1983;71:1854-66. 7. Krauss RM, Burke DJ. Identification of multiple subclasses of plasma
low density lipoprotein in normal humans, J Lipid Res. 1982;23:97-104.
8. Scheffer PG, Bakker SJL, Heine RJ, Teerlink T. Measurement of LDL particle size in whole plasma and serum by high performance gel-filtration chromatography using a fluorescent lipid probe, Clin Chem. 1998;44:2148-51
9. Kuller L, Arnold A, Tracy R, Otvos J, Burke G, Psaty B, et al. Nuclear Magnetic Resonance Spectroscopy of Lipoproteins and Risk of Coronary Heart Disease in the Cardiovascular Health Study, Arterioscler Thromb Vasc Biol. 2002;22:1175-80.
11. Hong MK, Romm PA, Reagan K, Green CE, Rackley CE. Usefulness of the total cholesterol to high density lipoprotein cholesterol ratio in predicting angiographic coronary disease in women, Am J Cardiol 1991;68:1646-50.
12. Castelli WP, Anderson K, Wilson PW, Levy D. Lipids and risk of coronary heart disease. The Framingham Study, Ann Epidemiol. 1992;2:23-8.
13. Manninen V, Tenkanen L, Koshinen P, Huttunen JK, Manttari M, Heinonen PO, et al. Join effects of serum triglycerides and LDL cholesterol and HDL cholesterol concentrations on coronary heart disease risk in the Helsinki Heart Sudy. Implications for treatment, Circulation. 1992;85:37-45.
14. Yusuf S, Hawken S, Ounpuu S, Dans T, Avezum A, Lanas F, et al. Effect of potentially modifiable risk factors associated with myocardial infarction in 52 countries (the INTERHEART study): case-control study. Lancet. 2004;363:937-52.
15. Gotto AM Jr, Whitney E, Stein EA, Shapiro DR, Clearfield, Weis S, et al. Relation between baseline and on-treatment lipid parameters and first acute major coronary event in the Air Force/Texas Coronary Atherosclerosis Prevention Study (AFCAPS/Tex CAPS), Circulation. 2000;101:477-84.
16. Walldius G, Jungner I, Holme I, Astveit AH, Kolar W, Steiner E. High apoliprotein B, low apolipoprotein A-I, and improvement in the prediction of fatal myocardial infarction (AMORIS Study): a prospective study, Lancet. 2001;358:2026-33.
17. Gaziano JM, Hennekens CH, O’Donnell CJ, Breslow JL, Buring JE. Fasting triglycerides, high density lipoprotein, and risk of myocardial infarction, Circulation. 1997; 96: 2520-5.
18. Jeppesen J, Hein HO, Suadicani P, Gyntelberg F. Triglycerides concentration and ischemic heart disease: an eight-year follow-up in the Copenhagen Male Study, Circulation. 1998;97:1029-36.
19. Packard CJ, Shepherd J. Lipoprotein heterogenity and apolipoprotein B metabolism, Arterioscler Thromb Vasc Biol, 1999;19:2456-64. 20. Brinton EA, Eeisenberg S, Breslow JL. Increased apo A-I and apo-AII