Sociedade Brasileira de Clínica Médica Regional Rio de Janeiro, Faculdade de Medicina de Campos, Hospital Escola Álvaro Alvim
Mailing address: Luiz José de Souza – Sociedade Brasileira de Clínica Médica, RJ Av. Alberto Torres, 217 – 28035-580 – Campos dos Goytacazes, RJ, Brazil E-mail: [email protected]
English version by Stela Maris C. e Gandour Received - 9/25/02
Accepted - 2/23/03
Arq Bras Cardiol, volume 81 (nº 3), 257-64, 2003
Luiz José de Souza, João Tadeu Damian Souto Filho, Thiago Ferreira de Souza,
Aldo Franklin Ferreira Reis, Carlos Gicovate N eto, Diogo Assed Bastos, Vitor Azevedo Côrtes, Félix Elias Barros Chalita, Cláudio Luiz Teixeira
Campos dos Goytacazes, RJ - Brazil
Prevalence of Dyslipidemia and Risk Factors in Campos dos
Goytacazes, in the Brazilian State of Rio de Janeiro
Currently, atherosclerosis is undoubtedly the major cause of mortality in developed countries. Due to the evo-lutional process of industrialization and urban concentra-tion, with consequent changes in lifestyle, Brazil has also joined this world scenario. Although multifactorial, dysli-pidemias play a determinant and direct role in the genesis of atherosclerosis and in its consequent cardiovascular and cerebrovascular risks 1-4.
In the last few years, several studies have confirmed the premise that a reduction in cholesterol levels causes a reduction in the risk of coronary events, both in primary and secondary preventions 5-9.
If effective preventive measures are not taken, epide-micity has been foretold with calamitous consequences to public health 1,10. Therefore, tools for the epidemiological
evaluation of lipid profiles are essential for the development and promotion of health polices to reduce cardiovascular mortality 11,12.
The prevalence of dyslipidemias varies according to the ethnic, socioeconomic, and cultural characteristics of distinct population groups 10,13,14. In Brazil, reliable studies
determining the actual prevalence of dyslipidemias in a group of individuals statistically representative of a free and geographically delimited population are scarce 13,15,16.
Most studies comprise restricted groups limited to a certain age range 17-20, such as ambulatory patients 11,21, individuals
with already established coronary artery disease 22, and
stu-dents 23 or employees of a single institution 11,14,24-29, or use
secondary databanks from laboratories for clinical analy-ses 13,15. In addition, almost all those studies have only
ana-lyzed total cholesterol levels, not allowing complete evalua-tion of the lipid profile of the populaevalua-tion.
The lipid profile defined by the III Brazilian Guidelines on Dyslipidemias (III Diretrizes Brasileiras sobre Dislipi-demias) 1 comprises an assessment of total cholesterol (TC),
triglycerides (TG), and HDL-cholesterol (HDL-C), and the calculation of LDL-cholesterol (LDL-C) with the Friedewald formula. Based on the results of those parameters, the
Objective – To determine the prevalence of dyslipi-demias in adults in the city of Campos dos Goytacazes, in the Brazilian state of Rio de Janeiro, and to identify its re-lation to risk factors.
Methods – Cross-sectional, population-based, ob-servational study with sampling through conglomerates and stratified according to socioeconomic levels, sex, and age, with 1,039 individuals. Risk factors, familial history, blood pressure, anthropometric measurements, glucose, triglycerides and cholesterol were determined.
Results - The following prevalences were observed: of dyslipidemias 24.2%; of hypercholesterolemia, 4.2%; of elevated LDL-C, 3.5%; of low HDL-C, 18.3%; and of hyper-triglyceridemia, 17.1%. The following mean levels were observed: cholesterol, 187.6± 33.7 mg/dL; LDL-C, 108.7±-26.8 mg/dL; HDL-C, 48.5±7.7 mg/dL; and triglycerides, 150.1±109.8 mg/dL. The following variables showed a po-sitive correlation with dyslipidemia: increased age (P<0.001), male sex (P<0.001), low familial income (P<0.001), familial history (P<0.01), overweight/obesity (P<0.001), waist measure (P<0.001), high blood pressure (P<0.001), and diabetes mellitus (P<0.001). The following variables had no influence on dyslipidemias: ethnicity, edu-cational level, smoking habits, and sedentary lifestyle.
Conclusion – The frequency of lipid changes in the population studied was high, suggesting that measures for the early diagnosis should be taken, in association with implementation of programs for primary and secondary prevention of atherosclerosis.
laboratory classification of dyslipidemias may be establi-shed as follows: isolated hypercholesterolemia, isolated hypertriglyceridemia, mixed hyperlipidemia, and low HDL-cholesterol.
This study is part of a project developed in the city of Campos dos Goytacazes, in the Brazilian state of Rio de Janeiro, aiming at determining the prevalence of high blood pressure, diabetes mellitus, dyslipidemias, and obesity in adults. The original project was stratified, allowing a careful assessment of each of those diseases. In this study, the pre-valence of dyslipidemias in a representative sample of the urban population aged more than 18 years in the city of Campos dos Goytacazes was determined, as was the relation of dyslipidemias with biological, socioeconomic and cultu-ral factors, and other associated morbidities.
Methods
A cross-sectional, population-based, observational study was carried out with sampling through conglome-rates and stratified according to socioeconomic levels, sex, and age.
The target population comprised the residents in the city of Campos dos Goytacazes, in the state of Rio de Janeiro [population 363,489 according to the IBGE (Brazilian Insti-tute of Geography and Statistics), 2000], with age > 18 years, which corresponded approximately to 221,000 people.
Based on sampling calculations, the number of 1,039 individuals was determined as the required participation to carry out a study with accuracy ≤ 3% and a confidence in-terval of 95%.
The sample was stratified based on the sectors of the IBGE census of 2000 for the population of the city of Campos dos Goytacazes. The sectors of the census were divided according to the socioeconomic levels of the population into heterogeneous and homogeneous. The heterogeneous sectors were ruled out, and the homogeneous sectors were divided into 5 groups according to the familial income in minimum wages (MW) as follows: group A - less than 1 MW; group B - from 2 to 5 MW; group C - from 6 to 10 MW; group D - from 11 to 20 MW; group E - more than 20 MW. The number of sectors to be studied per group to allow propor-tionality between the sample and the city population was as follows: 6 sectors in group A (82 interviewees per sector), 5 sectors in group B (86 interviewees per sector), 1 sector in group C (77 interviewees), 1 sector in group D (35 intervie-wees), and 1 sector in group E (25 intervieintervie-wees), adding to a total of 1,039 interviewees in 14 sectors of the census. The sectors in the groups were chosen according to the criterion of population density in the sector and ease of access, inclu-ding an analysis about the level of violence in the sectors. In each sector chosen, 4 streets were initially selected, and, on each street, the residences were approached alternately on both sides of the street until completing the required number of interviewees in the sector. When necessary, other streets in the sector were approached to complete the minimum number of interviewees.
In each sector, we tried to maintain the distribution between the sexes proportional to that of the population of the city of Campos dos Goytacazes: 49% for the male sex and 51% for the female sex. All values were adjusted according to the age structure, considering the population of both sexes above the age of 18 years and based on the IBGE data for the year 2000.
Data were collected in 2 stages from January to Sep-tember 2001. The first stage comprised the completion of a questionnaire containing the following parameters: iden-tification, sex, age, familial history, socioeconomic levels, educational level, anthropometric parameters, and 2 mea-surements of blood pressure at a 10-minute interval. In the second stage, scheduled 24 to 48 hours after the first, with the patient fasting for 12 hours, blood was drawn and a new blood pressure measurement was taken. A mean of the 2 blood pressure measurements of the first visit was calcu-lated and compared with the measurement of the second visit.
Plasma lipids and glycemia measurements were obtained from the 10 mL of venous blood drawn after 12 hours of fasting between 7 and 9 AM. The blood samples were placed in a Styrofoam box with ice, which was sealed and immediately sent to the laboratory of the university-affiliated Hospital Escola Álvaro Alvim (HEAA). This hos-pital participates in the quality control program of the Bra-zilian Society of Clinical Pathology. Total cholesterol (TC) was determined with the cholesterol oxidase/peroxidase enzymatic method in a spectrophotometer. Serum trigly-cerides were established with the glycerol enzymatic method, and HDL-C was determined with the precipitating reactive method. LDL-C was calculated with the Friedewald formula as follows: LDL-C = (TC - HDL-C) – (TG/5), valid if TG < 400 mg/dL. Serum glycemia was established with the glucose oxidase method.
Data were collected by 8 interviewers (grouped into 4 pairs) selected at the Escola Técnica Estadual Barcelos Martins and trained for the interview, and how to measure weight, height, and blood pressure, and how to draw blood. Quality control of data collection was performed through permanent follow-up and supervision of the field work by the authors.
Participation in the study was voluntary and the par-ticipants could quit at any time. Data confidentiality was guaranteed by the research team. All individuals who re-fused to undergo blood collection or who were not found in the second visit were excluded from the study.
Normativeness of blood pressure measurement fol-lowed the criteria defined by the VI Joint National Com-mittee on Prevention, Detection, Evaluation, and Treatment of High Blood Pressure 30. Blood pressure was measured
The reference value of fasting glycemia used as the cut off point to classify individuals as diabetic or nondiabetic was 126 mg/dL, according to the Brazilian Consensus on Diabetes (2000) 31. Patients whose fasting glycemia was
between 126 and 200 mg/dL had their tests repeated for diagnostic confirmation using the same criterion. Patients who reported being then under treatment for diabetes were considered diabetic.
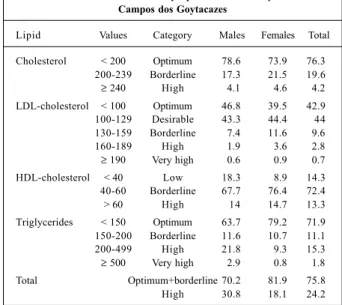
The classification of the reference values for total cho-lesterol, triglycerides, LDL-C, and HDL-C followed the cri-teria of the III Brazilian Guidelines on Dyslipidemia 1 (tab. I).
The following lipid levels classified as high and very high were used for defining prevalences: TC ≥ 240 mg/dL or HDL-C < 40 mg/dL or LDL-HDL-C ≥ 160 mg/dL or TG ≥ 200 mg/dL. The characterization of dyslipidemias involved the 4 altered pa-rameters in isolation or in association and the individuals with lipid disorders under specific medication.
Obesity and overweight were assessed through the calculation of body mass index (BMI) 32,33. Weight was
measured with the individuals lightly dressed and without shoes on a portable scale with a capacity for 120 kg and precision of 0.1 kg. In regard to height, tape measures with a 0.5-cm scale were used. People whose BMI was > 30 kg/m2
were considered obese, and those with BMI between 25 and 30 kg/m2 were considered overweight.
Waist circumference was measured with a nonexten-dable synthetic measuring tape scored in centimeters. The cut off points of 102 cm for males and 88 cm for females were used as reference values of very increased risk for metabolic complications associated with obesity in Caucasians 34.
The results were sent to the participants, and all hy-pertensive, diabetic, dyslipidemic, and obese patients were referred for follow-up in the outpatient care clinics at the HEAA.
Individuals who reported not undergoing regular physical exercise at a frequency ≥ twice a week with a mi-nimum duration of 30 minutes were considered sedentary.
The statistical analyses were processed using the Epi Info 6.04b program. The total and relative prevalences of dyslipidemias were calculated according to the stratifi-cation of the last consensus 1. The mean and standard
de-viation and its variation in regard to sex and age were deter-mined using the Student t test. The chi-square test was used for association between the lipid profile variables (dys-lipidemias, total cholesterol, triglycerides, HDL-C, and LDL-C) and the risk variables (sex, age, race, census sector, edu-cational level, familial history, smoking, sedentary lifestyle, overweight, obesity, waist measure, high blood pressure, and diabetes mellitus). No cut off point was established for P values, which were presented as calculated.
Results
This study assessed 1,039 individuals, 497 (47.8%) of whom were males and 663 (64.4%) were Caucasians. Age ranged from 18 to 96 (48.8±16.6) years.
The total prevalence of dyslipidemias adjusted for age was 24.2%. When stratifying the results according to the laboratory alterations, the following prevalences were obtained: hypercholesterolemia, 4.2%; high LDL-C, 3.5%; low HDL-C, 18.3%; and hypertriglyceridemia, 17.1%. The distribution of the results at intervals according to the reference values for the diagnosis of dyslipidemias may be seen in table I.
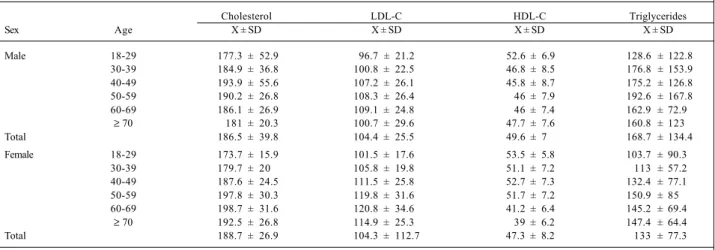
Table II shows the mean values and standard devia-tion of the lipid levels according to sex and age group, a po-sitive correlation (P<0.001) being observed in both cases. By determining the population mean, the following values were observed: cholesterolemia of 187.6±33.7 mg/dL; LDL-C of 108.7±26.8 mg/dL; HDL-LDL-C of 48.5±7.7 mg/dL; and trigly-ceridemia of 150.1±109.8 mg/dL.
The age group from 50 to 59 years had the greatest TC, LDL-C, and TG means, and the lowest HDL-C means. The TC means in the female sex exceeded those in the male sex from the fifth decade of life onwards. LDL-C levels were greater in females in all age groups, but, on the other hand, TG levels were greater in males.
The prevalence of dyslipidemias increased from 10.7% in the age group from 18 to 29 years to 37.7% in the age group from 50 to 59 years, a reduction to 31% being ob-served in individuals older than 70 years. Males had signi-ficantly greater indices than females did in regard to dysli-pidemias (30.8% vs 18.1%, P<0.001) and to TG (24.7% vs 10.1%, P<0.001). However, a greater prevalence of high LDL-C was observed in females (P<0.001). No relation bet-ween sex and hypercholesterolemia was observed (tab. III). A clear influence of the census sector on dyslipide-mias, and, consequently, of familial income, was observed, and it was more evident in individuals living in the poorest areas (P<0.001). However, the greater prevalence of
hyper-Table I – Prevalence of dyslipidemias in the city of Campos dos Goytacazes
Lipid Values Category Males Females Total
Cholesterol < 200 Optimum 78.6 73.9 76.3 200-239 Borderline 17.3 21.5 19.6 ≥ 240 High 4.1 4.6 4.2 LDL-cholesterol < 100 Optimum 46.8 39.5 42.9 100-129 Desirable 43.3 44.4 44 130-159 Borderline 7.4 11.6 9.6
160-189 High 1.9 3.6 2.8
≥ 190 Very high 0.6 0.9 0.7 HDL-cholesterol < 40 Low 18.3 8.9 14.3 40-60 Borderline 67.7 76.4 72.4 > 60 High 14 14.7 13.3 Triglycerides < 150 Optimum 63.7 79.2 71.9 150-200 Borderline 11.6 10.7 11.1 200-499 High 21.8 9.3 15.3 ≥ 500 Very high 2.9 0.8 1.8 Total Optimum+borderline 70.2 81.9 75.8 High 30.8 18.1 24.2
triglyceridemia was observed in the sectors whose income lay between 2 and 10 minimum wages.
Table III also shows the lack of influence of ethnicity, educational level, and smoking on the lipid profile. A certain familial tendency was observed in regard to dyslipidemias (P=0.01), as in regard to isolated values of LDL-C and TG.
Reference to a sedentary lifestyle showed a correla-tion with increasing levels of TG (P=0.02), and overweight also showed a correlation with dyslipidemias (TC, HDL-C, and TG). Abdominal fat build up, translated as an increase in the waist circumference, was positive in determining ele-vated indices of TC (P=0.03) and TG (P<0.001). Individuals with associated comorbidities, such as high blood pressure and diabetes mellitus, had a greater prevalence of dyslipi-demias (P<0.001).
Discussion
The overall prevalence of dyslipidemias was high, af-fecting approximately 1 in every 4 adults (24.2%) in Campos dos Goytacazes. This is alarming in face of the evident rela-tion between dyslipidemias and atherosclerotic disease 35.
Studies determining the prevalence of dyslipidemia in spe-cific locations are scarce. Martins et al 36,37 reported indices
of 53.4% and 21.3% in the city of Cotia, in the state of São Paulo, in 1989 and 1996, respectively. High lipid levels are predictive of consequent cardiovascular mortality in the near future in the population assessed. Stratifying dyslipi-demias in males and females, a significant relation with the male sex (30.8 vs. 18.1, P<0.001) was observed. This fact may determine the greater incidence of atherosclerotic disorders in males.
Through distribution according to age groups, a signi-ficant increase in the prevalence of dyslipidemias, hyper-cholesterolemia, and alterations in LDL-C and HDL-C was observed (P<0.001). This did not occur with hypertriglyce-ridemia, which was relatively constant from the fourth de-cade onwards. The high percentages in the advanced age
groups result in a greater number of individuals with cardio-vascular diseases, due to the increase in the world’s elder population 18,38.
Of the lipid parameters, total cholesterol was the most assessed in the studies published so far, and it had a wide range of variation. In the city of Campos dos Goytacazes, the prevalence of high lipid levels was 4.2%, and that of bor-derline levels was 19.6%. No variation according to sex was observed. North American studies report a prevalence of 18.9% 39. Nicolau et al reported a prevalence of high lipid
levels of 16% in individuals older than 29 years in the city of São José do Rio Preto in 199112, and of 7.9% in individuals
older than 20 years in 1997 40. Duncan et al 16 reported 14.9%
in the city of Porto Alegre. Gus et al 38 reported 5.6% in the
Brazilian state of Rio Grande do Sul. Guimarães and Lima 41
reported 18% in a population in the state of Bahia, and Rou-quayrol et al 42 reported 6.3% (³ 250 mg/dL) in the city of
For-taleza. The III Brazilian Guidelines on Dyslipidemias men-tions a study carried out in 9 Brazilian capitals, which deter-mined a prevalence of 8.8% 43. Souto Filho et al 13, using
la-boratory samples, estimated a prevalence of 14.3% in the northern and northwestern regions of the state of Rio de Ja-neiro and of 6.9% in the city of Campos dos Goytacazes. When compared with other locations, the latter city has 1 of the lowest prevalences of hypercholesterolemia.
A significant influence of age on lipid levels was ob-served. Among males, mean cholesterol was more elevated in the age group from 40 to 49 years, and decreased in older individuals. Among females, this maximal elevation occur-red later, in the age group from 60 to 69 years. Similar varia-tions were found in other studies 12,16,18,39. The reduction in
the mean and in the prevalence of high levels in individuals older than 70 years should be due to the longer survival of those without dyslipidemias 18. Comparing the sexes, the
mean values were higher in males up to the fifth decade, but, from this age onwards, females had the higher levels. This fact stresses the influence of estrogen on lipid profile. High and very high levels of LDL-C were found in 3.5%
Table II – Means and standard deviations of the serum levels of cholesterol, LDL-cholesterol, HDL-cholesterol, and triglycerides in males and females according to age group
Cholesterol LDL-C HDL-C Triglycerides
Sex Age X ± SD X ± SD X ± SD X ± SD
Male 18-29 177.3 ± 52.9 96.7 ± 21.2 52.6 ± 6.9 128.6 ± 122.8
30-39 184.9 ± 36.8 100.8 ± 22.5 46.8 ± 8.5 176.8 ± 153.9
40-49 193.9 ± 55.6 107.2 ± 26.1 45.8 ± 8.7 175.2 ± 126.8
50-59 190.2 ± 26.8 108.3 ± 26.4 46 ± 7.9 192.6 ± 167.8
60-69 186.1 ± 26.9 109.1 ± 24.8 46 ± 7.4 162.9 ± 72.9
≥ 70 181 ± 20.3 100.7 ± 29.6 47.7 ± 7.6 160.8 ± 123
Total 186.5 ± 39.8 104.4 ± 25.5 49.6 ± 7 168.7 ± 134.4
Female 18-29 173.7 ± 15.9 101.5 ± 17.6 53.5 ± 5.8 103.7 ± 90.3
30-39 179.7 ± 20 105.8 ± 19.8 51.1 ± 7.2 113 ± 57.2
40-49 187.6 ± 24.5 111.5 ± 25.8 52.7 ± 7.3 132.4 ± 77.1
50-59 197.8 ± 30.3 119.8 ± 31.6 51.7 ± 7.2 150.9 ± 85
60-69 198.7 ± 31.6 120.8 ± 34.6 41.2 ± 6.4 145.2 ± 69.4
≥ 70 192.5 ± 26.8 114.9 ± 25.3 39 ± 6.2 147.4 ± 64.4
Total 188.7 ± 26.9 104.3 ± 112.7 47.3 ± 8.2 133 ± 77.3
Table III – Prevalence of dyslipidemias according to demographic and socioeconomic variables, familial history, and morbidities assessed
Dyslipidemia High TC High LDL-C Low HDL-C High TG
Age
18-29 10.7 0.7 0.7 2.2 8.6
30-39 22.1 4.4 1.7 17.1 16.6
40-49 29.4 3.9 3.9 15.4 22.4
50-59 37.7 8.6 8.2 23.2 22.7
60-69 36.8 8.3 9.7 18.1 22.9
≥ 70 31 4.8 4.0 13.5 20.6
p<0.001 p=0.01 p<0.001 p<0.001 p=0.08
Sex
Male 30.8 4.1 2.5 18.3 24.7
Female 18.1 4.6 4.5 8.9 10.1
p<0.001 p=0.08 p=0.02 p<0.001 p<0.001
Ethnicity
Caucasian 30.5 6 5.3 16.5 20.2
Non-Caucasian 25.1 3.8 3.8 14.2 18.3
p=0.06 p=0.12 p=0.2 p=0.3 p=0.4
Census sector
A (< 1 SM) 33.3 8.8 7.8 19.9 18.9
B+C (2 to 10 SM) 25.4 2.2 2.2 12.6 20.9
D+E (> 10 SM) 11.1 0.6 0.6 2.2 8.9
p<0.001 p<0.001 p<0.001 p<0.001 p=0.1
Educational level
Low 29.4 5.3 4.8 15.9 20.5
High 26.9 5.4 4.6 15.2 17.3
p=0.3 p=0.9 p=0.9 p=0.7 p=0.2
Dyslipidemias in the family
Yes 35.2 7.3 7.8 18 24.5
No 26.7 4.7 4 15 18
p=0.01 p=0.12 p=0.01 p=0.26 p=0.03
Smoking
Yes 31.7 5 5 18.3 20
No 27.9 5.4 4.8 15.2 19.3
p=0.3 p=0.8 p=0.9 p=0.2 p=0.7
Sedentary lifestyle
Yes 29.7 5.4 5 16.4 21.3
No 26 5.1 4.5 14.1 15.1
p=0.2 p=0.8 p=0.7 p=0.3 p=0.02
Overweight
Yes 33.8 6.5 4.8 19.1 24.6
No 22.4 3.8 4.9 11.6 13.3
p<0.001 p=0.04 p=0.9 p<0.001 p<0.001
Obesity
Yes 36.8 5.7 2.1 21.2 30.6
No 26.7 5.2 5.5 14.4 16.9
p<0.001 p=0.7 p=0.04 p=0.02 p<0.001
Waist circumference
Icreased 34.9 7.4 4.7 18.3 26.3
Normal 25.5 4.3 4.9 14.4 16.1
p<0.001 p=0.03 p=0.9 p=0.1 p<0.001
High blood pressure
Yes 35.3 6.9 6 19.1 24.1
No 24 4.2 4 13.4 16.3
p<0.001 p=0.05 p=0.15 p=0.01 p=0.001
Diabetes
Yes 56.5 14.1 9.5 33.3 42.4
No 26.1 4.5 4.4 14.2 17.4
p<0.001 p<0.001 p=0.03 p<0.001 p<0.001
Data in %. The following parameters considered high and very high by the III Brazilian Guidelines on Dyslipidemias were used as cut off points: TC ≥ 240 mg/ dL, LDL-C ≥ 160 mg/dL, HDL-C < 40 mg/dL, and TG ≥ 200 mg/dL (n=1.039).
of the population and borderline levels in 9.6% 1. This fact
shows the need to determine targets to reduce the risk of coronary events in 13.1% of the adult population, both through changes in lifestyle and pharmacological therapy. Studies on specific populations, such as individuals with coronary artery disease, have reported risks of 14.8% 11 and
38.5% 22, but in a laboratory sample the risk was 31.1% 15.
Al-terations in LDL-C levels predominated in the female sex (4.2% vs 2.5%, P=0.02), different from the North American findings 39 (males, 20.4%; females, 17%).
mg/dL). This fact did not occur in the evaluation of LDL-C, whose means were always within desirable levels (100-129 mg/dL), except for males between 18 and 29 years, who had optimum values (< 100 mg/dL). In a population with mean normal cholesterolemia, LDL-C levels may be high, sho-wing the actual need for studies encompassing the entire lipid profile, because LDL-C is an independent causal factor of atherosclerosis and an element that determines the tar-gets for the treatment of dyslipidemias 1.
The incidence of HDL-C levels lower than 40 mg/dL was 14.3%. The alteration in the reference value, according to new recommendations 1, generated some difficulties in
the comparison with previous studies. Low HDL-C levels corresponded to the second most frequent dyslipidemia in the city of Campos dos Goytacazes, and it was significantly greater in males (18.3% vs 8.9%, P<0.001). The mean HDL-C levels were relatively constant (between 48.9 and 47.3 mg/ dL) in individuals older than 30 years, similarly to that which was reported in other population groups 11,40,44 , and more
elevated when compared with those of patients with coro-nary artery disease 22,29. In the male sex, the mean values
re-mained relatively constant with aging, ranging from 46.8 to 47.7 mg/dL from the third decade onwards. On the other hand, in females, a mean above 50 mg/dL was observed until the age group from 50 to 59 years. More elevated HDL-C levels in the female sex has also been reported in other publi-cations 28,45. However, from the fifth decade onwards, an
im-portant drop in the HDL-C levels has been reported and has been directly related to an increase in the risk of coronary ar-tery disease in females at an advanced age 46.
With a prevalence of 17.1%, hypertriglyceridemia was the most prevalent dyslipidemia. The levels were consis-tently greater in the male sex, with a greater mean (168.7 vs 133.0 mg/dL) and prevalence (24.7% vs 10.1%, P<0.001). More elevated levels in both sexes were found in the sixth decade, being followed by a reduction in older individuals. When stratifying individuals into Caucasian and non-Caucasian, the correlation between lipid alterations and eth-nicity could not be determined. No variation in the lipid le-vels of individuals with a high or low educational level was observed.
The prevalence of dyslipidemias and hypercholes-terolemia was significantly different when the social strata were compared. Levels of 33.3% were detected in socio-economic levels of up to 1 MW, and a reduction in the in-dices was observed as familial income increased. This same correlation was also present in the evaluation of TC, LDL-C, HDL-C (P<0.001), and TG (P<0.01). These results disagree with those of Rouquayrol et al 42, who, evaluating the
po-pulation of the city of Fortaleza, reported greater hypercho-lesterolemia indices (14.1% vs 2.8%) in individuals living in mansions as compared with those living in shantytowns. On the other hand, Rose and Marmot 47 reported
concor-dant data between morbidity and mortality due to cardio-vascular disease and lower socioeconomic classes.
The indices of dyslipidemias in individuals with a positive familial history were 35.2% versus 26.7% (P=0.01).
A similar correlation was observed in regard to the elevation in LDL-C and triglycerides. Some studies 29,48 have
determi-ned a familial influence in the origin of dyslipidemias, be-cause the individuals are exposed to common environmen-tal factors or because of a direct genetic predisposition.
No difference in the lipid levels of smokers and nons-mokers was observed. Although some studies 1,49 have
shown an association between smoking and a reduction in HDL-C levels, this was not a significant factor in our study (smokers, 18.3%, and nonsmokers, 15.2%, P=0.2). This may have resulted from the fact that all individuals who smoked were classified as smokers, independent of the tobacco load. In regard to sedentary lifestyle, the only significantly increased lipids were triglycerides (P=0.02). Sedentary lifestyle plays a significant role as a risk factor for atheros-clerosis 1,50, and changes in lifestyle with the introduction of
physical exercise are essential for prevention and treat-ment of atherosclerosis 1,51. The impact of physical activity
occurs mainly in the form of a reduction in triglyceride levels and an increase in HDL-C 1,52. However, no relevant
differences were observed between the HDL-C levels in in-dividuals with sedentary and nonsedentary lifestyles, and this was also reported by Sartori et al 28.
A correlation between the dyslipidemias and over-weight and obesity (P<0.001) was observed. Cholesterol levels were significantly elevated in overweight individuals (overweight + obesity) (P=0.04). On the other hand, high LDL-C levels had a greater association with obesity (P=0.04) as compared with those of total cholesterol (p=NS). In obese individuals, the particles of LDL-C are smaller and denser, inducing the more intense formation of fat cells 1,53.
The major dyslipidemias observed in obese individuals were hypertriglyceridemia (P<0.001) and the reduction in HDL-C (P=0.02), in accordance with other studies 54-57.
The build-up of abdominal fat characterized by central or androgenic obesity results in a greater risk for atheros-clerosis 1,34,58. Those individuals had a greater prevalence of
dyslipidemias, hypercholesterolemia, and hypertriglyceri-demia (tab. III). The abdominal fatty tissue has a greater me-tabolic activity, releasing large amounts of free fatty acids that cause an increase in triglycerides 55. At the same time,
no change in LDL-C and HDL-C levels was observed. Blood pressure levels ≥ 140x90 mmHg correlated with greater indices of dyslipidemias, hypercholesterolemia, and hypertriglyceridemia, and lower HDL-C levels. This association has also been reported in some studies in regard to high levels of cholesterol 12,59 and non-HDL-cholesterol 59.
No change in LDL-C was observed with increased blood pressure. These results suggest a biological interrelation between blood pressure and blood lipids, and, consequen-tly, an association with the risk for atherosclerosis.
levels (P=0.03). The lipid abnormalities in diabetic indivi-duals are consequent to insulin resistance and manifest as hypertriglyceridemia and low HDL-C levels 60, in accordance
with the results obtained.
The dyslipidemias were more frequent than expected, and routine investigations are required for early diagnosis in asymptomatic individuals. The accurate determination of the prevalence of dyslipidemias allows adequate planning of health actions for primary and secondary prevention of cardiovascular disorders in the population of Campos dos
Goytacazes. Therefore, broader population studies are re-quired to determine not only regional characteristics, but also the national lipid profile.
Acknowledgements
We thank the Secretaria Municipal de Saúde de Cam-pos dos Goytacazes for financial support, and Drs. Márcio Sidney Pessanha de Souza and Nérton Pinto Fernandes Távora for the support and encouragement.
References
1. III Diretrizes brasileiras sobre dislipidemias e diretriz de prevenção da ateros-clerose do Departamento de Aterosateros-clerose da Sociedade Brasileira de Cardiolo-gia. Arq Bras Cardiol 2001; 77(sup.III).
2. Lotufo PA. Epidemiologia das doenças cardíacas no Brasil: histórico, situação atual e proposta de modelo teórico. Rev Soc Cardiol Estado de São Paulo 1996; 6:541-7.
3. Mion Junior D, Nobre F. Risco Cardiovascular Global. São Paulo: Lemos Editorial, 1999. 4:66-74 / 6:103-6.
4. III Consenso Brasileiro de Hipertensão Arterial, Campos dos Jordão-SP, 12 à 15 de fevereiro de 1998, 38p.
5. Shephered J, Cobbe SM, Ford I, et al. Prevention of coronary heart disease with pravastatin in men with hypercholesterolemia. N Engl J Med 1995; 333:1301-7. 6. Downs Jr, Cearfield M, Weis S, et al. Primary prevention of acute coronary events with lovastatin in men and women with average cholesterol levels: results of AFCAPS/TexCAPS. JAMA 1998; 279:1615-22.
7. Scandinavian Sinvastatin Survival Study Group. Randomized trial of choles-terol lowering in 4444 patients with coronary heart disease: the Scandinavian Sinvastatin Survival Study (4S). Lancet 1994; 1383-5.
8. Sacks FM, Pfeffer MA, Moye LA, et al. The effect of pravastatin on coronary events after myocardial infarction in patients with average cholesterol level. N Engl J Med 1996; 335:1001-9.
9. The Long-term Intervention with Pravastatin in Ischaemic Disease (LIPID) Stu-dy Group. N Engl J Med 1998; 339:1349-57.
10. Executive Summary of the Third Report of the National Cholesterol Education Program (NCEP) Expert Panel on Detection, Evaluation, and Treatment of High Blood Cholesterol in Adults (Adults Treatment Panel III). JAMA 2001; 285: 2486-97.
11. Luz PL, Carvalho MEA, Cardoso RHA, Gallucci SDB, Pileggi F. Incidência de dislipidemia e sua relação com doença arterial coronária em populações brasileiras. Arq Bras Cardiol 1990; 54:257-64.
12. Nicolau JC, Bechara DL, Nascimento SDG, Greco OT, Jacob JLB, Lorga AM. Perfil do colesterol na cidade de São José do Rio Preto. Arq Bras Cardiol 1992;59: 433-40.
13. Souto Filho JTD, Saad RWCG, Souto JTD, Saad PRG, Guimarães FC, Dutra VO. Avaliação do perfil lipídico em uma amostra selecionada da população do norte e noroeste fluminense. NewsLab 2000; 8:96-106.
14. Bertolami MC, Faludi AA, Latorre MRDO, Zaidam Filho T. Perfil lipídico de funcionários de industria metalúrgica e sua relação com outros fatores de risco. Arq Bras Cardiol 1993; 60:293-9.
15. Lessa I, Conceição JL, Souza ML, et al. Prevalência de dislipidemias em adultos da demanda laboratorial de Salvador, Brasil. Arq Bras Cardiol 1997;69:395-400. 16. Duncan BB, Berger C, Silva MLS, Bassanesi SL, Achutti AC. Níveis séricos de
colesterol em amostra representativa da população adulta de Porto Alegre. Arq Bras Cardiol 1988; 51:385-90.
17. Figueira JL, Netto MP, Carvalho Filho ET, et al. Perfil Lipídico em indivíduos idosos normais. Arq Bras Cardiol 1987; 48: 77-81.
18. Mendonça SCL, Jorge PT. Prevalência de dislipidemias em uma população com mais de 50 anos. Arq Bras Endocrinol Metabol 1997; 41:183-7.
19. Selik M, Selik MO, Lima AD, Onishi MHO, Seki MO, Oliveira LAG. Estudo do perfil lipídico de crianças e jovens até 19 anos de idade. J Bras Patol 2001; 37: 247-51. 20. Moura EC, Castro CM, Mellin AS, Figueiredo DB. Perfil lipídico em escolares de
Campinas, SP, Brasil. Rev Saúde Pública 2000; 34:499-505.
21. Reis RS, Bensenor IJ, Lotufo PA. Avaliação laboratorial do indivíduo hiper-tenso: validade das principais diretrizes em hipertensão. Arq Bras Cardiol 1999; 73: 201-5.
22. Ladeia AM, Guimarâes AC, Lima JC. Perfil lipídico e doença arterial coronariana. Arq Bras Cardiol 1994; 63: 101-6.
23. Fisberg RM, Stella RH, Morimoto JM, Pasquali LS, Philippi ST, Latorre MRDO. Perfil lipídico de estudantes de nutrição e a sua associação com fatores de risco para doenças cardiovasculares. Arq Bras Cardiol 2001; 76: 137-42. 24. Nogueira AR, Alves PM, Miranda RF, Boechat NL. Colesterol e outros fatores
de risco cardiovasculares nos servidores da UFRJ: prevalência e influência de variáveis sociais. Arq Bras Cardiol 1990; 55:227-32.
25. Pereira LSM, Souza OF, Carvalho PTR, et al. Avaliação dos fatores de risco cardiovasculares em advogados do Rio de Janeiro. Rev Soc Cardiol Estado do Rio de Janeiro 1992; 4:120-4.
26. Forti N, Santomauro AC, Jubelino FRS, et al. Prevenção primária e doença arterial coronariana: identificação dos fatores de risco em servidores públicos da Muni-cipalidade de São Paulo. Rev Bras Med 1990; 47:343-54.
27. Dioguardi GS, Pimenta J, Knoplich J, Ghorayeb N, Ramos LR, Giannini SD. Fatores de risco para doenças cardiovasculares em médicos: dados preliminares do projeto VIDAM da Associação Paulista de Medicina. Arq Bras Cardiol 1994; 62:383-8.
28. Sartori FA, Magna LA, Pilotto R, Freitas B, Cunha GP. Levantamento epidemiológico sobre HDL-colesterol e outros fatores de risco coronário em comunidade hospitalar. Arq Bras Cardiol 1987; 49: 211-5.
29. Giannini SD, Deveriacki BE, Góis JM et al. Prevalência de dislipidemias primárias em indivíduos com e sem história familiar de coronariopatia, tendo com referência os valores do “National Cholesterol Educational Program” (NCEP). Arq Bras Cardiol 1992; 58:281-7.
30. VI Joint National Committee. The Sixth Report of the Joint National Committee on Prevention, Dection, Evaluation, and Treatment of High Blood Pressure. Arch Intern Med 1997; 157:2414-46.
31. Sociedade Brasileira de Diabetes. Consenso brasileiro sobre diabetes: diagnóstico e classificação do diabetes mellitus e tratamento do diabetes mellitus tipo 2, 2000. 32. WHO Consultation on Obesity. Obesity: prevention and managing: the global
epidemic. Report of a WHO Consultation on Obesity. Geneva, 3-5 June 1997. 33. I Consenso Latino Americano de Obesidade, Associação Brasileira de Estudos
Sobre Obesidade. http://www.abeso.org.br, acessado em 02/03/2002. 34. Han TS, van Lee EM, Seidell JC, Lean ME. Waist circumference action levels in
the identification of cardiovascular risk factors: prevalence study in a random sample. Br Med J 1995; 331:1401-5.
35. Anderson KM, Castelli WP, Levy DL. Cholesterol and mortality: 30 years of follow-up from de Framinghan Study. JAMA 1987; 258:2176-2180. 36. Martins IS, Coelho LT, Matos IMS, Mazzilli RN, Trigo M, Wilson D.
Disli-pidemias e alguns fatores de risco associados em uma população periférica da região metropolitana de São Paulo-SP, Brasil: um estudo piloto. Rev Saúde Pública 1989; 23:236-43.
37. Martins IS, Marucci MFN, Cervato AM, Okani ET, Mazzilli RN, Casajus MI. Doenças cardiovasculares ateroscleróticas, dislipidemias, hipertensão, obe-sidade e diabetes melito em população da área metropolitana da região Sudeste do Brasil: II – Dislipidemias. Rev Saúde Pública 1996;30:75-84.
38. Gus I, Fischmann A, Medina C. Prevalência dos fatores de risco da doença coro-nariana no estado do Rio Grande do Sul. Arq Bras Cardiol 2002; 78:478-83. 39. National Health And Nutriotion Examination Survey (NHANES III), 1988-94,
Centers of Disease Control/National Center for Health Statistics. American Heart Association . http://www.americanheart.org, acessado em 09/05/2001. 40. Nicolau JC, Nogueira C, Maia LN, Ramires JAF. Evolução dos níveis de colesterol
41. Guimarães A, Lima JC. Perfil do nível do colesterol sanguíneo em comunidades bahianas. Arq Bras Cardiol 1991; 57:C15.
42. Rouquayrol MZ, Veras FMF, Vasconcelos JS, Bezerra RCF, Gomes ILP, Bezerra FAF. Fatores de risco na doença coronariana: inquérito epidemiológico em estratos habitacionais de um bairro de Fortaleza. Arq Bras Cardiol 1987; 49:339-47. 43. Guimarães AC, Lima M, Mota E. The cholesterol level of a selected Brazilian
salaried population. CVD Prevention 1998; 1:306-17.
44. Assman G, Schulte H. Results and conclusions of the Prospective Cardiovascu-lar Münster (PROCAM) Study. In: Lipid Metabolism Disorders and Coronary Heart Disease, 2a ed. G. Assmann, ed. Munich: MMV Edizin Verlag GmbH
München 1993: 19-67.
45. Heiss C, Tamir I, Davis CE, et al. Lipoprotein cholesterol distributions in select North American populations. The Lipid Research Clinics Program Prevalence Study. Circulation 1980; 61:302.
46. Gordon T, Castelli WP, Hjortland MC, Kannel WB, Dawber TR. High density lipoprotein as a protective factor agains coronary heart desease: the Framingham Study. Am J Med 1977; 62:707.
47. Rose G, Marmot MG. Social class and coronary heart disease. Br Heart J 1981; 45:13. 48. Morrison JA, Namboodiri K, Green P. Familial aggregation of lipids and lipoproteins and early identification of dysbetalipoproteinemia: the collabora-tive lipid research clinics family study. JAMA 1983; 250:1860-8.
49. Facchini FS, Hollenbeck CB, Jeppesen J, et al. Insulin resistence and cigarette smoking. Lancet 1992; 339:1128-30.
50. Kannel WB, Belanger A, D’Agostino R, Israel I. Physical activity and physical demand on the job and risk for early-onset coronary artery disease. Am J Clin Nutr 1994; 59:940-8.
51. Ornish D, Scherwitz LW, Billings JH, et al. Intensive lifestyle changes for re-versal of coronay heart disease. JAMA 1998; 280:2001-7.
52. Després JP, Lamarche B. Low-intensity endurance exercise training, plasma lipoproteins and risk of coronary heart disease. J Intern Med 1994; 236:7-22. 53. Lamarche B, Tchermof A, Mauriege P, et al. Fasting insulin and apolipoprotein B
levels and low-density lipoprotein particle size as risk factors for ischemic heart disease. JAMA 1998; 279:1955-61.
54. Hubert HB, Feinleib M, McNamara PM, et al. Obesity as na independet risk factor for cardiovascular disease: a 26-year follow-up of participants in the Framingham Heart. Circulation 1983; 67:968-77.
55. Diretrizes para cardiologistas sobre excesso de peso e doença cardiovascular dos Departamentos de Aterosclerose, Cardiologia Clínica e FUNCOR da Socie-dade Brasileira de Cardiologia. Arq Bras Cardiol 2002;78(sup.I).
56. Lotufo PA. Mortalidade precoce por doenças do coração no Brasil: comparação com outros paises. Arq Bras Cardiol 1998; 70:321-5.
57. Calle EE, Thun MJ, Petrelli JM, Rodriguez C, Health CW Jr. Body mass index and mortality in a prospective cohort of US adults. N Eng J Med 1999; 341:1097-105. 58. National Heart, Lung, and Blood Institute/National Institutes of Diabetes and Digestive and Kidney Diseases. Clinical guidelines on the identification, evaluation and treatment of overweight and obesity in adults: the evidence report. Bethesda: National Institutes of Helth 1998:1-228.
59. Bonaa KH, Thelle DS. Association between blood pressure and serum lipids in a population: the Tromso Study. Circulation 1991 ;83:1305-14