Bruno Martinelli
, Silvia Regina Barrile
, Eduardo Aguilar Arca
, Roberto Jorge da Silva Franco
, Luis Cuadrado
Martin
1Faculdade de Medicina de Botucatu - UNESP1, Botucatu, SP; Universidade Sagrado Coração - USC2, Bauru, SP - Brazil
Mailing address: Bruno Martinelli •
Rua Emílio Carlos, 215 - Santa Tereza - 14940-000 - Ibitinga, SP - Brazil E-mail: [email protected]
Manuscript received November 18, 2008; revised manuscript received December 21, 2009; accepted February 25, 2010.
Abstract
Background: The activity of the renin-angiotensin-aldosterone system (RAAS) is directly related to overweight and sedentary lifestyles, both of which are associated with hypertension. Aerobic exercise helps control blood pressure (BP) by acting on mechanisms of blood pressure regulation, such as plasma renin activity (PRA).
Objective: To assess the effect of aerobic exercise on plasma renin activity in overweight hypertensive patients.
Methods: Blood pressure, serum biochemistry and anthropometric parameters of twenty subjects were measured before and after a 16-week exercise training program, three days a week, at 60-80% of maximal heart rate. Data were expressed as mean ± standard deviation or median and interquartile range and analyzed using the student’s t-test, Mann-Whitney test, and ANOVA (p < 0.05).
Results: Mean age of the study population was 57 ± 7.0, and mean body mass index was 30 ± 3.5 kg/m2. The aerobic
training decreased body fat (35 ± 7.8 to 30 ± 5.6 %), heart rate (HR) (80 ± 10.4 to 77 ± 8.5 bpm), and pulse pressure (PP) (50 ± 11.8 to 46 ± 10.0 mmHg) (p < 0.05), but not plasma renin activity, which ranged from 0.8 (0.45-2.0) to 1.45 (0.8-2.15) ηg/ml/h (p = 0.055). The group that achieved a reduction in waist circumference (WC) (n = 8) experienced also a reduction in systolic BP and PP (p < 0.05). In the group without reduction in WC, none of the BP variables changed. Plasma renin activity (PRA) was not associated with any variable studied. Aerobic training was associated with a decrease in PP in the study group as a whole and with a decrease in systolic BP in the subgroup who experienced a decrease in waist circumference.
Conclusion: The aerobic exercise training failed to reduce plasma renin activity in overweight hypertensive patients. (Arq Bras Cardiol. 2010; [online]. ahead print, PP.0-0)
Key words: Exercise; renin; hypertension/therapy; overweight; obesity.
Introduction
A number of studies have shown a positive correlation between body mass index (BMI) and elevated plasma renin activity (PRA), which is one of the mechanisms involved in the regulation of blood pressure (BP). Plasma renin activity is significantly higher in obese patients than in lean normotensive subjects, regardless of blood pressure; therefore, the activation of the renin-angiotensin-aldosterone system (RAAS) is implicated in arterial hypertension (AH) and obesity1-4. Central
obesity seems to be the strongest predictor of elevated blood pressure5.
Components of the RAAS produced by adipocytes are thought to play an autocrine, paracrine and/or endocrine role in the pathophysiology of obesity, providing a potential pathway through which obesity leads to hypertension. By the same token, these components may favor the accumulation
of adipose tissue6.
By favoring obesity and hypertension, a sedentary lifestyle may be associated with upregulation of plasma renin activity7,
leading to a significant increase in mortality and morbidity, since RAAS components may impair the cardiovascular system, directly and independently of blood pressure elevation8,9.
Due to the role of the adipose tissue in producing RAAS elements and to its influence on cardiovascular structures, the relationship between obesity, lifestyle, hypertension, and RAAS activity must be investigated10-13. There are conflicting
reports in the literature regarding the chronic effect of physical exercise on plasma renin activity. Some studies were performed in normotensive subjects14-16, whereas others were
performed in hypertensive patients17-26.
Methods
Twenty hypertensive patients with BMI greater than 25 kg/ m2, classified as overweight according to the World Health
Organization (WHO)27, underwent cardiac examination,
physiotherapeutic assessment and biochemical studies before and after a 16-week exercise training program.
The study was approved by the Research Ethics Committee (File No. 0081/2004) in accordance with Resolution 196/96 of the Conselho Nacional de Saúde (National Health Board). Written informed consent was obtained from all patients.
Inclusion criteria were patients with stage I or II essential hypertension according to the Fifth Brazilian Guidelines for Arterial Hypertension (DBHA)28; ages ranging from 49 to 69
years; categorized as physically inactive by the International Physical Activity Questionnaire29; with exercise stress test
negative for coronary artery disease or hyper-reactivity to exercise. All patients were taking antihypertensive medication. Patients with coronary artery disease (CAD), coronary heart disease (CHD) or peripheral vascular disease (PVD); disabling orthopedic conditions; severe endocrine, neurological or pulmonary diseases; valvular heart disease; liver failure; neoplasias; and alcohol abuse were excluded from the study, as were those who needed to switch to a different class of drug or change the dosage during the study protocol.
Blood pressure was measured by the auscultatory method28
with aneroid sphygmomanometers (Premium, Glicomed™, Brazil). At the beginning of the study, blood pressure was measured at three consecutive weekly visits. On each occasion, measurements were taken three times, two minutes apart, and the mean value was recorded. The values obtained at the third week were considered as baseline values. The final evaluation was performed at three consecutive visits during the last week of the training protocol, when measurements were taken with the patients at rest at least 24 hours after the last exercise training. Blood pressure was also measured three times during each visit, and the mean value of the three readings was used.
Mean BP was calculated as the diastolic pressure plus one-third of the pulse pressure (PP). Pulse pressure was calculated by subtracting diastolic (DBP) from systolic (SBP) blood pressure. At each visit, heart rate (HR) was also measured by palpating the radial artery.
Body weight and height were measured using a medical scale with a stadiometer (PL 180™, Filizola, Brazil), and body mass index (BMI) was calculated as body weight divided by the height squared (kg/m2)30. Skinfold thickness was measured
on the right side of the body (Lange Skinfold Caliber, Beta Technology, Cambridge) at the biceps, triceps, subscapular, and suprailiac sites, and percentage of body fat was calculated using the Durnin and Rahaman formula31. Waist (WC) and hip
(HC) circumferences were measured with a measuring tape (Corrente™, Brazil) according to the guidelines of the World Health Organization32.
Laboratory tests for plasma renin activity (hg/ml/hr, radioimmunoassay after 2 hours of standing), calcium, sodium, potassium, urea, creatinine, glucose, total and fractional cholesterol, triglycerides, and uric acid were all
performed early in the morning after an overnight fast of 12 hours. Urine collected over the previous 24 hours was used to measure sodium levels. All subjects maintained their daily medications, even if they interfered with the renin-angiotensin-aldosterone system11. Biochemical analyses were
performed 48 hours after each phase to eliminate the acute effect of exercise following training18.
Physiotherapeutic assessment, including blood pressure and anthropometric measurements already mentioned, together with biochemistry, were performed before and after the aerobic training protocol.
The aerobic training was conducted according to guidelines published previously33, which can be briefly described as
follows: 40 minutes of exercise on a cycle ergometer at 60-80% of maximal heart rate (HRmax), measured every 10 minutes. Exercise training was performed three times per week for 16 weeks, and consisted of stationary cycling or walking at the same intensity. Blood pressure and heart rate were measured at the beginning and at the end of the protocol. No dietary intervention was included in this training protocol.
Composition of the Subgroups
Study subjects were divided into two groups according to their waist circumference response to the aerobic training: patients who experienced a reduction in waist circumference equal to or greater than 2 cm (WC1) and patients who did not (WC2).
Statistical Analysis
The following statistical tests were applied: the Student’s
t-test for independent samples to compare groups; repeated-measures t-test to compare pre- and post-training time points for normally distributed variables; and the Mann-Whitney test for non-normally distributed variables. Repeated-measures analysis of variance (ANOVA) was used to evaluate blood pressure before the exercise training protocol was initiated. Parametrically distributed variables were expressed as means ± standard deviations, and non-parametrically distributed variables were expressed as medians and interquartile ranges. The statistical significance level was set at p < 0.05.
This study was supported by a grant from Fundunesp -
Fundação para o desenvolvimento da UNESP.
Results
The mean age of the 20 hypertensive patients studied was 57 ± 7.1, and they were mostly female (n = 14.70%). Of these patients, 15 were Caucasian (75%), three were Black or mixed-race (15%), and two were Asian (10%). Table 1 shows the main anthropometric characteristics of the patients at baseline and after completion of the exercise training protocol. All volunteers reached the training heart rate (THR), with a predominance of the lower limit (60% of HRmax).
Table 1 - Anthropometric parameters at baseline and after four months of aerobic protocol
Anthropometric parameters Time point p
Initial Final
Body weight (kg) 77±10.6 76±11.5 0.119
BMI (kg/m2) 30±3.5 30±3.6 0.377
HC (cm) 108±8.52 107±8.8 0.317
WC (cm) 102±9.2 100±9.6 0.218
Biceps skinfold (mm) 17±7.02 16±7.2 0.217
Triceps skinfold (mm) 24±8.1 21±8.1* 0.007
Subscapular skinfold (mm) 31±8.03 28±8.1* 0.015
Suprailiac skinfold (mm) 29±8.6 25±8.2* 0.005
Body fat (%) 35±7.8 30±5.6* 0.001
Values expressed as mean ± standard deviation; BMI - body mass index; HC - hip circumference; WC - waist circumference; * p<0.05.
± 8.1 mm), and suprailiac (29 ± 8.6 mm to 25 ± 8.2 mm) skinfolds, as well as in percentage of body fat (35 ± 7.8 mm to 30 ± 5,6 mm; p < 0.001).
As far as antihypertensive medication is concerned, 12 subjects (60%) were taking angiotensin-converting enzyme inhibitors; seven (35%) were taking b-blockers; 6 (30%) were taking diuretics; two (10%) were taking calcium channel blockers; two (10%) were taking angiotensin II type I receptor blocker (A-II); and one (5%) was taking alpha-beta blockers. Nine volunteers (45%) were using two or more classes of drugs. The antihypertensive drugs remained unchanged throughout the aerobic training protocol.
Mean SBP and DBP, respectively, were 138 ± 17.0 and 88 ± 12.4 mmHg at the first visit, 135 ± 19.3 and 85 ± 13.1 mmHg at the second visit, and 133 ± 15.9 and 81 ± 9.1 mmHg at the third visit before the aerobic training protocol was initiated. No statistically significant change was found in SBP (p = 0.250). DBP decreased at the third visit, compared with the first visit (p = 0.022).
Table 2 shows pre- (last BP of the three consecutive weekly visits before protocol implementation) and post-training BP and HR measurements, in addition to mean BP of the three readings of the last week of training.
There was no statistically significant difference in resting SBP and DBP after the aerobic training (p > 0.05). There
Table 2 - Values expressed as mean ± standard deviation; BMI - body mass index; HC – hip circumference; WC - waist circumference; * p<0.05
Variables Time point p
Initial Final
SBP (mmHg) 133±15.9 129±12.3 0.328
DBP (mmHg) 81±9.1 83±8.5 0.409
Mean BP (mmHg) 98±10.3 98±8.7 0.970
Pulse pressure (mmHg) 52±12.1 46±10.1 0.050
Heart rate (bpm) 80.7±10.43 77.6±8.52 0.050
Values expressed as mean ± standard deviation; SBP - systolic blood pressure; DBP -Diastolic blood pressure; Mean BP - mean blood pressure; * p<0.05.
was a borderline statistically significant reduction in PP and HR (p = 0.050).
At baseline, plasma renin activity (PRA) levels were low in 13 subjects, normal in five and high in two. Normal values of standing plasma renin activity were considered to be 0.98 to 4.18 hg/ml/hr. No changes in biochemical parameters were observed after the aerobic exercise protocol. There was a borderline statistically significant increase in plasma renin activity (p = 0.055) (Table 3).
Study subjects were divided into the following two groups according to their waist circumference response to aerobic training. The WC1 group consisted of eight subjects (one man and seven women), mean age of 60 ± 6.2 and mean BMI of 30 ± 3.4 kg/m2. The WC
2 group consisted of 12 subjects (five
men and seven women), mean age of 54 ± 6.6 (p = 0.072
vs. group WC1) and BMI of 31 ± 3.9 kg/m2. There were no
statistically significant differences in any of the anthropometric parameters studied between the two groups (Table 4). This was also true for baseline SBP and DBP. Systolic BP and PP decreased in the WC1 group. As summarized in Table 5, DBP remained unchanged in the WC1 group and increased in the WC2 group (p < 0.05) (Table 5).
Table 3 - Biochemical variables at baseline and after four months of aerobic training
Biochemical variables Time point
Initial Final p
PRA (ng/ml/hr) 0.8 (0.45-2.0) 1.45 (0.8-2.15) 0.055
24-hour sodium (meq/24hr) 193.35±65.06 207.05±89.85 0.437
PRA - plasma renin activity. Values expressed as median and interquartile range for PRA. Values expressed as mean ± standard deviation for 24-hour sodium; p<0.05.
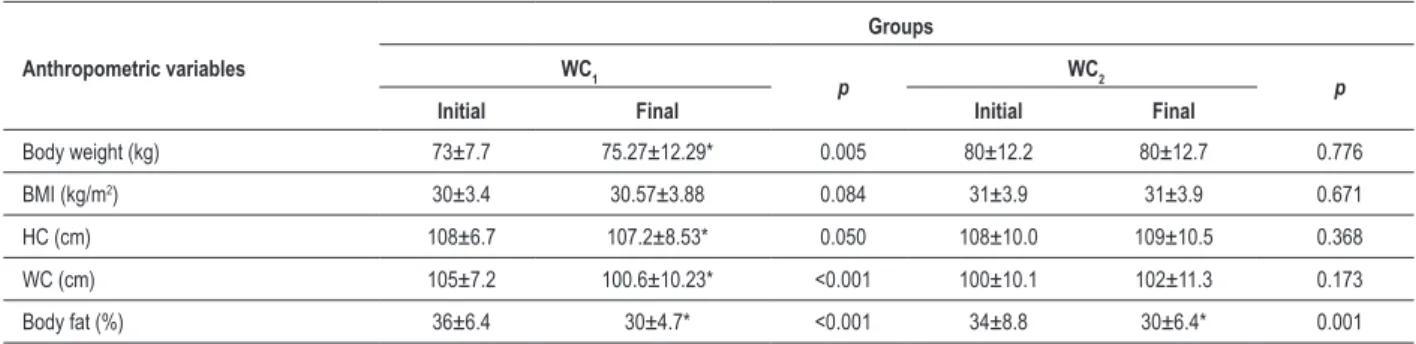
Table 4 - Anthropometric measurements at baseline and at the end of the aerobic training protocol according to waist circumference: WC1 (reduction) and WC2 (no reduction)
Anthropometric variables
Groups WC1
p WC2 p
Initial Final Initial Final
Body weight (kg) 73±7.7 75.27±12.29* 0.005 80±12.2 80±12.7 0.776
BMI (kg/m2) 30±3.4 30.57±3.88 0.084 31±3.9 31±3.9 0.671
HC (cm) 108±6.7 107.2±8.53* 0.050 108±10.0 109±10.5 0.368
WC (cm) 105±7.2 100.6±10.23* <0.001 100±10.1 102±11.3 0.173
Body fat (%) 36±6.4 30±4.7* <0.001 34±8.8 30±6.4* 0.001
Values expressed as mean ± standard deviation. BMI - body mass index; HC - hip circumference; WC - waist circumference; WHR - waist-to-hip ratio. *: p<0.05 ; Comparison before and after the exercise training.
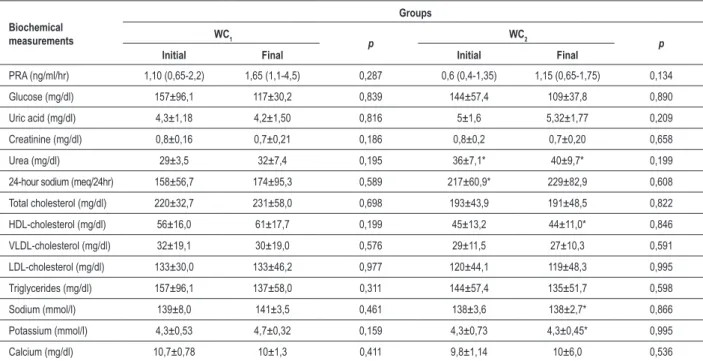
any of the parameters (Table 6). However, the two groups differed (p < 0.05) regarding urine urea and 24-hour urinary sodium excretion at baseline and regarding serum urea, HDL-cholesterol, sodium and potassium at the end of the exercise protocol. When both groups were compared, urea levels (mg/dl) were higher (p < 0.05) in the WC2 group both at baseline and at protocol completion. The 24-hour urinary sodium excretion (mEq/24hr) did not change after training in both groups, but at baseline it was higher in the WC2 group (p < 0.05). HDL-cholesterol did not change with the protocol, and it was higher in the WC1 group after training. As for serum sodium (mmol/l) and potassium (mmol/l), the WC2 group showed lower values at the end of the study (p < 0.05).
Plasma renin activity did not differ significantly between both groups at any time point (Table 6).
Discussion
In this current study, the aerobic training protocol was effective in lowering pulse pressure (PP) in overweight hypertensive patients. Those who achieved a reduction in WC also experienced a decrease in systolic BP and pulse pressure. Among the other subjects, no effect was seen. Changes in BP were not accompanied by changes in plasma renin activity. Only pulse pressure decreased in the entire study population.
Obesity is associated with increased plasma volume and cardiac output, accompanied by an inadequate increase in peripheral vascular resistance due to both vasoconstrictive stimuli and unsuppressed plasma renin activity34. In our study,
at baseline all subjects were overweight (BMI: 30.6 ± 3.5 kg/m2). Because there is a positive correlation between BMI
and plasma renin activity1-3, a greater activation of the RAAS
Table 5 - Blood pressure and heart rate at baseline and at the end of the aerobic protocol according to waist circumference: WC1 (reduction) and WC2 (no reduction)
Variables
Groups
WC1 p WC2 p
Initial Final Initial Final
SBP (mmHg) 135±18.4 123±13.5* 0.010 131±14.5 133±10.3 0.660
DBP (mmHg) 82±10.9 78±9.6 0.170 81±8.2 86±5.8* 0.030
Pulse pressure (mmHg) 54±13.9 46±13.0* 0.004 50±11.1 47±8.2 0.440
Heart rate (bpm) 81±7.4 77±7.0 0.188 80±12.33 77±9.7 0.991
Table 6 - Biochemical proile of the study groups at baseline and after four months of training according to waist circumference
Biochemical measurements
Groups WC1
p WC2 p
Initial Final Initial Final
PRA (ng/ml/hr) 1,10 (0,65-2,2) 1,65 (1,1-4,5) 0,287 0,6 (0,4-1,35) 1,15 (0,65-1,75) 0,134
Glucose (mg/dl) 157±96,1 117±30,2 0,839 144±57,4 109±37,8 0,890
Uric acid (mg/dl) 4,3±1,18 4,2±1,50 0,816 5±1,6 5,32±1,77 0,209
Creatinine (mg/dl) 0,8±0,16 0,7±0,21 0,186 0,8±0,2 0,7±0,20 0,658
Urea (mg/dl) 29±3,5 32±7,4 0,195 36±7,1* 40±9,7* 0,199
24-hour sodium (meq/24hr) 158±56,7 174±95,3 0,589 217±60,9* 229±82,9 0,608
Total cholesterol (mg/dl) 220±32,7 231±58,0 0,698 193±43,9 191±48,5 0,822
HDL-cholesterol (mg/dl) 56±16,0 61±17,7 0,199 45±13,2 44±11,0* 0,846
VLDL-cholesterol (mg/dl) 32±19,1 30±19,0 0,576 29±11,5 27±10,3 0,591
LDL-cholesterol (mg/dl) 133±30,0 133±46,2 0,977 120±44,1 119±48,3 0,995
Triglycerides (mg/dl) 157±96,1 137±58,0 0,311 144±57,4 135±51,7 0,598
Sodium (mmol/l) 139±8,0 141±3,5 0,461 138±3,6 138±2,7* 0,866
Potassium (mmol/l) 4,3±0,53 4,7±0,32 0,159 4,3±0,73 4,3±0,45* 0,995
Calcium (mg/dl) 10,7±0,78 10±1,3 0,411 9,8±1,14 10±6,0 0,536
*Statistical signiicant between groups (p < 0.05). Values expressed as mean ± standard deviation. WC1 - group that experienced a decrease in waist circumference; WC2 - group that did not experience a decrease in waist circumference; PRA - plasma renin activity. Values expressed as median and interquartile range for PRA.
system was expected; however, only two patients had elevated renin levels, while the remaining 18 had normal or low levels. This predominantly low plasma renin activity at baseline was accompanied by normal 24-hour urinary sodium excretion, which was maintained after training.
Given that aging causes a decrease in renin levels11,35,
plasma renin would be expected to be slightly increased in our series, since the mean age of the study population was 56 ± 7. Therefore, the effect of age may have attenuated the effect of overweight, producing a group of patients who had mostly low renin levels.
In this current study, mean WC for the overall study population (102.3 ± 9.21 cm) indicates high cardiovascular risk28. Renal compression by abdominal visceral fat may cause
excess renin release36. In our study, there was neither high
incidence of elevated plasma renin activity nor reduction in WC with the training protocol. This suggests that abdominal visceral fat did not decrease, which may explain why plasma renin failed to decline. On the other hand, even in the subgroup that experienced a decrease in WC, there was no decline in plasma renin activity, which argues against the above assumption.
A recent study showed that in hypertensive patients, the reduction in abdominal fat was a significant predictor of decreases in SBP37. The mean decrease in BP with aerobic
training is 7.4 mmHg for SBP and 5.8 mmHg for DBP38,39.
In this current study, SBP and DBP decreased, respectively, 4 mmHg and 2 mmHg (p > 0.05), without reduction in abdominal fat. The group that achieved a decrease in WC also experienced a decrease in SBP after training (p = 0.01). Nevertheless, pulse pressure dropped by 6 mmHg,
which reached borderline statistical significance (p = 0.050) even for the entire study population. It is noteworthy that, in other studies, decreased abdominal fat was associated with improved arterial compliance, unlike arterial stiffness progression, which was associated with weight gain40. This
finding is consistent with the decrease in pulse pressure observed in our study.
There are three possible mechanisms that may have accounted for the rise in plasma renin activity. It may have been a compensatory mechanism for BP decrease, since renin elevation was higher in patients with greater decrease in blood pressure (data not reported). On the other hand, it is known that exercise training causes a decrease in blood volume19,
which may activate the renin-angiotensin-aldosterone system (RAAS). Finally, it is also known that angiotensin II is lipolytic. As exercise training decreased body fat percentage, the elevation in plasma renin activity was the mechanism of lipolysis in our overweight hypertensive patients.
A number of studies have pointed out that physical fitness is associated with reduced activation of the RAAS. However, some factors that may affect this response must be evaluated. For this purpose, only studies involving hypertensive patients will be considered.
In our study, the volunteers were instructed not to change their diet. However, in another study in which body weight and sodium intake were controlled, no significant changes were found in plasma renin activity either18.
renin-angiotensin-aldosterone system19. As the RAAS is the main physiological
regulator of volume, hypertensive patients who respond to blood volume depletion may experience a decrease in blood pressure, with the attendant activation of plasma renin levels, perhaps due to greater arterial compliance.
In a group involving patients older than those in our study (64 ± 3 years), blood pressure fell significantly with aerobic training, but not plasma renin or plasma and blood volumes20. As stated already, PRA level declines with age11,35,
and this may explain why it did not decrease. The 20-week training was more likely to increase plasma renin levels in subjects who had a decrease in mean BP greater than 13 mmHg. There was a negative correlation between baseline plasma renin activity and the decrease in corresponding blood pressure of each subject. Therefore, hypertensive patients with lower levels of plasma renin activity responded better to exercise training19. The results of this study are
consistent with ours, except for the degree of mean BP decrease (mean decrease of 4 mmHg), thereby confirming that hypertensive patients who undergo 20 weeks of aerobic training do not have the BP reduction mediated by the decline in plasma renin activity.
In the study by Matsusaki et al21, 30 hypertensive patients
were assigned to 10 weeks of exercise of either low or high workload (low workload: 50% of VO2max - maximum oxygen consumption; high workload: 75% of VO2max). In the first week, plasma renin activity was positively correlated with SBP changes from week 1 to week 10 week both in the low-workload group (r = 0.57, p < 0.05) and in the high-workload group (r = 0.64, p < 0.05). Over the course of the exercise program, plasma renin activity returned gradually to its baseline levels, and BP was significantly lower at weeks 6 and 9. The low-workload group had significantly lower SBP (9 mmHg), mean BP (6 mmHg) and DBP (6 mmHg), but changes in hemodynamic and humoral variables were not significant. In the high-workload group, plasma renin activity was transiently stimulated after the fourth week of exercise (p < 0.05). A negative correlation was found in both groups between plasma renin activity and the depressor effect. This is because exercise is effective in volume-dependent hypertension. The lesser BP-lowering effect in the high-workload group, compared to the low-high-workload group, may be attributed to the reflex stimulation of the sympathetic nervous system (SNS) and RAAS and to increased stroke volume21.
Conversely, in a study involving only Japanese women with hypertension who were divided into two exercise groups - 10 weeks, 50% of VO2max, 3 times a week -, there was a decrease in DBP (6 mmHg) and mean BP (7 mmHg) (p < 0.05). Plasma renin activity did not change in the exercised group, with a variation of - 0.37 (ng/ml/hr). Blood volume did not decrease, perhaps because of the short duration of the exercise protocol (10 weeks) or due to other mechanisms, since longer periods of training resulted in a decrease in blood volume22.
Tashiro et al23, in a study of 10 hypertensive Japanese,
found no change in plasma renin activity or blood pressure with exercise23.
In 17 sedentary Japanese with untreated hypertension, 12
weeks of aerobic exercise (5 times per week, 30 min, 52% of VO2max.) lowered SBP from 151.6 ± 7 to 144.3 ± 6.9 mmHg and DPB from 96.2 ± 4.7 to 92 ± 5.2 mmHg (p < 0.05). Plasma renin activity was 0.29 ± 0.12 at baseline and 0.24 ± 0.18 ng/l/s after the exercise protocol25.In another
study of the same ethnic group, this time involving 27 Japanese patients with essential hypertension, an aerobic exercise protocol (30 min of brisk walking at 52% of VO2max, 5 to 7 times per week during 12 weeks) lowered SBP and DBP (p < 0.05). Plasma renin activity was 0.27 ± 0.11 at baseline and 0,23 ± 0.10 ng/l/s after the exercise protocol (p > 0.05). One of the mediators of this reduction may have been the increased release of nitric oxide (NO)26, in
view of the improvement in lipid profile experienced by these patients.
Ten weeks of endurance exercise significantly lowered blood pressure, plasma renin activity, plasma catecholamine and percentage of body fat in untreated young adults with mild hypertension. The mean reduction in blood pressure of 11.4 x 9.8 mmHg (p = 0.0001) was accompanied by decreases of 1.82 ng/ml/hr in plasma renin activity (p = 0.0001) and 1.3% in percentage of body fat (p = 0.02). Changes in SBP were significantly correlated with changes in plasma renin activity (r = 0.38; p = 0.005). Changes in BP were not correlated with changes in body weight, electrolytes or body fat. All participants with elevated plasma renin activity tended to have greater changes in SBP, which were directly related to changes in plasma renin activity24.
In this study mean BMI was 27 kg/m2, compared to 30 kg/
m2 in our study.
Even though hypertension was the underlying disease in all the studies mentioned above, and regardless of the differences between the variables studied and overweight status, plasma renin activity remained unchanged at the end of their protocol, which is consistent with our results. This study had the following limitations: Serum inflammatory markers, insulin, adiponectin, leptin, and norepinephrine were not measured, nor were urine urea and creatinine, which could contribute to elucidate the anti-hypertensive mechanisms of aerobic training in overweight hypertensive patients. Also, anthropometric measurements were not confirmed by bioimpedance analysis, and arterial compliance was not clinically assessed. These issues will be addressed in a further study. The lack of a control group may be another limitation; however it is inherent to the study design, since it was a pre- and post-interventional study. A controlled study will be conducted later. Finally, all patients were taking antihypertensive medications, which were not discontinued for ethical reasons. This fact could have influenced the study results; however, no patient changed his medication or dosage throughout the protocol, which circumvents this problem.
Conclusions
References
1. Licata G, Scaglione R, Ganguzza A, Corrao S, Donatelli M, Parrinello G, et al. Central obesity and hypertension: relationship between fasting serum insulin, plasma renin activity, and diastolic blood pressure in young obese subjects. Am J Hypertens. 1994; 7 (4): 314-20.
2. Egan BM, Stepniakowski K, Goodfriend TL. Renin and aldosterone are higher and the hyperinsulinemic effect of salt restriction greater in subjects with risk factors clustering. Am J Hypertens. 1994; 7 (10 Pt 1): 886-93.
3. Cooper R, McFarlane-Anderson N, Benett FI, Wilks R, Puras A, Tewksbury D, et al. ACE, angiotensinogen and obesity: a potential pathway leading to hypertension. J Hum Hypertens. 1997; 11: 107-11.
4. Scholze J, Sharma AM. Treatment of hypertension in obesity. Herz. 2001; 26 (3): 209-21.
5. Barba G, Siani A, Cappuccio FP, Trevisan M, Farinaro E. Abdominal adiposity is associated with increased tubular sodium reabsorption and higher blood pressure: findings of the Olivetti Heart Study. J Hypertens. 1999; 17 (Suppl 3): S144.
6. Goosens GH, Blaak EE, Van Baak MA. Possible involvement of the adipose tissue rennin-angiotensin system in the pathophysiology of obesity and obesity-related disorders. Obes Rev. 2003; 4 (1): 43-55.
7. Kyle UG, Morabia A, Schutz Y, Pichard C. Sedentarism affects body fat mass index and fat-free mass index in adults aged 18 to 98 years. Nutrition. 2004; 20 (3): 255-60.
8. Alderman MH, Madhavan S, Coi WL, Cohen H, Sealey JE, Laragh JH. Association of the renin-sodium profile with the risk of myocardial infarction in patients with hypertension. N Engl J Med. 1991; 324 (16): 1098-104. 9. De Backer GC, Ambrosioni E, Broch-Johnsen K, Brotons C, Cifkova R,
Dallongeville J, et al. European guidelines on cardiovascular disease prevention in clinical practice. Eur J Card Prev Rehab. 2003; 10 (Suppl 1): S1-78.
10. Brewster UC, Setaro JF, Perazella MA. The renin-angiotensin-aldosterone system: cardiorenal effects and implications for renal and cardiovascular disease states. Am J Med Sci. 2003; 326 (1): 15-24.
11. Strong CG. O sistema renina-angiotensina-aldosterona. In: Knox FG, editor. Fisiopatologia renal. São Paulo: Happer & Row do Brasil; 1980.
12. Lund-johansen P. Twenty-year follow-up of hemodynamics in essential hypertension during rest and exercise. Hypertension. 1991; 18 (5 Suppl): III54-61 .
13. Rocchini AP, Key S, Bondie D. The effect of weight loss on the sensitivity of blood pressure to sodium in obese adolescents. N Eng J Med. 1989; 321 (9): 580-5.
14. Melin B, Ecclache JP, Geelen G, Annat G, Allevard AM, Jarsaillon E, et al. Plasma AVP, neurophysin, renin activity, and aldosterone during submaximal exercise performed until exhaustion in trained and untrained men. Eur J Appl Physiol Occup Physiol. 1980; 44 (2): 141-51.
15. Geyssant A, Geelen G, Denis C, Allevard AM, Vincent M, Jarsaillon E, et al. Plasma vasopressin, renin activity, and aldosterone: effect of exercise and trainning. Eur J Appl Physiol Occup Physiol. 1981; 46 (1): 21-30. 16. Jennings G, Nelson L, Nestel P, Esler M, Korner P, Burton D, et al. The
effects of changes in physical activity on major cardiovascular risk factors, hemodynamics, sympathetic function, and glucose utilization in man: a controlled study of four levels of activity. Circulation. 1986; 73 (1): 30-40.
17. Kiyonaga A, Arakawa K, Tanaka H, Shindo M. Blood pressure and hormonal responses to aerobic exercise. Hypertension. 1985; 7 (1): 125-31.
18. Nelson L, Jennings GL, Esler MD, Korner PI. Effect of changing levels of physical activity on blood-pressure and haemodynamics in essential hypertension. Lancet. 1986; 2 (8505): 473-6.
19. Urata H, Tanabe Y, Kiyonaga A, Ikeda M, Hiroaki T, Shindo M, et al. Antihypertensive and volume-depleting effects of mild exercise on essential hypertension. Hypertension. 1987; 9 (3): 245-52.
20. Hagberg JM, Montain SJ, Martin WH, Ehsani AA. Effect of exercise training in 60- to 69-year-old persons with essential hypertension. Am J Cardiol. 1989; 64 (5): 348-53.
21. Matsusaki M, Ikeda M, Tashiro E, Koga M, Miura S, Ideishi M, et al. Influence of workload on the antihypertensive effect of exercise. Clin Exp Pharm Physiol. 1992; 19 (7): 471-9.
22. Koga M, Ideishi M, Matsusaki M, Tashiro E, Kinoshita A, Ikeda M, et al. Mild exercise decreases plasma endogenous digitalislike substance in hypertensive individuals. Hypertension. 1992; 19 (Suppl II): 231-6.
23. Tashiro E, Miura S, Koga M, Sasaguri M, Ideishi M, Ikeda M, et al. Crossover comparison between the depressor effects of low and high work-rate exercise in mild hypertension. Clin Exp Pharm Physiol. 1993; 20 (11): 689-96. 24. Dubbert PM, Martin JE, Cushman WC, Meydrech EF, Carroll RG. Endurance
exercise in mild hypertension: effects on blood pressure and associated metabolic and quality of life variables. J Hum Hypertens. 1994; 8 (4): 265-72. 25. Higashi Y, Sasaki S, Kurisu S, Yoshimizu A, Sasaki N, Matsuura H, et al. Regular aerobic exercise augments endothelium-dependent vascular relaxation in normotensive as well as hypertensive subjects. Circulation. 1999; 100 (11): 1194-202.
26. Higashi Y, Sasaki S, Sasaki N, Nakagawa K, Ueda T, Yoshimizu A, et al. Daily aerobic exercise improves reactive hyperemia in patients with essential hypertension. Hypertension. 1999; 33 (1 Pt 2): 591-7.
27. WHO document. Measuring obesity – classification and description of anthropometric data. Copenhagen: WHO Regional Office for Europe. Copenhagen (Denmark); 1988.
28. Sociedade Brasileira de Cardiologia. Sociedade Brasileira de Hipertensão, Sociedade Brasileira de Nefrologia. V Diretrizes brasileiras de hipertensão arterial. Arq Bras Cardiol. 2007; 89 (3): e25-e79.
29. International Physical Activity Questionnaire (IPAQ). version 2.0, April 2004. [Acesso em 2007 jan 20]. Disponível em:http://www.ipaq.ki.se.
30. Cronk CE, Roche AF. Race and sex-specific reference data for tríceps and subscapular skinfolds and weight/stature. Am J Clin Nut. 1982; 35 (2): 347-54. 31. Durnin JVGA, Rahaman MM. The assessment of the amount of fat in the
human body from measurement of skinfold thickness. Br J Nutr. 1967; 21 (3): 681-9.
32. World Health Organization (WHO). Physical status: the use and interpretation
In overweight hypertensive patients on drug therapy, the decrease in blood pressure seems to rely on other mechanisms other than plasma renin activity, and is associated with a decrease in body fat.
Potential Conflict of Interest
No potential conflict of interest relevant to this article was reported.
Sources of Funding
This study was funded by Fundação para o desenvolvimento da UNESP - FundUnesp.
Study Association
of anthropometric indicators of nutritional status. Geneva: World Health Organization; 1995. (WHO Technical Report Series, 854).
33. Fleter GF. Exercise standards for testing and training: a statement for healthcare professionals from the American Heart Association. Circulation. 2001; 104 (14): 1694-740.
34. Hall JE, Brands MW, Dixon WN, Smith MJ. Obesity-induced hypertension: renal function and systemic hemodynamics. Hypertension. 1993; 22 (3): 292-9.
35. Weidmann P, De Myttenaere-Burszteins S, Maxvell MH, De Lima J. Effect on aging on plasma renin and aldosterona in normal man. Kidney Int. 1975; 8 (5): 325-33.
36. Gutmann FD, Tagawa H, Harber E, Barger AC. Renal arterial pressure, rennin
secretion, and blood pressure control in trained dogs. Am J Physiol. 1973; 224 (1): 66-72.
37. Sterwart KJ, Bacher AC, Turner KL, Fleg JL, Hees PS, Shapino EP, et al. Effect of exercise on blood pressure in older persons: a randomized controlled trial. Arch Intern Med. 2005; 65 (7): 756-62.
38. Fagard RH. Physical fitness and blood pressure. J Hypertens. 1993; 11 (Suppl 5): S47-52.
39. Fagard RH. Exercise characteristics and the blood pressure response to dynamic physical training. Med Sci Sports Exerc. 2001; 33 (6 Suppl): S484-92. 40. Wildman RP, Farhat GN, Patel AS, Mackey RH, Brockwell S, Thompson T, et