Validity and reliability of
self-reported weight and height
measures for the diagnoses of
adolescent’s nutritional status
Validade e coniabilidade das
medidas referidas de peso e estatura
para o diagnóstico do estado
nutricional de adolescentes
Carla Cristina Enes
Priscila Maria Fúncia Fernandez
Silvia Maria Voci
Natacha Toral
Alexandre Romero
Betzabeth Slater
Department of Nutrition, School of Public Health, University of Sao Paulo, Sao Paulo, Brazil.
Author’s individual contributions: Priscila Fernandez, Silvia Voci, Alexandre Romero, and Nata-lvia Voci, Alexandre Romero, and Nata-cha Toral were responsible for data collection. Carla C. Enes, Priscila Fernandez, and Silvia Voci were responsible for statistical analysis, interpretation, and discussion of the results and for writing the manuscript. Natacha Toral, Alexandre Romero, and Betzabeth Slater collaborated in interpretation and discussion of the results and for writing the manuscript. In addition, Betzabeth Slater was re-sponsible for the research design and coordinated the study.
Conlict of interest: none
Corresponding author: Carla Cristina Enes. Departamento de Nutrição da Faculdade de Saúde Pública da USP. Av. Dr. Arnaldo, 715 - Cerqueira César Sao Paulo, SP. Brazil - CEP 01246-904. E-mail: [email protected].
Resumo
Objetivo: Avaliar a validade do peso, estatu-ra e Índice de Massa Corpoestatu-ral (IMC) referi-dos e sua coniabilidade para o diagnóstico do estado nutricional de adolescentes de Piracicaba. Métodos: Participaram do estu-do 360 aestu-dolescentes de ambos os sexos, de escolas públicas de Piracicaba, com idade entre 10 e 15 anos. Os adolescentes auto-relataram seu peso e estatura, sendo esses valores obtidos por medidas diretas, logo em seguida, pelos entrevistadores. A vali-dade do IMC referido foi calculada segundo índices de sensibilidade, especiicidade e valor preditivo positivo (VPP). Avaliou-se a concordância entre as categorias de IMC obtido por meio das medidas referidas e afe-ridas a partir do coeiciente kappa pondera-do, coeiciente de correlação de Lin. e grá-icos de Bland e Altman e Lin. Resultados:
Veriicou-se que tanto os meninos quanto as meninas subestimaram o peso (−1,0 me-ninas e meninos) e a estatura (meme-ninas −1,2 e meninos −0,8) (p < 0,001). Os valores de IMC aferidos e referidos apresentaram uma concordância moderada. A sensibilidade do IMC referido para classiicar os indivíduos obesos foi maior para os meninos (87,5%), enquanto a especiicidade foi maior para as meninas (92,7%). O VPP foi elevado somente para a classiicação da eutroia. Conclusões:
As medidas referidas de peso e estatura de adolescentes não representam medidas vá-lidas e, portanto, não devem ser usadas em substituição aos valores mensurados. Além disso, veriicou-se que 10% dos meninos obesos e 40% das meninas obesas poderiam permanecer não identiicados utilizando-se as medidas auto-referidas, conirmando a baixa validade das medidas auto-referidas.
Abstract
Purpose: To assess the validity and reliabili-ty of self-reported height, weight, and Body Mass Index (BMI) to diagnose the nutri-tional status of adolescents. Methods: The study included 360 public school students of both genders, with ages ranging from 10 to 15 years. Adolescents self-reported their weight and height, and these values were later obtained directly by interviewers. The validity of BMI based on self-reported me-asures was calculated using sensitivity and speciicity indexes, and positive predictive value (PPV). Agreement between self-re-ported and measured BMI was evaluated using Kappa’s weight coeficient, the Lin correlation coeficient, and Bland-Altman and Lin’s plots. Results: Both girls and boys underestimated their weight (−1.0 girls and boys) and height (girls − 1.2 and boys − 0.8) (p < 0.001). BMI presented moderate agree-ment between measured and self-reported values. Sensitivity of estimated BMI based on reported measures to classify obese subjects was higher for boys (87.5%) than it was for girls (60.9%), whereas speciicity was higher for girls (92.7%) than it was for boys (80.6%). PPV was high only for classiication of normal-weight adolescents. Conclusions:
Self-reported measures of weight and height in adolescents do not present valid measu-res; therefore, they should not be used to replace measured values. Additionally, we observed that 10% of obese boys and 40% of obese girls could have remained uni-dentiied if we had used only self-reported measures, emphasizing the effects of the low reliability of self-reporting.
KeyWords: Adolescent. Body mass index. Nutritional status. Self-reported. Height. Validation studies.
Introduction
Nutritional epidemiological studies generally use anthropometric measures of weight and height, especially the Body Mass Index (BMI), to assess nutritional status and to monitor health and/or growth of subjects and populations. Thus, proper accuracy of anthropometric data is essential to correctly classify nutritional status1.
The advantages of using BMI are low cost, ease of measurement, and high re-producibility2,3. However, epidemiological studies have large samples, and direct as-sessment of weight and height may increase research costs, since they require training on anthropometrics and greater time avai-lability. There are also dificulties due to the transportation of equipment to the ield.
Thus, self-reported measures can be an alternative for epidemiological measure-ments, aiming at reducing cost and simpli-fying ieldwork4. Although most studies on self-reported measures of weight and height have been performed in adults, research with adolescents shows that self-reported data are highly correlated with measured data5-8. However, although reliability of self-reported data may be high, its validity is still uncertain. The majority of the studies on validity of self-reported measures have samples of adult populations, and to date, only one report has been described in Brazil with adolescents7; this is a relevant study because little is known about the accuracy of these measures in the population of adolescents. The objective of the present paper was to assess the validity of weight, height, and estimated BMI based on reported measures and their reliability to diagnose the nutritio-nal status of adolescents in Piracicaba, a city in the State of São Paulo, Brazil, identifying demographic characteristics that may lead to information bias.
Methods
Participants
called “Dietary intake and physical acti-vity as determinants for changes in body mass index of a cohort of adolescents from public schools in the city of Piracicaba, Sao Paulo*.” The cross-sectional study (baseline)focused on adolescents of both genders with ages ranging from 10 and 15 years, studying in public schools in Piraci-caba (SP). Interviews took place in school settings during classes, in November 2004. Permission to conduct the survey was obtained at school and from the adoles-cents’ parents or guardians. Information on sample procedures was published in a previous study9.
Data collection
We interviewed 420 adolescents; those without self-reported weight and/or no self-reported height were excluded from the study. The inal sample had 360 adolescents (86% of the initial sample).
Adolescents were asked by trained staff to self-report their weight (kilograms) and their height (centimeters), and then these measures were immediately assessed by interviewers. Participants were unaware that their actual height and weight would be subsequently veriied.
Weight and height were measured twice by procedures standardized by Lohman et al.10. Students were weighed to the nearest 0.1 kg on a Tanita ® electronic platform scale with a capacity of 150 kg and sensitivity of 100 grams. Height measures were made to the nearest centimeter with the help of a wooden stadiometer, mounted on a wall with no baseboards. Prior to measurement, students were asked to take off their shoes, heavy outer clothing, and personal items from their pockets.
To classify nutritional status, from Body Mass Index (BMI) calculated as weight (kg)/height (m)2 we used cut-off points: < 3rd percentile: low weight; ≥ 3rd percentile
and < 85th percentile: normal weight; ≥ 85th percentile and < 97th percentile: overweight;
and ≥ 97th percentile: obese, using the
refe-rence of the World Health Organization11. Absolute error of weight, height, and BMI was estimated by the difference be-tween self-reported and measured values (absolute error = self-reported value – me-asured value). Negative differences indicate underestimation, and positive values repre-sented overestimation.
Statistical analysis
We used Wilcoxon’s test, considering the non-parametric nature of the varia-bles, to examine the differences between self-reported and measured values for each subject according to gender and age. Mann-Whitney’s U test was applied to com-pare absolute weight, height, and BMI error according to gender in the different age ca-tegories. Kruskal-Wallis’ test was employed to assess the differences between self-reported and measured values according to the categories of age and nutritional status. The intra-class correlation coeficient (ICC) was also calculated.
BMI validity obtained from the reported measures of weight and height was calcula-ted according to sensitivity and speciicity indices and positive predictive value (PPV). Weighted kappa coeficient, Lin’s correla-tion coeficient, and Bland-Altman12 and Lin’s13 were used to assess the agreement between the reported and measured BMI categories. The alpha level was set at 0.05. Stata software version 9 (StataCorp, College Station, TX 2001) and SPSS version 11.5 (Chicago, Marketing Department, 2002) were used for data management and sta-tistical analyses.
The study was approved by the Ethical Research Committee of the School of Public Health, University of Sao Paulo.
Results
Among the 420 adolescents interviewed, 52.5% were girls. Among the 60 adolescents
excluded, 66.7% were under 12 years of age. Comparing the adolescents who were excluded with those studied, we observed signiicant differences for age and BMI (p < 0.001). Boys and girls underestimated their weight by about 1 kg (p < 0.001) (Table 1). Comparing absolute error among genders, there was no signiicant difference in any age group. Weight underestimation was more frequent among 13-year-old boys (p = 0.01). Absolute errors of weight presented statistical signiicance for all age categories, in both genders, except for 14-year-old adolescents (p = 0.10 boys vs. p = 0.09 girls). Height was underestimated among girls and boys (-1.2 and -0.8, respectively; p < 0.001) (Table 1). There were differences between self-reported and measured values according to categories of age only in girls (p = 0.01). According to age categories, the greatest underestimation of height occurred among 12-year-old boys. Height was more accurately reported by older girls (14y). Around 4.0% of boys and 11.0% of girls self-reported this measure correctly.
BMIs based on self-reported data were higher than BMIs based on measured data (0.21 kg/m2 for boys and 0.01 kg/m2 for girls),
although with no statistical signiicance (Ta-ble 1). There was no signiicant difference between median BMI errors according to age categories.
We found significant differences be-tween self-reported and measured weight according to categories of nutritional status. Weight was underestimated in all categories, except for underweight adolescents for both genders (p < 0.001). Obese adolescents re-ported this measure with higher differences (approximately -6 kg boys and -5 kg girls). Boys and girls underestimated their height regardless of nutritional status. However, the differences were signiicant only for boys (p = 0.03). Underweight adolescents self-reported height with greater discrepancy in comparison with assessed value (-5.9 cm for boys and -3.9 cm for girls). Differences be-tween self-reported and assessed BMI also varied according to the nutritional status of adolescents (p < 0.001). BMI values among adolescents classiied as underweight were overestimated by 5.35 kg/m2 and 2.68 kg/m2 between girls and boys, respectively.
Table 2 shows that the agreement was excellent for weight measures and adequate for height in both genders, according to the
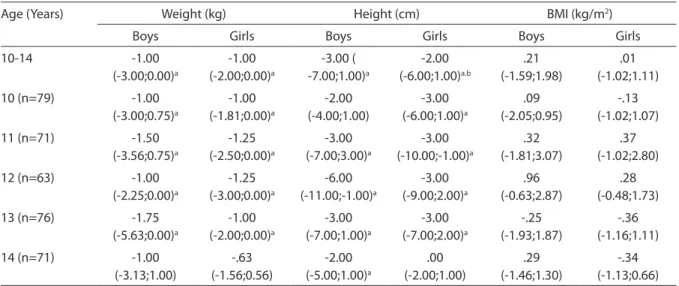
Table 1 - Medians (P25 and P75) of errors in measures of weight, height, and Body Mass Index (BMI) according to sex and age. Piracicaba, São Paulo, Brazil, 2004.
Tabela 1 – Medianas (P25 e P75) dos erros de medida de peso, estatura e índice de massa corporal (IMC) de acordo com o sexo e idade. Piracicaba, São Paulo, Brasil, 2004.
Age (Years) Weight (kg) Height (cm) BMI (kg/m2)
Boys Girls Boys Girls Boys Girls
10-14 -1.00 (-3.00;0.00)a -1.00 (-2.00;0.00)a -3.00 ( -7.00;1.00)a -2.00 (-6.00;1.00)a.b .21 (-1.59;1.98) .01 (-1.02;1.11)
10 (n=79) -1.00
(-3.00;0.75)a -1.00 (-1.81;0.00)a -2.00 (-4.00;1.00) -3.00 (-6.00;1.00)a .09 (-2.05;0.95) -.13 (-1.02;1.07)
11 (n=71) -1.50
(-3.56;0.75)a -1.25 (-2.50;0.00)a -3.00 (-7.00;3.00)a -3.00 (-10.00;-1.00)a .32 (-1.81;3.07) .37 (-1.02;2.80)
12 (n=63) -1.00
(-2.25;0.00)a -1.25 (-3.00;0.00)a -6.00 (-11.00;-1.00)a -3.00 (-9.00;2.00)a .96 (-0.63;2.87) .28 (-0.48;1.73)
13 (n=76) -1.75
(-5.63;0.00)a -1.00 (-2.00;0.00)a -3.00 (-7.00;1.00)a -3.00 (-7.00;2.00)a -.25 (-1.93;1.87) -.36 (-1.16;1.11)
14 (n=71) -1.00
(-3.13;1.00) -.63 (-1.56;0.56) -2.00 (-5.00;1.00)a .00 (-2.00;1.00) .29 (-1.46;1.30) -.34 (-1.13;0.66) a Signiicant differences according to the Wilcoxon test (p < 0.05) / Diferenças signiicantes de acordo com o teste de Wilcoxon (p < 0,05)
classiication proposed by Rosner14. Lower ICC values were observed for BMI, and according to the assessed kappa’s weighted value of 0.52 for boys and 0.50 for girls, agreement can be classiied as moderate, as proposed by Rosner14 and Masson et al.15. Overweight and obesity prevalences were 15.8% and 9.4% for boys and 12.2% and 16.5% for girls, respectively; based on self-reports, this prevalence was higher (17.0% and 25.7% for boys vs. 13.8% and 20.6% for girls).
For boys, lower sensitivity was observed for identification of overweight (40.7%) (Table 3). This index was higher for female adolescents (64.5%) within the same cate-gory. In contrast, sensitivity to identiication of obesity was higher among boys (87.5%).
High BMI speciicities were observed
from the self-reported measures for boys and girls. Lower speciicity was observed in the classiication of normal-weight adoles-cents. Predictive positive value was higher only for classiication of normal weight. For the remaining categories, this index was low, especially for girls.
Lin’s agreement coeficients observed in boys and girls were 0.90 and 0.91 for weight, 0.60 and 0.61 for height, and 0.51 and 0.49 for BMI, respectively.
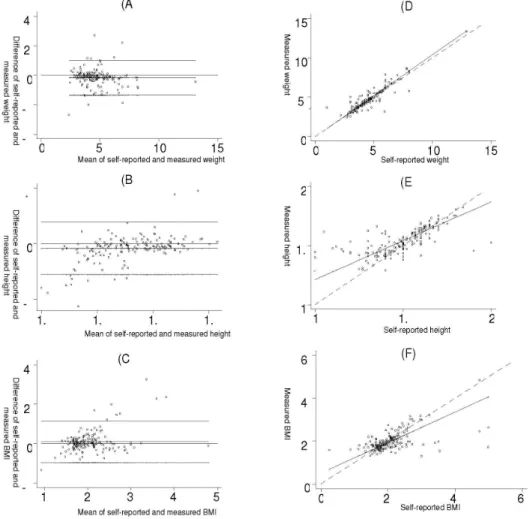
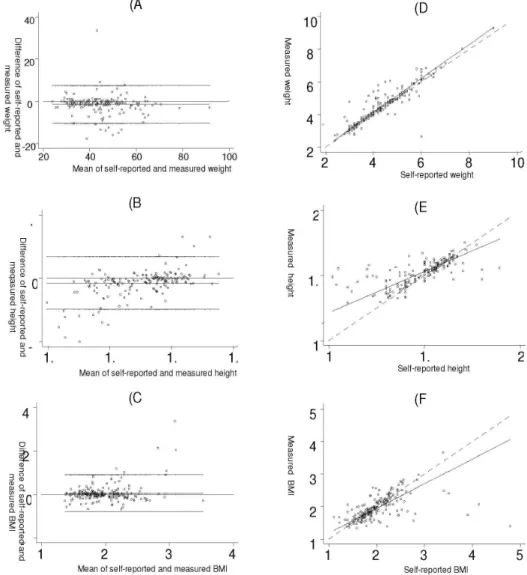
The average of differences was below zero, indicating a trend of weight underes-timation by both genders. Pictures 1B and 2B show that height was underestimated by both genders; however, data were more scattered, and more subjects were outside the 95% limit of agreement when compared to weight data. In the Bland-Altman plot
Table 2 – Intra class Correlation Coeicient (ICC)§ and 95% Conidence Interval (CI)between
self-reported and measured values of weight, height, and body mass index according to sex. Piracicaba, São Paulo, Brazil, 2004.
Tabela 2 – Coeiciente de correlação intraclasse (CCI) e Intervalo de coniança 95% (IC) entre os valores auto-referidos e medidos de peso, estatura e índice de massa corporal de acordo com o sexo. Piracicaba, São Paulo, Brasil, 2004.
Measures Boys Girls
ICC CI95% ICC CI95%
Weight (kg) 0.91 0.88-0.93 0.91 0.89-0.93
Height (cm) 0.63 0.53-0.71 0.63 0.54-0.71
BMI (kg/m2) 0.52 0.40-0.62 0.50 0.38-0.60
Obs: All intra class correlation coeficients are statistically signiicant (p < 0.05)
Todos os coeicientes de correlação intraclasse são estatisticamente signiicantes (p < 0,05)
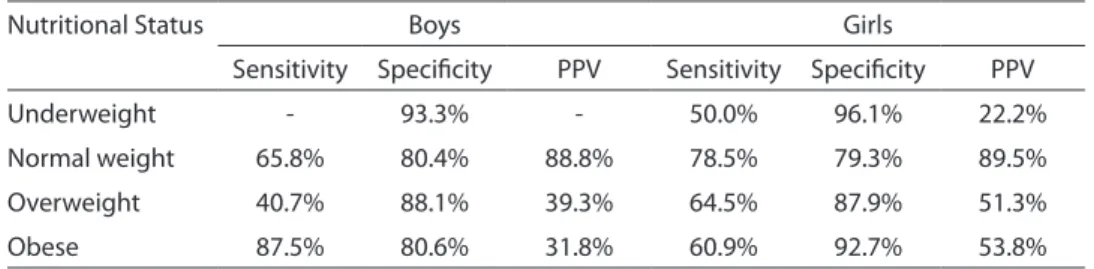
Table 3 - Sensitivity, Speciicity, and Positive Predictive Value (PPV) of BMI obtained from self-reported measures according to gender and nutritional status. Piracicaba, São Paulo, Brazil, 2004.
Tabela 3 – Sensibilidade, Especiicidades e Valor Preditivo Positivo (VPP) de IMC obtido a partir das medidas auto-referidas de acordo com o sexo e estado nutricional. Piracicaba, São Paulo, Brasil, 2004.
Nutritional Status Boys Girls
Sensitivity Speciicity PPV Sensitivity Speciicity PPV
Underweight - 93.3% - 50.0% 96.1% 22.2%
Normal weight 65.8% 80.4% 88.8% 78.5% 79.3% 89.5%
Overweight 40.7% 88.1% 39.3% 64.5% 87.9% 51.3%
Obese 87.5% 80.6% 31.8% 60.9% 92.7% 53.8%
Obs: It was not possible to calculate because no adolescent was classiied in that category
for BMI (Figures 1C and 2C), fewer subjects were found outside the limits of agreement, presenting difference values closer to zero. The average of differences is higher than zero, indicating an overestimation of BMI.
In Figures 1 and 2 (D, E, and F), Lin’s plots compare regression lines of the data with perfect agreement lines. For weight, (plots 1D and 2D), the straight line representing agreement between self-reported and mea-sured areas is close to the perfect agreement line. However, for height and BMI (Charts E and F), data are more scattered and, there-fore, further away from perfect agreement.
Discussion
When we compared reported and as-sessed data, we saw a trend for underestimat-ing weight and height in both genders, which was higher in obese adolescents regarding weight (up to 6 kg) and in underweight sub-jects regarding height (up to 5.9 cm for boys and 3.9 cm for girls). These values were high-er than those presented in othhigh-er studies1,6-8, where tendencies to underestimate weight (from 0.5 to 2.6 kg), and to overestimate height (from 0.1 to 0.8 cm) were observed.
Abraham et al.1 and Peixoto et al.16
OBS: The dashed line in graphs D, E, F is the line of perfect agreement.
A linha tracejada nos gráicos D, E, F é a linha de concordância perfeita.
Figure 1 - Bland & Altman (A, B, C) and Lin (D, E, F) Plots for weight, height, and BMI for boys. Piracicaba, Sao Paulo, Brazil, 2004.
showed that age, height, and current weight, schooling, income, the frequency these data are assessed, sexual maturity, time elapsed since irst period, practicing physical activ-ity, and cultural and psychological aspects can interfere with the accuracy of reporting those measures. Ambrosi-Randic & Bulian6 also reinforce the role of lack of information on weight and height. Wang et al.17 and Tok-makidis et al.8 did not see any effect of gender on the accuracy of anthropometric measures.
Other sources for errors are adopting in-adequate procedures (i.e., heavy clothes and shoes), using non calibrated instruments, and adolescents assessing their own mea-sures7. We must also consider the possibility that adolescents assess their measures very rarely, having outdated information because of their fast growth5,7.
Elgar et al.18, assessing data of 418 ado-lescents from 15 to 17 years of age, found signiicant underestimation of weight among
OBS: The dashed line in graphs D, E, F is the line of perfect agreement.
A linha tracejada nos gráicos D, E, F é a linha de concordância perfeita.
Figure 2 - Bland & Altman (A, B, C) and Lin (D, E, F) Plots for weight, height, and BMI for girls. Piracicaba, São Paulo, Brazil, 2004.
girls and of BMI for both genders and did not ind signiicant differences for self-report errors in weight, height, and BMI among boys and girls.
In this study, sensitivity to estimate BMI based on reported measures to classify obese subjects was higher for boys (87.5%) than for girls (60.9%). Thus, one in every ten boys and four in every ten girls are no longer classiied in this category. These values were higher than those found by Rasmussen et al.19, but similar to those of Farias Júnior7, who assessed the sensitivity of subjects classified as overweight/obese together. The low sensitivity, deined as the ability to identify truly obese subjects among those that are reported as obese using reference measures, may have undesirable conse-quences for health tracking programs in students. However, when the presence of false negatives is not a real problem, such as in long-term surveillance and trend studies, the use of estimated BMI based on reported measures is a less expensive alternative19.
Speciicity was higher for girls (92.7%) compared to boys (80.6%), consistent with other studies19,20. The capacity of estimated BMI based on reported measures to diagno-se non-obediagno-se adolescents was satisfactory, since nine of ten adolescents that were not obese were correctly classiied. This inding is consistent with other investigations7,17,18.
Positive predictive value was lower than that observed in other reports with ado-lescents7,21. Among adolescents classiied as obese, only three in every ten boys and ive in every ten girls presented this condi-tion. Goodman & Strauss22 showed that the weight of overweight children is usually 27 kg higher than of non-obese children, with little likelihood that a 2.7 to 5.4 kg error due to bias in the report will make a difference in classiication using a cut-off point of 95%. Those subjects classiied incorrectly tend to be within the classiication limits and, therefore, have the same risk factors.
Among boys, the use of self-reported measures overestimated the prevalence of obesity by 16.3% (9.4% assessed vs. 25.7% self-reported).
Elgar et al.18 observed an underestima-tion of overweight and obesity prevalence when self-reported data was used due to the underreporting of weight by adolescents. These indings are in contrast with results of this study. Peixoto et al.16 justiied that the possible overestimation of height may reinforce a systematic error towards a cultu-ral standard that values being tall and slim. Findings by Lee et al.23 are similar to those presented in this study for measures of weight in both genders (since excellent agreement has been found), for height in boys, and for BMI in girls. In contrast, com-pared with another research7, only ICC of weight measures in both genders was similar. Rasmussen et al.19 reported weighted Kappa’s coeficient values (k > 0.70) higher than those found in this study, although they used ano-ther reference to classify nutritional status.
This study has some limitations. First, the lack of information about the place where anthropometric measures were as-sessed the previous time, the time elapsed since last assessment, and the procedures and types of equipments used before the interview may have contributed to obtai-ning less reliable data. Despite these limi-tations, a positive aspect was the fact that participants did not know the objective of the comparison between measured and self-reported data.
In summary, indings of this study su-ggest that self-reported measures should not be used to replace measured ones in adolescents, since only weight presented adequate validity. Diagnoses of nutritional status of adolescents using self-reported data of weight and height cannot be reliably conducted, especially in girls.
Population studies intending to use self-reported anthropometric measures must assess weight and height measures in a sub-sample to assess the error size and thus to correct these data, which would simplify ieldwork, making it fast and less expensive.
Acknowledgements: This study was
References
1. Abraham S, Luscombe G, Boyd C, Olesen I. Predictors of the accuracy of self-reported height and weight in
adolescent female school students. Int J Eat Disord 2004;
36: 76-82.
2. Fisberg M. Primeiras palavras: uma introdução ao
problema do peso excessivo. In: Atualização em
obesidade na infância e adolescência. São Paulo: Atheneu; 2005. p. 1-10.
3. Queiroga MR. Avaliação da composição corporal. In: Testes e medidas para avaliação da aptidão física relacionada à saúde em adultos. Rio de Janeiro: Guanabara Koogan; 2005. p. 5-54.
4. Gorber SC, Tremblay M, Moher D, Gorber B. A comparison of direct vs. self-report measures for assessing height, weight and body mass index: a
systematic review. Obes Rev 2007; 8:307-26.
5. Himes JH, Hannan P, Wall M, Neumark-Sztainer D. Factors associated with errors in self-reports of stature, weight, and Body Mass Index in Minnesota adolescents.
Ann Epidemiol 2005; 15: 272-8.
6. Ambrosi-Randic N, Bulian AP. Self-reported versus measured weight and height by adolescent girls: a
Croatian sample. Percept Mot Skills 2007; 104: 79-82.
7. Farias Júnior JC. Validity of self-reported weight and
height for adolescent nutritional status diagnosis. Braz J
Mother Child Health 2007; 7: 167-74.
8. Tokmakidis SP, Christodoulos AD, Mantzouranis NI. Validity of self-reported anthropometric values used to assess Body Mass Index and estimate obesity in Greek
school children. J Adolesc Health 2007; 40: 305-10.
9. Toral N, Slater B, Silva MV. Food consumption and overweight in adolescents from Piracicaba, Sao Paulo,
Brazil. J Nutr 2007; 20: 449-59.
10. Lohman TG, Roche AF and Martorell R (eds.).
Anthropometric standardization reference manual. Champaign (IL): Human Kinetics Books; 1988.
11. De Onis M, Onyango AW, Borghi E, Siyam A, Nishida C, Siekmann J. Development of a WHO growth reference
for school-aged children and adolescents. Bull World
Health Organ 2007; 85: 660-7.
12. Bland JM, Altman DG. Measuring agreement in method
comparison studies. Stat Methods Med Res 1999; 8:
135-60.
13. Lin LI. A concordance correlation coeficient to evaluate
reproducibility. Biometrics 1989; 45: 255-68.
14. Rosner B. Fundamentals of Biostatistics (4th ed.).
Belmont (CA): Wadsworth Publishing Co; 1995.
15. Masson LF, McNeill G, Tomany JO, Simpson JA, Peace
HS, Wei L et al. Statistical approaches for assessing the
relative validity of a semi-quantitative food frequency questionnaire: use of correlation coeficients and the
Kappa statistic. Publ Health Nutr 2003; 6: 313-21.
16. Peixoto MRG, Benício MHDA, Jardim PCBV. Validity of self-reported weight and height: the Goiânia study,
Brazil. J Publ Health 2006; 40: 1065-72.
17. Wang Z, Patterson CM, Hills AP. A comparison of self-reported and measured height, weight and BMI in
Australian adolescents. Aust N Z J Public Health 2002; 26:
473-8.
18. Elgar FJ, Roberts C, Tudor-Smith C, Moore L. Validity of self-reported height and weight and predictors of bias in
adolescents. J Adolesc Health 2005; 37: 371-5.
19. Rasmussen F, Eriksson M, Nordquist T. Bias in height and weight reported by Swedish adolescents and relations to body dissatisfaction: the COMPASS study.
Eur J Clin Nutr 2007; 61: 870-6.
20. Galán I, Gandarillas A, Febrel C, Meseguer CM. Validación del peso y talla autodeclarados en población
adolescente. Gac Sanit 2001; 15: 490-7.
21. Brener ND, McManus T, Galuska DA, Lowry R, Wechsler H. Reliability and validity of self-reported height and
weight among high school students. J Adolesc Health
2003; 32: 281-7.
22. Goodman E, Strauss RS. Self-reported height and weight and the deinition of obesity in epidemiological studies.
J Adolesc Health 2003; 33: 140-2.
23. Lee K, Valeria B, Kochman C, Lenders CM. Self-assessment of height, weight, and sexual maturation:
validity in overweight children and adolescents. J
Adolesc Health 2006; 39: 346-52.