Educação Física da Universidade Gama Filho, Escola de Educação da Universidade do Rio de Janeiro e CLINIMEX - Clínica de Medicina do Exercício
Mailing address: Claudio Gil Soares de Araújo - CLINIMEX – Rua Siqueira Campos, 93/101 – 22031-070 – Rio de Janeiro, RJ – E-mail: [email protected]
Objective - To evaluate the level of satisfaction with body weight and the self-perception of the weight/height ratio and to verify the influence of the frequency of present and past physical activity on these variables.
Methods - Using questionnaires or interviews, we obtained height data, reported and desired weight, self-perception of the weight/height ratio, and the frequency of current physical activity in 844 adults (489 women). Of these, evaluated the frequency of physical activity during high school of 193 individuals,and we measured their height and weight.
Results - Less than 2/3 of the individuals had body mass index between 20 and 24.9 kg/m2. A tendency existed to overestimate height by less than 1 cm and to underesti-mate weight by less than 1kg. Desired weight was less than that reported (p<0.001), and only 20% were satisfied with their current weight. Only 42% of men and 25% of women exercised regularly. No association was found between the frequency of physical activity and the variables height, weight, and body mass index, and the level of satis-faction with current weight.
Conclusion - Height and weight reported seem to be valid for epidemological studies, and great dissatisfaction with body weight and a distorted self-perception of height/weight ratio exists, especially in women, regard-less of the frequency of physical activity.
Key words: body mass index, physical activity,
self-per-ception, self-reported, height, weight
Arq Bras Cardiol, volume 80 (nº 3), 243-9, 2003
Denise Sardinha Mendes Soares de Araújo, Claudio Gil Soares de Araújo
Rio de Janeiro, RJ - Brazil
Self-perception and Dissatisfaction with Weight Does Not
Depend on the Frequency of Physical Activity
The terms physical activity and physical exercise have been mistakenly classified as synonyms, especially by the nonmedical population. Recently 1, when reviewing this issue, we adopted the description proposed by Casper-sen et al. 2 and Shephard and Balady 3, who use the term physical activity to refer to any movement with energy con-sumption, above rest levels. Whereas, physical exercise has the connotation of intention and represents a subgroup within the broader concept of physical activity.
Regular exercise is associated with countless benefits for health and quality of life 4. Physically active individuals tend to have a lower incidence of coronary disease 5, stroke 6, hypertension 7, non-insulin dependent diabetes mellitus 8, obesity 9 , and some forms of cancer10. On the other hand, overweight or increase in body fat is followed by a greater morbidity and mortality 11,12. In recent years, the prevalence of overweight and obesity has increased, espe-cially in the United States, where the proportion of obese adults has increased almost twofold, increasing from 12% to practically 22.5% 13. In Brazil, recent data 14 already show signs that indicate a growing prevalence of overweight and obesity, of 31% and 7%, respectively, in men, and of 26% and 12% in women, representing a considerable increase re-garding since the 1980s, when only 4.5% of men were obese. Therefore, this is not a problem exclusively of developed countries. Because the levels of the frequency of physical activity remain extremely low 15, it is necessary to search for a healthy lifestyle by combating sedentarism and of over-weight.
The main purpose of this study was to evaluate quan-titatively and qualitatively, in adults of both sexes, the level of satisfaction with weight, to judge the self-perception of the weight and height relation, and to verify the influence on these variables of the frequency of physical activity in the present and in the past.
Methods
We studied 844 adults (355 men and 489 women) between 2000 and 2001. Most of them were university alum-ni from the State of Rio de Janeiro, in 3 different situations: a) 113 graduated (49 men and 64 women) from the Medical School of the Universidade Federal Fluminense (UFF); b) 538 university alumni (207 men and 331 women) had studied in 20 different disciplines; 80% of these had studied in the health sciences at the Universidade Gama Filho (UGF); and c) 193 participants (99 men and 94 women) were members of the Congresso da Sociedade de Cardiologia do Estado do Rio de Janeiro (Congress of the Cardiology Society of the State of Rio de Janeiro) (SOCERJ), and represented less than 10% of the total participants of the event.
Data were collected through questionnaires (UFF) and interviews (UGF and SOCERJ). At UFF, a professor, after a brief explanation on how to fill out the data, administered the questionnaire to all of his students from the 3rd and 4th pe-riods who were present on that day. At UGF, we obtained an incidental sample, and 4 previously trained observers admi-nistered the interview individually on a single day to exclu-de the possibility of a stuexclu-dent taking part more than once. At SOCERJ, once again, 4 previously trained observers conducted individually a standardized interview with an in-cidental sample of visitors who agreed to participate in the study recruited from one of the booths at the Congress in the study. In all samples, specific objectives of the study were unknown to the participants.
We obtained sex, age (years), reported height (cm), re-ported weight (kg), and desired weight (kg) from all sam-ples. For the 538 university students from UGF, 3 questions were added to the interview, in comparison to that given to students from UFF: course attended; perception of the weight/height relation based on the following options: un-dernourished, underweight, normal, overweight, and obese; and current physical activity frequency with the following options: frequently, sometimes, never. Only 1 option was accepted as an answer. To the 193 participants of SOCERJ, we also asked about the frequency of physical activity in high school. Individuals indicated whether they were doctors, professionals of other areas, or students of the health sciences. We measured height and weight, with a stadiometer (reading each 0.1 mm), and a digital balance Plenna (reading each 0.1 kg). All individuals were measured barefoot, without coats, suits, bags, or other objects that could substantially influence the measures. We intentional-ly did not control the issue of food and liquid intake prior to the measurement and the amount or exact weight of clothes. Based on the data obtained through the interview/
questionnaire or through real measures, we determined body mass index – weight (kg)/height2 (m2) – for height and weight reported values (BMIr), reported height and desired weight (BMId), and of measured height and weight (BMIm). Based on height and weight measured, obtained in in-dividuals from SOCERJ, we determined the agreement between measured values and values reported for height and weight.
The evaluation of the level of weight satisfaction was made indirectly through 4 different analyses, 1 quantitative and 3 qualitative, 2 of them in absolute values and 1 in per-centages related to body weight, always by using reported weight and desired weight. We assumed that identical and different values of reported and desired weight represen-ted, respectively, satisfaction and dissatisfaction, although we did not ask a direct question regarding this issue.
Quantitative analysis simply determined the numerical difference between reported and desired weight in kilo-grams. The 3 qualitative analyses were: a) to verify whether the individual wanted to gain, maintain, or lose weight; b) to determine whether the individual was satisfied, dissatisfied, or very dissatisfied with the weight reported, considering respectively and empirically, up to 1 kg (arbitrary tolerance for satisfaction), between 1 and 5 kg, and more than 5kg in relation to desired weight, and c) to detect whether the desi-rable weight was 5% lower or 5% higher than that reported. The degree of perception of the weight/height relation was coded according to self-classification within the cate-gories proposed in the questionnaires. From the reported and measured values, we determined self-perception according to the classification obtained from body mass index values by using the following criteria: <18.5kg/m2, undernourished; between 18.5 and 19.9kg/m2, under-weight; between 20 and 24.9kg/m2, normal; between 25 and
29.9kg/m2, overweight; and ≥30kg/m2 , obese. This
classifi-cation is very similar to that of the International Obesity Task Force (IOTF) 17, except for the slightly different values in the lower extremity of the curve. However, considering the small prevalence of obesity in the samples studied, we decided not to subdivide the values greater than 30kg/m2, as is usually advised 18. We also obtained 3 indexes that correspond to reported, desired, and measured values of body mass index.
The frequency of current physical activity and acti-vity during high school were codified into an ordinal scale of never, sometimes and frequently.
scale. We also calculated the percentage for some grouped categories and for eventual differences or changes when 2 situations were compared (ex, frequency of current physical activity and physical activity during high school). For values of reported height and weight in university stu-dents, we created a table with the main percentiles for each category.
After that, an inferential analysis was performed with the Student’s t test for comparison between the 2 groups. When theorical reasons existed to suspect that 1 group was higher than another or that 1 measure was greater than ano-ther, we opted for the 1-tailed t test. For measures in ordinal scales, we used the chi-square test, whether for compari-sons between groups and sexes or between different data in the same group of individuals. We also determined the Pearson’s moment product correlation coefficient relevan-ce among several screened variables. We used 5% probabi-lity for statistical significance criteria.
Results
A descriptive analysis of the main data separated ac-cording to sex is presented in table I. Men compared with women were slightly older (p<0.001), heavier 76.8 [0.59] (mean [standard error of average]) versus 57.9 [0.38] kg (p<0.001) and taller 177 [0.4] versus 164 [0.4] cm (p<0.001). Men also reported greater body mass index than women did, 24.5 [0.17] versus 21.6 [0.12] kg/m². Taking into account the body mass index range most frequently recommended for good health (20 to 24.9kg/m2), we found only 208 men (58%) and 309 women (68%) with results within these values. Body mass indexes reported as belonging to the undernou-rished range were rare among men. Only 4 men (1%) were in this range, whereas 35 women (7%) were in the same range. Reported values for body mass index classified as obesity (IMC>30kg/m2) were very rare for both sexes, representing only 20 cases (3%) of the total sample, and only 3 indivi-duals were severely obese (IMC>40kg/m2).
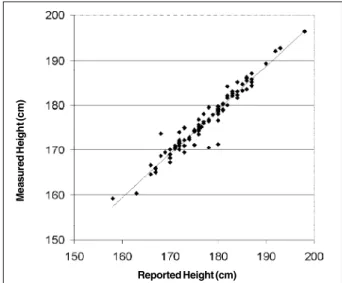
In the SOCERJ group, we compared reported height and weight values with height and weight values measured effectively. Reported height was minimally greater, 0.6 cm for
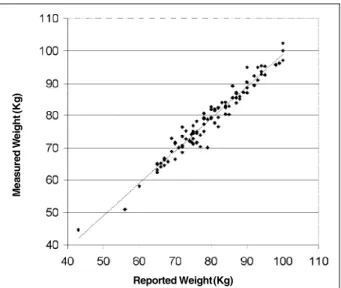
women and 1 cm for men (<1%), than measured height (p<0.001). Reported weight values, 0.9kg for men (p<0.001) and 0.1kg for women (p=0.56), were lower than those mea-sured effectively. Figures 1 and 2 present data for reported versus measured height and weight for men and women. Re-ported and measured values were strongly associated – correlation coefficient between 0.96 and 0.98 – for both height and body weight. We found twice as many important errors in reported weights than in reported heights. No rela-tion existed between ages and the differences between re-ported and measured values in either sex. Because the mag-nitude of the differences was small for weight and height, body mass indexes obtained based on reported or measured data were not different (p=0.89 for male and p=0.13 for female).
Women had a lower mean for desired weight, -54.6 [0.27], than men did, -75.0 [0.47] kg (p<0.001). Regarding level of satisfaction with body weight, we observed that men and women would rather weigh much less (p<0.001), mean values of -1.85 kg and -3.30 kg respectively, when the reported weight was substracted from the desired weight. When we compared the differences of reported and desired weight, in both sexes, we detected that women wanted to reduce their body weight more than men did (p<0.001). The magnitude of the difference between reported and desired weight was significantly correlated with reported weight, with the self-classification of the height/weight relation, and with the reported body mass index, both in men and women, with a coefficient between 0.62 and 0.84 (p<0.001). In the qualitative analysis, individuals from both sexes, especially women, were frequently dissatisfied with their current weight (table II); only 22% of men and 15% of women wanted to maintain their current reported weight, and the majority of individuals from both sexes wanted to lose weight. If we accept a tolerance margin of 1 kg over or under the reported weight, the percentage of satisfaction in-creases very little, 26% and 19%, respectively, in male and
Table I - Age, height, reported and desired weight, and body mass index (BMI) of 844 adults (* p<0.05)
Male (no = 355) Female (n = 489)
Variable Mean ± SD Mean ± SD
[Minimum-maximun] [Minimum-maximun]
Age (years) 24.3 ± 7.6 22.6 ± 5.8*
[17-73] [16-55]
Reported height (cm) 177.1 ± 7 163.7 ± 6.6* [157-198] [148-184] Reported weight (kg) 76.8 ± 11.2 57.9 ± 8.4*
[43-140] [40-98]
Desired weight (kg) 75 ± 8.8 54.6 ± 5.9*
[52-120] [42-89]
BMI (kg/m2) 24.5 ± 3.1 21.6 ± 2.7*
[16.4-40.8] [15.2-40.6] Fig. 1 - Data of measured height versus reported height in 193 adults taking part in a Cardiology Congress.
Reported Height (cm)
M
e
a
s
u
re
d
H
e
ig
h
t (
c
m
females. We should observe that a numerically significant dissatisfaction with body weight is common, almost 1 in every 3 men, and 1 in every 4 women said that they wanted to lose or gain more than 5 kg. Even when the issue was considered as a percentage of 5% of body weight, the majo-rity of individuals from both sexes were still dissatisfied with their weight. When the distribution of data was compared between both sexes, the qualitative analysis corroborated the findings of the quantitative approach and reinforced the greater dissatisfaction with weight in women compared with that in men (p<0.001).
In 733 individuals where data regarding the perception of the weight/height relation were collected, we verified sig-nificant differences between both sexes, with women classifying themselves as overweight (43%) more frequen-tly than men did (25%) (p<0.001). Only 1 student classified herself as undernourished, while 9 men and 2 women classified themselves as obese. Almost half of the indivi-duals, 50% of men and 42% of women, considered them-selves as having a normal weight and height relation.
When the distribution of self-classification data accor-ding to the IOTF table were compared with the classifica-tion of the reported body mass index obtained, from the data reported for height and weight, we observed a systematic error; 58% of women and 30% of men classified themselves mistakenly. Women overestimated and men underestimated their real classification (p<0.001). Only 4% of women mis-took their classification over 2 or 3 categories. That is, they considered themselves as normal or overweight when body mass index classified them as undernourished (<18.5kg/m2). Obese women who considered themselves normal or below weight were very rare (<1%). In fact, the level of association between the self-perceived classifications and those ob-tained from the reported body mass index is only modest, with a significant correlation coefficient, but with a small magnitude (r=0.56).
The analysis of physical activity frequency indicates that the prevalence of sedentariness is high, almost 2 times higher in women. Only 42% of men and 25% of women per-formed physical activity frequently (table III). A compara-tive statistical analysis between sexes confirmed that men perform physical activity more frequently than women do (p<0.001).
In the SOCERJ sample (193 individuals), it was also possible to analyze physical activity frequency in high school, where approximately 10% of individuals indicated that they never exercised. We also observed that practically 2/3 of the sample significantly changed the frequency of physical activity from high school to the present (p<0.001). Most reduced physical activity, and a minority, 10% of women and 15% of men, increased physical activity fre-quency (p<0.001). It is interesting to that no correlation existed between the frequency of current and high school physical activity in both women (r=0.00) and men (r=0.04).
An expressive association between the frequency of physical activity and current height and weight values or body mass index values did not occur, whether regarding the frequency of current or high school physical activity. We did not find associations between the frequency of physical activity and the level of satisfaction with body weight or with the self-classification of the height/weight relation.
An additional analysis was performed, separating the individuals according to sex, and considering those that exercised frequently, both in the past and in the present. We identified 29 men and 20 women with this characteristic, but we could not identify any significant difference in the Table II - Qualitative analysis of the level of satisfaction with
reported weight comparing men (n = 355) and women (n =489) (* p < 0.01)
Absolute difference between reported Male [N (%)] Female [N (%)] weight and desired weight > 5%*
Yes 188 (53) 308 (62.9)
N o 167 (47) 181 (36.9)
Absolute difference between Male [N (%)] Female [N (%)] reported and desired weight (kg)*
Satisfied (< 1kg) 092 (25.9) 092 (18.8) Dissatisfied (1 to 5kg) 143 (40.3) 274 (55.9) Very dissatisfied (> 5kg) 120 (33.8) 123 (25.1)
Desire regarding reported Male [N (%)] Female [N (%)] weight *
Lose 181 (51) 340 (69.4)
Keep 078 (22) 075 (15.3)
Gain 096 (27) 074 (15.1)
Table III - Current physical activity frequency (PAF)
Current PAF Male [n = 306] Female [n =425]
Never 64 (20.9%) 134 (31.5%)*
Sometimes 114 (37.2%) 183 (43.1%) Frequently 128 (41.8%) 108 (25.4%)
* differences between genders (p <0.001). Fig. 2 - Data of measured weight versus reported weight in 193 adults taking part in
a Cardiology Congress.
Reported Weight (Kg)
M
e
a
s
u
re
d
W
e
ig
h
t
(K
g
comparison between these individuals and those with lower current and past physical activity frequency.
Discussion
This study is based for the most part of its analysis on reported height and weight values. The analysis of reported values rather than measured ones may have affected the in-terpretation of results.
The use of self-reported values of height and weight is relatively common in national 19,20 and international 21-23 research with sometimes conflicting results. In the Stunkard and Albaum 22 study, self-reported body weight of Ameri-can and Danish adults was very similar to measured weight, although a tendency existed to underestimate the results by about 1 kg. Nakamura et al 23, studying Japanese women, found a smaller mean difference, 0.2kg, and Schmidt et al 19, using a sample of 659 adults living in Porto Alegre, verified smaller differences of 100 g between reported and measured body weight values. In all these studies 19,22,23, the corre-lation between reported and measured values was always >0.95. Apparently, reported height is more problematic, according to Pirie et al 24, who found a tendency in men to overestimate it. More recently, Chor et al 20 reevaluated this issue in hundreds of Brazilian bank tellers, and using intra-class coefficient correlation, they concluded that reported values for height and weight had small error margins.
Sample characteristics seem to affect the validity of these reported values. Older individuals, probably because they were not capable of identifying height loss with ageing, tend to have more distinct values 25,26. Ethnic or cultural differences can also interfere with the validity of re-ported values for height and weight 27,28.
We obtained reported values and performed measures for height and weight by using conventional techniques in about 20% of the studied individuals, excluding coats, suits, bags or other objects that could substantially influen-ce the measures. Although we can question the measure of body weight of individuals wearing street clothes, which is generally performed more frequently than measuring naked individuals, it may have been even more convenient to iden-tify the similarity between reported and measured (self-per-ception) weight, adopted in other national studies 20.
Although we identified some statistically significant differences between reported and measured values, the magnitude of these differences may be considered very small, less than 1cm in height and less than 1kg in weight, to be considered of practical relevance considering the capa-city of information of the great majority of individuals. Actually, this difference can be corroborated by unpublis-hed data from our laboratory that showed that the weight of the great majority of adult individuals varies between 0.5 and 1 kg over a month, even without any specific dietary in-tervention.
Our sample mainly comprised young adults (< 8% older than 40 years old) working in the health services. We may suppose that relatively small time intervals between
the last effective measures of height and weight and the gat-hering of data may probably explain the low margin of error found. Actually, only 13 of 193 individuals (6%) overesti-mated their weight by more than 4 kg versus 13% reported by Schmidt et al 19 in inhabitants of Porto Alegre.
A correlated question is the impact of eventual errors, even though small ones, introduced by reported values of height and weight instead of measured ones, that may have occurred during the calculations of body mass index. We observed, in accordance with studies from Porto Alegre 19 and Scotland 28, that no statistical difference existed between reported and measured body mass index, which indirectly validates our approach and agrees with classical review articles 29. Thus, although few individuals may have solely important errors in reported height and weight, for studies of large samples of young adults, this is not rele-vant. It is possible that values reported by telephone have lower validity than those reported in interviews or on ques-tionnaires completed in front of the researcher, which would explain why some authors have found important errors in body mass index created by values reported by telephone or mail 30. Thus, we considered for this study, within limits of up to 1 cm and 1 kg, that reported values for height and weight of adult individuals are valid and very closely represent effective measures of these variables.
Our data enabled us to obtain a preliminary reference for the behavior and the main percentiles weight, height, and body mass index in university students from Rio de Ja-neiro (table IV).
Another methodological aspect to be discussed is the division of the sample to compare and analyze. We perfor-med a statistical analysis to test eventual differences bet-ween men and women, betbet-ween UFF, UGF, and SOCERJ, between UGF students from different academic disciplines (law, medicine, physiotherapy, and others) and between students, doctors and professionals from other areas of the Congress. We observed specific behaviors for each sex, whereas, on the other hand, with the small and obvious exception of greater age in the SOCERJ sample, in none of the other divisions or classifications did we notice evi-dence of specific answer patterns to demand a deeper sepa-rate analysis. Thus, we opted to combine obtained data for the 3 samples, keeping only sex separate.
Body mass index has been widely used in epidemolo-gical and clinical research 31,32, although several critical limitations exist regarding its use for comparing individuals of both sexes 33. These limitations include when height differs greatly from 170 cm 34 in elderly people 35 and the determination between the effects of muscle and excess fat 29. However, even when considering critics and limitations inherent to the use of body mass index, we opted to use it in the present study in view of the great scientific experience accumulated with this index.
exists, especially among women, although the cause may not be identified. Theoretically, it may be due to esthetic reasons and worries about health and prevention of future chronic, degenerative diseases. However, considering that women had a reported mean body mass index significantly lower than that of men, at least regarding health, it would be illogical to find a greater desire to lose weight in women. In addition, some men expressed the desire to gain weight, although some of them had relatively high body mass inde-xes (some of them were overweight), which would probably represent the intention to increase muscle mass. In our opi-nion, dissatisfaction is primarily due to esthetic reasons, which was corroborated by recent communication 36 that highlighted that body mass index has decreased progressi-vely over the years in the winners of beauty pageants in the United States. Nonetheless, with this probable esthetic mo-tivation, a potential health risk exists in the desire to be thin, because these women have a greater tendency toward depression or bulimia 37.
When we analyzed the self-perception data, only 58% of women and 30% of men were not able to classify them-selves correctly as undernourished, underweight, overwei-ght, and obese with a high percentage of error. The misclas-sification varied according to sex gender. These data are very similar to those of Lowry et al 38 who when analyzing young American women found only 18% overweight accor-ding to body mass index (and the other 12% obesity). About 40% considered themselves overweight (9% as obese). On the other hand, 16% of the men considered themselves as slightly or too much underweight, although only 3.3% were classified as underweight.
We considered the possibility that the error is related to the classificatory scale based on body mass index and not in wrong self-perceived weight status. Analyzing the literature, we observed that body mass index and the risk of death differ according to sex 32, and age 29, so that the same body mass index represents distinct risks in young adults and elderly people. Identical values for body mass index may have different clinical representations. For example, a low body mass index may represent a good body composition in an individual physically active or in a state of cachexia or end-stage neoplastic disease, whereas a body mass index value conside-red normal may be obtained in a physically inactive, sarcopenic
smoker or one with accumulated fat within the abdomen. Even high body mass index values may represent an intense exercise program of muscle development in individuals with low deposits of subcutaneous fat. The great body mass index in men, when compared with that in women, is clinically incohe-rent, because after puberty women tend to have a greater amount of body fat. Thus, it is possible that other indicators, such as ectomorphy or the reciprocal of ponderal index, may be more suitable than body mass index to evaluate height/weight relation 34.
Questions about the frequency of physical activity frequency were made very simply. Although several ques-tionnaires with different levels of complexity are available, the current trend is to simplify and use a single question to evaluate the level of physical activity 39. We controlled the precise meaning of physical activity in the past by intentio-nally restricting the period to high school and considering that all individuals tested had finished high school. For most students, this timeframe was something between 2 and 4 years earlier.
In our study, considering the limitations of the lay po-pulation to clearly distinguish the differences between phy-sical exercise and phyphy-sical activity, we opted to ask objecti-vely about physical activity, which may have led to an ove-restimation bias. The prevalence of individuals who repor-ted that they had never been involved in physical activity was very high, reaching 21% of men and 35% of women. On the other hand, to be frequently involved in physical activi-ty does not assure that minimum levels of physical activiactivi-ty frequency recommendations have been reached 4, reflec-ting then an overestimated bias for the percentage of indivi-duals classified as physically active.
We detected a tendency in men to be more physically active than women, both in the past and in the present, and it is curious that the frequency of past and present physical activity were not related in either men or women. No corre-lation existed between the frequency of physical activity and the level of satisfaction with body weight or with self-perception of weight/height relation. Perhaps if we had asked about the intensity of habitual physical exercise, we may have identified some kind of association. Lowry et al 38 found that individuals who took part in vigorous physical activity or in muscle strengthening exercises had a greater tendency to lose weight than did those who performed it moderately. According to our data, individuals who wanted to have a body weight different from their current one were never physically active. That is, those dissatisfied with body weight and that could benefit from an active lifestyle, did not try in the past and in the present to exercise regularly as a way to adjust their body weight. This may be because of the difficulty these individuals had to expose themselves. This observation deserves to be the object of future studies because of its relevance in terms of health.
In conclusion, we observed that an important level of dissatisfaction exists regarding body weight, especially in women who considered themselves overweight when they were not. The frequency of current and high school physi-cal activity was not related based on these variables. Table IV - Main height (cm) and weight (kg) percentiles for university
men and women
Percentile Male Male Female Female height weight height weight
3 165 57 152 46
5 167 59 154 47
10 168 64 156 49
25 172 69 159 52
50 177 75 163 56
75 182 83 168 62
90 186 90 172 68
95 189 97 175 71
References
1. Araújo DSMS, Araújo CGS. Aptidão física, saúde e qualidade de vida relaciona-da à saúde em adultos. Rev Bras Med Esporte 2000; 6: 194-203.
2. Caspersen CJ, Powel KF, Christenson GM. Physical activity, exercise and phy-sical fitness: definitions and distinctions for health-related research. Public Health Rep 1985; 100: 126-31.
3. Shephard RJ, Balady G. Exercise as cardiovascular therapy. Circulation 1999; 99: 963-72.
4. Pate RR, Pratt M, Blair SN, et al. Physical activity and public health: a recom-mendation from the Centers of Disease Control and Prevention and the American College of Sports Medicine. JAMA 1995; 273: 402-7.
5. Berlin JA, Colditz GA. A meta-analysis of physical activity in the prevention of coronary heart disease. Am J Epidemiol 1990; 132: 612-28.
6. Lee I-M, Paffenbarger RS Jr. Physical activity and stroke incidence: the Harvard Alumni health study. Stroke 1998; 29: 2049-54.
7. Blair SN, Goodyear NN, Gibbons LW, et al. Physical fitness and incidence of hy-pertension in healthy normotensive men and women. JAMA 1984; 252: 487-90. 8. Wei M, Gibbons LW, Kampert JB, Nickaman MZ, Blair SN. Low cardiorespirato-ry fitness and physical inactivity as predictors of mortality in men with type 2 diabetes. Ann Intern Med 2000; 132: 605-11.
9. Blair SN, Brodney S. Effects of physical inactivity and obesity on morbidity and mortality: current evidence and research issues. Med Sci Sports Exerc 1999; 31(11 suppl): S646-S62.
10. Thune I, Furberg AS. Physical activity and cancer risk: dose-response and cancer, all sites and site-specific. Med Sci Sports Exerc 2001; 33(6 suppl): S530-S50. 11. Lee I-M, Manson JE, Hennikens CH, Paffenbarger RS Jr. Body weight and
morta-lity: a 27-year follow-up of middle-aged men. JAMA 1993; 270: 2823-8. 12. Camargo CA, Weiss ST, Zhang S, Willett WC, Speizer FE. Prospective study of
body mass index, weight change, and risk of adult-onset asthma in women. Arch Intern Med 1999; 159: 2582-8.
13. Fregal KM, Carroll MD, Kuczmarski RJ, Johnson CL. Overweight and obesity in United States: prevalence and trends, 1960-1994. Int J Obes Metab Disord 1998; 22: 39-47.
14. Guimarães AC. Sobrepeso e obesidade: fatores de risco cardiovascular – aspec-tos clínicos e epidemiológicos. Hipertensão 2001; 4: 94-7.
15. Macera CA, Powell KE. Population attributable risk implications of physical ac-tivity dose. Med Sci Sports Exerc 2001; 33(6 Suppl): S635-S9.
16. Strauss RS. Self-reported weight status and dieting in a cross-sectional sample of young adolescents. Arch Pediatr Adolesc Med 1999; 153: 741-7.
17. Obesity: preventing and managing the global epidemic: report of a WHO Con-sultation on Obesity, Geneva, June 3-5, 1997. Geneva: World Health Organiza-tion, 1998.
18. National Institutes of Health, National Heart, Lung and Blood Institute. Clinical Guidelines on the Identification, Evaluation, and Treatment of Overweight and Obesity in Adults: the evidence report. Bethesda: National Institutes of Health; 1998.
19. Schmidt MI, Duncan BB, Tavares M, Polanczyk CA, Pellanda L, Zimmer PM. Vali-dity of self-reported weight - a study of urban Brazilian adults. Rev Saúde Pública 1993; 27: 271-6.
20. Chor D, Coutinho ESF, Laurenti R. Reliability of self-reported weight and height among State Bank employees. Rev Saúde Pública 1999; 33: 16-23. 21. Rowland ML. Self-reported weight and height. Am J Clin Nutr 1990; 52: 1125-33. 22. Stunkard AJ, Albaum JM. The accuracy of self-reported weights. Am J Clin Nutr
1981; 34: 1593-9.
23. Nakamura K, Hoshino Y, Kodama K, Yamamoto M. Reliability of self-reported body height and weight of adult Japanese women. J Biosoc Sci 1999; 31: 55-8. 24. Pirie P, Jacobs D Jeffery R, Hannan P. Distortion in self-reported height and
weight data. J Am Diet Assoc 1981; 78: 601-6.
25. Nieto-Garcia FJ, Bush TL, Keyl PM. Body mass definitions of obesity: sensiti-vity and specificity using self-reported weight and height. Epidemiology 1990; 1: 146-52.
26. Kuczmarski MF, Kuczmarski RJ, Najjar M. Effects of age on validity of self-repor-ted height, weight, and body mass: from the Third National Health and Nutrition Examination Survey. J Am Diet Assoc 2001; 101: 28-34.
27. Palta M, Prineas RJ, Berman R, Hannan P. Comparison of self-reported and measu-red height. Am J Epidemiol 1982; 115: 223-30.
28. Bolton-Smith C, Woodward M, Tunstall-Pedoe H, Morrison C. Accuracy of the estimated prevalence of obesity from self reported height and weight in an adult Scottish population. J Epidemiol Community Health 2000; 54: 143-8. 29. Willett WC, Dietz WH, Colditz GA. Guidelines for healthy weight. N Engl J
Med 1999; 341: 427-34.
30. Hill A, Roberts J. Body mass index: a comparison between self-reported and mea-sured height and weight. J Public Health Med 1998; 20: 206-10.
31. Yarnell JWG, Patterson CC, Tomas HF, Sweetnam PM. Comparison of weight in middle age, weight at 18 years and and weight change between, in predicting consequent 14 year mortality and coronary events: Caerphilly prospective study. J Epidemiol Community Health 2000; 54: 344-8.
32. Calle EE, Thun MJ, Petrelli JM, Rodríguez C, Heath CW. Body-mass index and mor-tality in a prospective cohort of US adults. N Engl J Med 1999; 341: 1097-105. 33. Lean MEJ, Han TS, Seidell JC. Impairment of health and quality of life using new
US Federal Guidelines for the identification of obesity. Arch Intern Med 1999; 159: 837-43.
34. Ricardo DR, Araújo CGS. Índice de massa corporal: um questionamento cientí-fico baseado em evidências. Arq Bras Cardiol [aceito para publicação]. 35. Heiat A, Vaccarino V, Krumholz HM. An evidence-based assessment of Federal
Guidelines of overweight and obesity as they apply to elderly persons. Arch Intern Med 2001; 161: 1194-203.
36. Rubinstein S, Caballero B. Is Miss America an undernourished role model? JAMA 2000; 283: 1569.
37. Wiederman MW, Pryor TL. Body dissatisfaction, bulimia, and depression among women: the mediating role of drive for thinness. Int J Eat Disord 2000; 27: 90-5. 38. Lowry R, Galuska DA, Fulton JE, Wechsler H, Kann L, Collins JL. Physical ac-tivity, food choice, and weight management goals and practices among US col-lege students. Am J Prev Med 2000; 18: 18-27.