ASSESSMENT OF FUNCTIONAL POLICENTRICITY IN THE
ROMANIAN COUNTY RESIDENCE MUNICIPALITIES
ANTONIO TACHE
1, MONICA TACHE
2, ALINA HUZUI-STOICULESCU
3ABSTRACT - In 2002, John Friedmann concluded that “Almost everyone will coexist in a single global urban network, which will operate on the basis of global competition.” These challenges were mentioned in the EU 2020 Strategy (EC, 2010), where European policy is focused on competitive and inclusive metropolitan development. One of the main problems that emerge when adopting functional urban areas (or metropolitan areas) as territorial units of analysis and policy development in European countries is the lack of generally accepted standards for their identification. This problem prevents comparative research between European countries using functional urban areas or metropolitan areas as territorial units of analysis. This article presents an original methodology for assessing the functional policentricity of county seats in Romania, based on ESPON 1.1.1. programme criteria, particularly the classification of various categories of cities in the European Union.
Keywords: polycentricity, functional urban areas, ESPON methodology, GIS
INTRODUCTION
Friedmann (1995) refers to the spatial organization of a new international division of labour, which leads to profound changes for the global urban system. According to Sassen (2011), globalization implies a new spatial economy that exceeds the regulation capacities of individual states. Large cities are considered fundamental in a global urban system that transcends national boundaries. In this context, political debates on the Spatial Development European Scheme marked a milestone in the process of European integration and territorial development. According to the European Spatial Development Perspective (ESDP, 1999), the promotion of balanced urban polycentric system is one of the most common and cited political objectives of the program. This concept goes over the different interests of Member States and meets the economic and social cohesion objectives of the ESDP, particularly the need to encourage a more balanced competitive structure throughout Europe. The topic of polycentrism has gained importance in recent times and became well known as a normative concept in the European agenda of spatial planning (Faludi, 2006; Eskelinen and Fritsch, 2009). Polycentricity is considered as a key tool to promote social cohesion (Meijers and Sandberg, 2008), economic competitiveness and environmental sustainability (ESDP, 1999). The interest in polycentric development is supported by the hypothesis that was put forward in ESDP’s view of polycentric urban systems that are more efficient, more sustainable and more equitable than both monocentric urban systems and dispersed small settlements. The theory of central places and, therefore, the concepts of centrality and polycentricity, as defined by Christaller in 1933, are still some of the most popular (and most intensely disputed) theories used by geographers, sociologists, economists, planners, etc. The
1 Senior Resercher, National Institute for Research and Development in Constructions, Urbanism and
Sustainable Development URBAN-INCERC, 266 Pantelimon St, Bucharest, Romania. E-mail: tonytache@yahoo.ro
2 Senior Researcher, National Institute for Research and Development in Constructions, Urbanism and
Sustainable Development URBAN-INCERC, 266 Pantelimon St, Bucharest, Romania. E-mail: marianitu12@yahoo.ro
3 Senior Researcher, National Institute for Research and Development in Constructions, Urbanism and
centrality theories were associated with the analyses of systems and urban networks, even from Christaller’s first emphasis. Polycentricity can be conceptualized from two different perspectives: the morphological and the functional one. Some studies approach polycentricity from a morphological perspective (NordRegio, 2004; Parr, 2004; Meijers, 2008), while others adopt a functional perspective (Van der Laan, 1998). In both the cases, a polycentric region is supposed to be characterized by the coexistence of more than one urban centre (Riguelle et al., 2007).
The classical definition of morphological polycentrism argues that a region that is considered a single territorial entity is made up of more than two cities that are both historically and politically independent, contiguous, have a functional relationship and are complementary. Secondly, from a morphological perspective, centres must not be too dissimilar in terms of dimension, since there must not be any evidence of primacy at the top of distribution (Hall, 2009). Hence, the hierarchical ranking of cities is usually assessed looking at their population, mainly focusing on the size-distribution of cities (Beckmann, 1958).
From the functional approach, the hierarchical ranking between cities is assessed using interaction measures, often based on flows of people, goods or information, therefore by making use of tools borrowed from network analysis. Polycentrism can be applied to a local scale (Roberts et al., 1999), a regional scale (Parr, 2004; Meijers, 2007), a national level (Waterhout et al., 2005) or at the European level (ESDP, 1999), with different interpretations of polycentrism for different spatial levels (Kloosterman and Mustered, 2001; Davoudi, 2003; Eskelinen and Fritsch, 2009).
ESPON programme, mainly through ESPON 1.1.1. project, has developed a method to measure both morphological aspects (hierarchy, distribution, number of cities) and relational aspects (flows and co-operations between urban areas at different scales). As units of analysis, “functional urban areas” (FUAs) were defined in each country. Out of these, urban centres to be included in the analysis were selected using seven criteria: population, transport, tourism, industry, knowledge, corporate decision-making (headquarters) and administrative functions. The selected centres were classified using a typology of global, European, national, regional and local importance. Having these functional urban areas as structural elements, the national urban systems were analysed based on the following three dimensions of polycentricity: size, location and connectivity.
The most commonly used and applied methods in evaluating polycentrism are rooted in techniques based on Geographic Information Systems - GIS (ESPON, 2005; Hoyler et al., 2008) and spatial econometric techniques, particularly using the estimation of not linear functions (Meijers and Sandandberg, 2008), the method of ordinary least squares (Trullén and Boix, 2001) or Local Weighted Regression (McMillen and McDonald, 1998; McMillen and Smith, 2003). Descriptive statistics are also used, making use of indicators such as Gini coefficients, coefficients of localization and specialization (Gordon and Richardson, 1996; Meijers, 2008), as well as the Moran index (Baumont et al., 2004) and the Local Indicators of Spatial Association (Guillain et al., 2004). The Territorial Agenda of the European Union 2020 (adopted 19 May 2011, Budapest) mainly aims towards an “Inclusive, Smart and Sustainable Europe of Diverse Regions” and considers that the objectives defined in the Europe 2020 Strategy for Smart, Sustainable and Inclusive Growth can only be achieved if the territorial dimension of the strategy is taken into account, as development opportunities vary from one region to another. Polycentricity is currently considered a useful spatial planning tool to enhance competitiveness of cities’ territorial cohesion and environmental sustainability. From a functional and governmental perspective, functional urban areas are considered basic units required by a polycentric development, while at European level they are the growth engines of the European economy.
concentrates on the functional connections between separate centres within the urban system (Burger et al., 2011). International studies have shown that the degree of functional polycentricity varies considerably across different spatial scales. Functional specialization is an important dimension of polycentricity since these functions are those that distinguish cities from each other and produce the necessary flows for economic and political integration. Given the role of growth poles in providing integrated local development, along with polycentric regional competitiveness, and in meeting current and future national targets, it is necessary to analyse how large cities - county capitals and growth poles contribute to the macroeconomic development of Romanian regions, and to identify opportunities for improving the institutional framework, together with local and regional strategies in order to maximize their role within the programming period 2014-2020.
METHODOLOGY
Metropolisation is a process of attracting new specific activities, jobs and residents, relying predominantly on competitiveness. This means that attracting specific metropolitan functions and activities are based on certain assets of cities, usually the strongest of them, and on their potential, offering specific advantages depending on the area. These preconditions are certain places/ areas that are more attractive than others - even in cities or at least in a large metropolitan area. With this process any new sub-centres and metropolitan development usually goes far beyond the city boundaries in a more or less polycentric sense. Metropolisation of the economic territory in Europe must be analysed in the context of specialization of knowledge-based economic activities in the regions of Europe’s major urban (Krätke, 2007). At national level, it required the development of an operational polycentric concept and measurement methods.
The proposed study was aimed at evaluating the functions of Romanian county residence cities using the concepts of ESPON project 1.1.1. and an original methodology to delineate the ability of these specific cities to merge into functional urban areas. The methodology involves the use of statistical indicators and a GIS spatial database that evaluates the category that fits the county seats in Romania. Finally, this paper proposes a comprehensive polycentric index comprising the county residence cities and Bucharest. The spatial database structure at the level of county seats and Bucharest contains the following fields:
Population Level: Population in county seats and Bucharest, year 2011 (1);
Economic Level: The location of the headquarters of the top 500 companies in each county seat in
Romania (1); Gross domestic product (GDP) per inhabitant, in purchasing power standard
(PPS), year 2008 in Euro (2); Gross domestic product (GDP) per inhabitant, in purchasing
power standard (PPS), year 2013 in Euro (3); Real growth rate of Gross domestic product
(GDP) per inhabitant in PPS between 2013 and 2008 (4); Gross value added in industry (% GDP)(5);
Transport Level: Airport with more than 20,000 passengers - year 2012 (1); Port with more than 10,000 TEU container traffic - year 2012 (2);
Tourism Level: Nights spent at tourist accommodation establishments - year 2012 (1); Number of tourists - year 2012 (2);
Education Level: Location of public universities in Romania - year 2012 (1); Location of private universities in Romania - year 2012 (2); Number of university students of county seats and Bucharest – year 2012 (3).
RESULTS
Using the ESPON classification criteria for different categories of cities, we compared the statistical indicators on the five targeted areas of the research to the ESPON criteria, hence producing the following table of county residence cities and Bucharest, together with the related categories. The letters in the table mean: E – European Level; N – National Level; R – Regional Level; L – Local Level.
Table 1. Table of county seat and Bucharest typologies
Siruta Name Population Competitiveness Transport Tourism Education
161945 Vaslui R L - - -
174744 Focșani R L - - -
167473 Râmnicu Vâlcea R R - L -
151790 Alexandria L L - - -
155243 Timișoara N N E N N
159614 Tulcea R L L R -
146263 Suceava R L L R R
136483 Satu Mare R L L R L
139704 Zalău R R - - -
143450 Sibiu R N R N R
130534 Ploiești R N - R R
125347 Slatina R L - L -
120726 Piatra-Neamț R L - L L
114319 Târgu Mureș R R N R R
106318 Baia Mare R L L R L
109773 Dr.-Turnu Severin R L - L -
95060 Iași N R R N E
92658 Slobozia L L - - -
100576 Buftea L N - - -
179132 București E E E E E
83320 Miecurea-Ciuc L R - L -
86687 Deva R R - R -
100521 Giurgiu R L L L -
75098 Galați R L R R R
77812 Târgu Jiu R R - R L
69900 Craiova N R L R N
65342 Târgoviște R L - L R
63394 Sfântu Gheorghe R R - L -
60419 Constanța N N E N N
50790 Reşița R R - L L
92569 Călărași R L L - -
54975 Cluj-Napoca N N E N E
44818 Buzău R L - - -
40198 Brașov N N - N N
35731 Botoșani R L - L -
42682 Brăila R R R R -
32394 Bistrița R R - L -
26564 Oradea R R L N R
20297 Bacău R L N L R
9262 Arad R N L R R
13169 Pitești R N - R R
Table 1 offers the following conclusions: Bucharest meets every European criterion for the five areas studied; Cluj-Napoca meets 2 European criteria and 3 national criteria; Timișoara, Constanța and Iași meet one European criterion. Also, the only cities that meet the national criteria considering all indicators are Bucharest, Cluj-Napoca, Timișoara, Constanța, and Brașov. In contrast, county seats, which meet only two of the 5 criteria for classifying these levels are local or at most one of these criteria is the regional level. Out of these municipalities, we mention Alexandria, Slobozia (2 local criteria) or Vaslui, Focşani, Buzău (one local and one regional criterion).
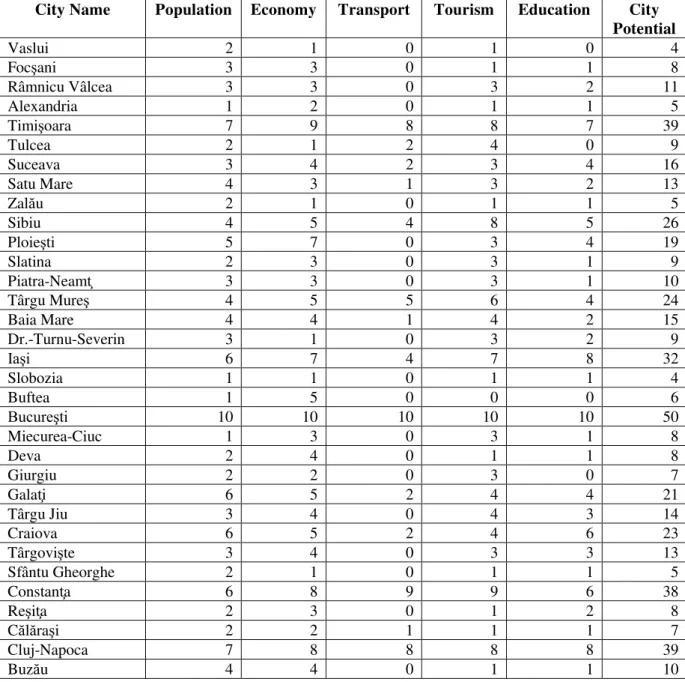
Table 2 was produced in ARCGIS 10.2.2. spatial database, based on the statistical support of the software, and includes those indicator values which are transformed into value classes of quintiles. Thus, for each chapter, we have values for each county seat between 1 and 10 (in some cases 0-10). In the last column of the table, we have a final indicator without the weights generated by aggregating the values obtained using the methodology.
Table 2. Spatial database of the county seat according to the quintile classes
City Name Population Economy Transport Tourism Education City Potential
Vaslui 2 1 0 1 0 4
Focşani 3 3 0 1 1 8
Râmnicu Vâlcea 3 3 0 3 2 11
Alexandria 1 2 0 1 1 5
Timişoara 7 9 8 8 7 39
Tulcea 2 1 2 4 0 9
Suceava 3 4 2 3 4 16
Satu Mare 4 3 1 3 2 13
Zalău 2 1 0 1 1 5
Sibiu 4 5 4 8 5 26
Ploieşti 5 7 0 3 4 19
Slatina 2 3 0 3 1 9
Piatra-Neamţ 3 3 0 3 1 10
Târgu Mureş 4 5 5 6 4 24
Baia Mare 4 4 1 4 2 15
Dr.-Turnu-Severin 3 1 0 3 2 9
Iaşi 6 7 4 7 8 32
Slobozia 1 1 0 1 1 4
Buftea 1 5 0 0 0 6
Bucureşti 10 10 10 10 10 50
Miecurea-Ciuc 1 3 0 3 1 8
Deva 2 4 0 1 1 8
Giurgiu 2 2 0 3 0 7
Galaţi 6 5 2 4 4 21
Târgu Jiu 3 4 0 4 3 14
Craiova 6 5 2 4 6 23
Târgovişte 3 4 0 3 3 13
Sfântu Gheorghe 2 1 0 1 1 5
Constanţa 6 8 9 9 6 38
Reşiţa 2 3 0 1 2 8
Călăraşi 2 2 1 1 1 7
Cluj-Napoca 7 8 8 8 8 39
Braşov 6 7 0 9 6 28
Botoşani 4 2 0 3 1 10
Brăila 5 3 2 5 2 17
Bistriţa 3 2 0 3 2 10
Oradea 5 5 2 5 5 22
Bacău 4 5 5 3 3 20
Arad 5 5 1 6 5 22
Piteşti 5 7 0 3 4 19
In addition, we developed a series of cartograms both for each chapter in the above table and for a general indicator on the potential of functional polycentric county residence cities.
1. The population function - analyses and conclusions in accordance with the methodology
results. The relevant indicator used to represent the population function: population in county seats and Bucharest in 2011.
Figure 1. Evaluation of the population section, considering all county municipalities
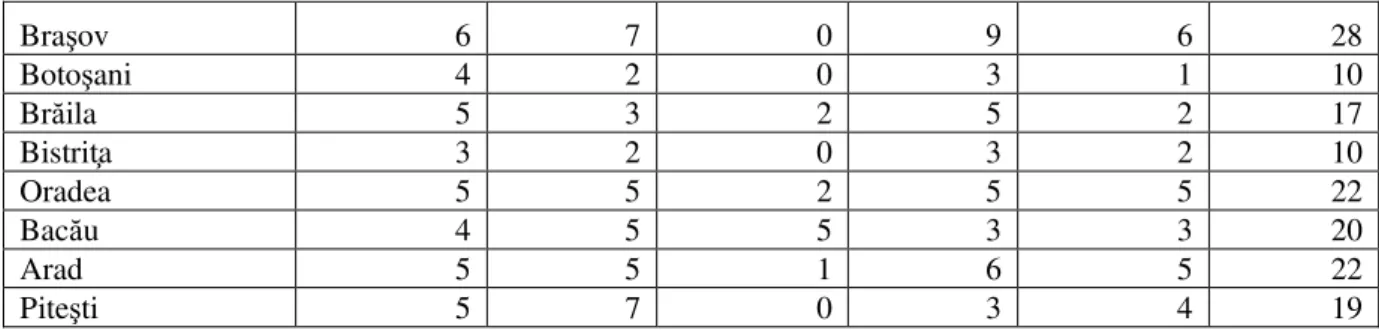
2. The economic function - analyses and conclusions implemented in accordance with the
methodology results. The relevant indicators used for the economic functions were the following: The location of the headquarters of the top 500 companies in each county seat in Romania (1); Gross domestic product (GDP) per inhabitant, in purchasing power standard (PPS), year 2008 in Euro (2); Gross domestic product (GDP) per inhabitant, in purchasing power standard (PPS), year 2013 in Euro (3); Real growth rate of Gross domestic product (GDP) per inhabitant in PPS between 2013 and 2008 (4); Gross value added in industry (% GDP)(5).
Figure 2. Evaluation of the economic section in the case of all county municipalities
Studying the competitiveness results of the county seat municipalities, we can draw the following conclusions:
- in the first category we find Bucharest, with a GDP per capita in the EU27 average, including many top companies, but with a relatively small decrease in GDP in 2013 (as forecast for the GDP in 2013) compared to 2008;
transit of goods through the port; three municipalities are rising - Ploiești, an old industrial centre, reconnected to new technologies by developing technological and industrial parks; Arad and Sibiu - two municipalities which have had an upward trend in the last ten years, a permanent increase in the GDP per capita (Arad 11.3% compared to 2008 and Sibiu 10.9%) and an increase in the quality of life which have attracted many investors;
- in the third category we find the old industrial centres with a great tradition in Romania, but which have underperformed lately. Our focus is on Craiova, characterised by an economic recovery in the last five years, with an increasing GDP per capita of almost 6.7%; Galați, with a decrease in the GDP per capita in 2013 compared to 2008 by approximately 1.7%; Reşița, a steel centre with a historical difficulty in adapting to a market economy after 1990, but with a significant increase in the GDP per capita in the past five years, showing a growth of 23.6% in 2013 compared to 2008; another city with industrial tradition, Târgu Mureș, undergoes a series of transformations that are determined by emerging companies and new investors, with positive impact on growth of the GDP per capita in 2013 compared to 2008 (12.9%). A revival of economic field is also found in Alba Iulia, Deva, Zalău, Sfântu Gheorghe, Miercurea-Ciuc, and Brăila;
- in the last category we find towns with a strong industrial development in the communist period or municipalities that had a strong economic development between 1990 and 2000. The growth of the GDP per capita in 2013 compared to 2008 for these municipalities is upward, except for the city of Călăraşi (a relatively large decrease in the GDP per capita, by 8.4% in 2013 compared to 2008).
3. The tourism function - analyses and conclusions according to the results of the
methodology implemented. The relevant indicators for tourism function were as follows: Nights spent at tourist accommodation establishments - year 2012 (1); Number of tourists - year 2012 (2).
County seats were grouped into four size categories:
- the first category includes Bucharest, which has had an upward trend during the last ten years both in the nights spent at tourist accommodation establishments in Bucharest and an increase in the number of Romanian and foreign tourists;
- in the second category we find large cities such as Constanța, but also the tourist towns around the city; Brașov and its surroundings; Cluj-Napoca and Timișoara, with a spectacular evolution in tourism; an upward trend in the development of tourism is found in Sibiu, Iași, Oradea and Târgu Mureș;
- in the third category we find cities with high tourist potential, but still underscored;
- in the last category we find municipalities with low tourism potential and a very poor total score compared with the rest of the county residence cities.
4. The transport function - analyses and conclusions in accordance with the implemented
methodology results. The relevant indicators used to analyse the transport function were as follows: Airport with more than 20,000 passengers in 2012 (1); Port with more than 10,000 TEU container traffic in 2012. We took into account only ESPON 1.1.1 criteria.
Figure 4. Evaluation of the transport section for all county municipalities
In case of transportation, we considered four categories of cities and municipalities that do not have ports or airports and, therefore, were not analysed. As result:
- the first category includes Bucharest, with a passenger traffic of 7,500,000 passengers per year; Timișoara and Cluj-Napoca with around one million passenger traffic in 2012 and Constanța, with a transit of goods in the port of Constanţa of nearly 50,585 million tons;
- in the third category we find Iași, Sibiu, Brăila, and Galați. The first two, namely Iași and Sibiu, are important due to the number of passengers transiting through airports, while Brăila and Galați are important to the quantity of goods in transit through the two ports;
- the fourth category is represented by Arad, Oradea, Satu Mare, Baia Mare, Suceava and Craiova due to the number of passengers transiting through airports, and Tulcea, Călărași and Giurgiu for the amount of goods transited through their ports.
5. The education function - analyses and conclusions implemented in accordance with the
methodology results. The relevant indicators used were the following: Location of public universities in Romania - year 2012 (1); Location of private universities in Romania - year 2012 (2); Number of university students of county seats and Bucharest – year 2012 (3). Based on these combined indicators, we obtained the cartogram below (Figure 5).
Figure 5. Evaluation of the education section for all county municipalities
For the education section, just as in the case of the transport section, four county seat categories were considered, while those cases including a very low number of students were not considered.
- the first category includes Bucharest, Cluj-Napoca and Iași, which meet the European
criteria according of ESPON 1.1.1. methodology. We must note that compared to 2008, the number of students in 2013 has declined steadily, especially in Bucharest;
- in the second category we find the traditional university centres in Romania: Timișoara, Craiova, Brașov and Constanța;
- the fourth category of traditional universities includes Reşița and Baia Mare, as well as newly arising universities: Alba Iulia, Târgu Jiu, Satu Mare and Piatra-Neamț;
- the other county seats include those which have less than 2,000 students or those that have no students at all.
6. Potential index of Bucharest and county seat entities
The potential index of the county seats and Bucharest was developed based on the five combined indexes for population, economy, tourism, transport and education, without giving importance coefficients for each of them. A potential index is the sum of all five combined indexes for each county seat and the city of Bucharest. In this way, we obtained a score between 50 points (Bucharest) and 4 points (Vaslui). According to the potential index obtained for each county seat and Bucharest, we produced the potential cartogram of the main municipalities in Romania (Figure 6).
Figure 6. Evaluation of the composite index for the county municipalities
There are seven levels in the potential index:
- the first category is represented by Bucharest, which has very good scores for all 5 chapters; - the second category gathers Timișoara, Cluj-Napoca and Constanța which is considered the city that has a great potential for future development;
- in third category we find Iași, Brașov and Sibiu, these cities having a great development potential. Braşov was excluded due to the disadvantage of lacking an airport;
- the fifth category includes Brăila, Suceava, Baia Mare, Târgu Jiu, Târgoviște, Alba Iulia, Satu Mare, Râmnicu Vâlcea, Botoșani, Buzău, Piatra-Neamț, and Bistrița.
- the sixth category includes the following municipalities: Drobeta-Turnu Severin, Slatina, Tulcea, Focșani, Resița, Miercurea-Ciuc, and Deva.
- the seventh and final category includes the following municipalities: Giurgiu, Călărași, Alexandria, Zalău, Sfântu Gheorghe, Vaslui, and Slobozia.
CONCLUSIONS
In order to achieve an effective polycentric development, it is necessary to identify those cities that have the best chance to become the driving forces of regional development. Targeting this goal also requires assessing the ability of cities to generate and disperse development opportunities. This capacity is strongly influenced by: (a) the size of the city, which is often related to the level and spatial extent of infrastructure and services; (b) the activity profile; (c) the extent to which it is geared towards innovative sources of revenue and jobs. From a technical standpoint, the analyses reveal significant discrepancies within the series of municipalities and county seat concerning an unbalanced development of the national territory, which requires the implementation of national policies that build on the strengths of cities and highlight priority national projects. There are county seats (usually major cities in Romania) which have high values for all five sections of analysis and municipalities that have low values for all five sections. A scientific definition in the specific context of Romania is especially important to help identify potential areas, priority areas for interventions and sizes that can foster polycentric development. This scientific methodology clearly defines intra-regional, inter-regional and cross-border functional urban areas. Increased attractiveness is another important dimension of policentricity in county residence cities, a great responsibility in this regard returning to local authorities. In terms of spatial planning, polycentric development should pay more attention to the creation of corridors and roads linking urban centres. A multimodal transport system is of paramount importance to ensure connectivity and to broaden the scope of the labour market. Polycentric development is an effective way to alleviate regional imbalances and strengthen territorial cohesion by developing the transport infrastructure and supporting foreign investments. For this reason, policentricity is largely a function of connectivity, indicating the frequency and form of exchanges between urban centres, which requires the connection of the Transport Strategy with the Spatial Planning Strategy. The transport cartogram (Figure 4) also indicates the need to construct new airports, especially in the Brașov area, perhaps leading to a more rapid regional development, or in Galați-Brăila area, taking into account the size of the population concentrated in that area and also the need for massive investments to develop the region.
REFERENCES
BAUMONT, C. et al. (2004), Spatial Analysis of Employment and Population Density: The case of the Agglomeration of Dijon, Geographical Analysis, no. 36, pp. 146-176.
BECKMANN, M. J. (1958), City hierarchies and the distribution of city size, Economic Development and Cultural Change, no. 6, pp. 243‐248.
BURGER, M. J. et al. (2011), Heterogeneous development of metropolitan spatial structure: evidence
from commuting patterns in English and Welsh city-regions, 1981–2001, Cities, 28, pp. 160–
170.
COMMISSION OF THE EUROPEAN COMMUNITIES (2011), Territorial Agenda 2020 - Towards an Inclusive, Smart and Sustainable Europe of Diverse Regions, the Informal Ministerial Meeting of Ministers responsible for Spatial Planning, Gödöllő, Hungary.
CHRISTALLER. W., (1933), Die Zentralen Orte in Sueddeutschland, Eine oekonomisch - geographische Untersuchung ueber die Gesetzmaesigkeit der Verbreitung und Entwicklung der Siedlungen mit staedtischen Funktionen, Jena.
DAVOUDI, S. (2003), Polycentricity in European Spatial Planning: From an Analytical Tool to a Normative Agenda, European Planning Studies, Vol. 11, No. 8, 979-999.
ESKELINEN, H., FRITSCH, M. (2009), Polycentricity in the North-eastern Periphery of the EU Territory, European Planning Studies, Vol.17, No. 4, 605-619.
EUROPEAN SPATIAL PLANNING OBSERVATION NETWORK (2005), Potentials for
polycentric development in Europe, Final Report 1.1.1. Available from:
http://www.espon.eu/export/sites/default/Documents/Projects/ESPON2006Projects/ThematicP rojects/Polycentricity/fr-1.1.1_revised-full.pdf.
FALUDI, A. (2006), From European spatial development to territorial cohesion policy, Regional Studies, Vol. 40, No. 6, pp. 667-678.
FRIEDMANN, J. (1995), The World City Hypothesis, in: KNOX, P. L., TAYLOR, P. J. (eds.), World Cities in a World-System, Cambridge University Press, pp. 317-331.
FRIEDMANN, J. (2002), The Prospect of Cities, University of Minnesota Press, Minneapolis.
GORDON, P., RICHARDSON, H. W. (1996), Beyond Polycentricity: The Dispersed Metropolis, Los Angeles, 1970-1990, Journal of American Planning Association, Vol. 62, no. 3, pp. 289-295. GUILLAIN, R., GALLO, J. L., BOITEUX-ORAIN, C. (2004), The evolution of the spatial and
sectoral patterns in Ile-de-France over 1978-1997, 50th North American Meetings of the
Regional Science Association International (RSAI), Philadelphia, USA.
HALL, P. (2009), Polycentricity, in: KITCHIN, R., THRIFT, N. (eds.), The International Encyclopaedia of Human Geography, Vol. 8, Elsevier, Oxford, pp. 260‐264.
HOYLER, M. et al. (2008), Connecting Rhine-Main: The Production of Multi - Scalar Polycentricities
through Knowledge-Intensive Business Services”, Regional Studies, Vol. 42, No. 8, pp.
1095-1111.
KLOOSTERMAN, R., MUSTERED, S. (2001), The Polycentric Urban Region: Towards a Research
Agenda, Urban Studies, Vol. 38, No. 4, pp. 623–633.
KRÄTKE, S. (2007), Metropolisation of the European economic territory as a consequence of
increasing specialisation of urban agglomerations in the knowledge economy, European
Planning Studies, vol. 15, no. 1, pp. 1-27.
McMILLEN, D. P., McDONALD, J. F. (1998), Suburban Subcenters and Employment Density in Metropolitan Chicago, Journal of Urban Economics, No. 43, pp. 157-180.
McMILLEN, D. P., SMITH, S. (2003), The Number of Subcenters in Large Urban Areas, Journal of Urban Economics, No. 3, pp. 321-338.
MEIJERS, E. (2007), Synergy in Polycentric Urban Regions: Complementarity, Organising Capacity and Critical Mass, Sustainable Urban Areas, Vol.13, IOS Press, Amsterdam.
MEIJERS, E. (2008), Measuring polycentricity and its promises, European Planning Studies, vol. 16, no. 9, pp. 1313-1323.
MEIJERS, E., SANDBERG, K. (2008), Reducing regional disparities by means of polycentric development: Panacea or placebo?, Science Regionali: The Italian Journal of Regional Science, Vol.7, No. 2, pp. 71-96.
NORDREGIO (2004), Potentials for polycentric development in Europe, ESPON Final Report 1.1.1. PARR, J. B. (2004), The polycentric urban region: A closer inspection, Regional Studies, vol. 38, no.
3, pp. 231-240.
RIGUELLE, F. et al. (2007), Measuring Urban Polycentrism: a European Case Study and its implications, Journal of Economic Geography, vol. 7, no. 2, pp. 193-215.
ROBERTS, M. et al. (1999), Place and space in the networked city: Conceptualizing the integrated
SASSEN, SASKIA (1991), The Global City: New York, London, Tokyo, Princeton University Press, Princeton, New Jersey.
SASSEN, SASKIA(2011), Cities in a World Economy, 4th edition, Sage Publications.
TRULLÉN, J., BOIX, R. (2001), Economia della conoscenza e reti di città: Città creative nell’era
della conoscenza [The Knowledge Economy and City Networks: Creative Cities in the
Knowledge Era], Sviluppo Locale, Vol. 8, No.18, pp. 41-60.
VAN DER LAAN, L. (1998), Changing Urban Systems: An Empirical Analysis at Two Spatial Levels, Regional Studies, vol. 32, no. 3, pp. 235-247.