Thickness and Fuchs Endothelial Corneal Dystrophy
Robert P. Igo Jr.1, Laura J. Kopplin2,3, Peronne Joseph1, Barbara Truitt1, Jeremy Fondran1, David Bardenstein3, Anthony J. Aldave4, Christopher R. Croasdale5, Marianne O. Price6, Miriam Rosenwasser7, Jonathan H. Lass1,3., Sudha K. Iyengar1,3,8
*., for the FECD Genetics Multi-center Study Group"
1Department of Epidemiology and Biostatistics, Case Western Reserve University, Cleveland, Ohio, United States of America,2Department of Ophthalmology, Casey Eye Institute, Portland, Oregon, United States of America,3Department of Ophthalmology and Visual Sciences, Case Western Reserve University and University Hospitals Eye Institute, Cleveland, Ohio, United States of America,4The Jules Stein Eye Institute and the Department of Ophthalmology, David Geffen School of Medicine at University of California, Los Angeles, Los Angeles, California, United States of America,5David Duehr Dean Clinic, Madison, Wisconsin, United States of America,6Price Vision Group, Indianapolis, Indiana, United States of America,7Central Pennsylvania Eye Institute, Hershey, Pennsylvania, United States of America,8Department of Genetics, Case Western Reserve University, Cleveland, Ohio, United States of America
Abstract
Fuchs endothelial corneal dystrophy (FECD) is the most common late-onset, vision-threatening corneal dystrophy in the United States, affecting about 4% of the population. Advanced FECD involves a thickening of the cornea from stromal edema and changes in Descemet membrane. To understand the relationship between FECD and central corneal thickness (CCT), we characterized common genetic variation inCOL8A2andTCF4, genes previously implicated in CCT and/or FECD. Other genes previously associated with FECD (PITX2, ZEB1, SLC4A11), and genes only known to affect CCT (COL5A1, FOXO1, AVGR8, ZNF469) were also interrogated. FECD probands, relatives and controls were recruited from 32 clinical sites; a total of 532 cases and 204 controls were genotyped and tested for association of FECD case/control status, a 7-step FECD severity scale and CCT, adjusting for age and sex. Association of FECD grade withTCF4was highly significant (OR = 6.01 at rs613872;
p= 4.8610225), and remained significant when adjusted for changes in CCT (OR = 4.84;p= 2.2
610216). Association of CCT withTCF4was also significant (p= 6.161027), but was abolished with adjustment for FECD grade (p= 0.92). After adjusting
for FECD grade, markers in other genes examined were modestly associated (p , 0.001) with FECD and/or CCT. Thus, common variants inTCF4appear to influence FECD directly, and CCT secondarily via FECD. Additionally, changes in corneal thickness due to the effect of other loci may modify disease severity, age-at-onset, or other biomechanical characteristics.
Citation:Igo RP Jr, Kopplin LJ, Joseph P, Truitt B, Fondran J, et al. (2012) Differing Roles forTCF4andCOL8A2in Central Corneal Thickness and Fuchs Endothelial Corneal Dystrophy. PLoS ONE 7(10): e46742. doi:10.1371/journal.pone.0046742
Editor:Anneke I. den Hollander, Radboud University Nijmegen Medical Centre, Netherlands
ReceivedMay 31, 2012;AcceptedSeptember 4, 2012;PublishedOctober 23, 2012
Copyright:ß2012 Igo Jr. et al. This is an open-access article distributed under the terms of the Creative Commons Attribution License, which permits unrestricted use, distribution, and reproduction in any medium, provided the original author and source are credited.
Funding:This work was supported by the National Eye Institute (grant numbers R01EY16482, R21 EY015145, P30 EY11373), Research to Prevent Blindness and the Ohio Lions Eye Research Foundation. Some of the results of this paper were obtained by using the program package S.A.G.E., which is supported by a U.S. Public Health Service Resource Grant (RR03655) from the National Center for Research Resources. The funders had no role in study design, data collection and analysis, decision to publish, or preparation of the manuscript.
Competing Interests:Dr. Marianne Price is affiliated with Price Vision Group, Indianapolis, Indiana. This does not alter the authors’ adherence to all the PLoS ONE policies on sharing data and materials.
* E-mail: [email protected]
.These authors contributed equally to this work.
"Membership of FECD Genetics Multi-center Study Group is detailed in the Acknowledgments.
Introduction
The curvature, thickness, and function of the cornea are controlled by the fine structure of its five layers. Fuchs endothelial corneal dystrophy (FECD), which results in loss of vision associated with progressive corneal edema and loss of corneal transparency, is estimated to have a prevalence of approximately 4% in the United States [1,2], where it is one of the most common indications for corneal transplantation [3]. The principal defect in FECD is a decline in the number of functional corneal endothelial cells, with compensatory abnormalities, such as thickening of Descemet membrane, and subsequent thickening of the cornea due to edema. Thus, individuals with clinically advanced FECD have measurably thicker central corneas. In the initial stages of the
disease, excrescences form on Descemet membrane along with deposition of abnormal, excess collagen posterior to the membrane (the ‘‘posterior collagenous layer’’), resulting in the clinical and pathologic appearance of guttae [4]. Compromise of endothelial function may result in corneal stromal edema, epithelial edema, and painful bullous keratopathy. Penetrating or endothelial keratoplasty is the only definitive treatment, with palliative care the only option prior to surgery.
genes act in concert or independently. Variants in two genes, type VIII collagen, alpha 2 subunit (COL8A2) [13,14], and transcription factor 4 (TCF4) [15–19], have consistently shown association with FECD. Mutations in COL8A2 are rare in patient populations [20,21], but some, e.g., the missense mutations Leu450Trp and Gln455Lys, cause highly penetrant, early-onset, forms of the disease associated with thickening of Descemet membrane and subsequent increase in central corneal thickness (CCT) [13,14,22]. Other rare genetic variants inCOL8A2, however, are associated with corneal thinning in a Caucasian sample [23], as were common variants inCOL8A2in an Asian sample [24]; and corneal thinning was also associated with loss ofCOL8A2in animal models [25,26]. By contrast, non-coding common variants, e.g., rs613872, in TCF4 show strong association with disease, but it is unclear whether these variants directly mediate pathology [15–19].
These results point to shared genetic determinants for FECD, CCT and potentially other corneal endothelial dystrophies, acting to disorganize the corneal architecture. Some investigators have postulated that there is a continuum of disorders between many of the corneal endothelial dystrophies including posterior polymor-phous corneal dystrophy (PPCD), congenital hereditary endothe-lial dystrophy (CHED) and FECD [27], all of which share features of thickening the cornea [28,29]. Given that we examined genes for all three disorders, we also examined the phenotype of CCT to determine if these genes do play a role in Fuchs dystrophy by moderating the thickness or thinness of the cornea. Mutations in
PITX2, a developmental regulatory gene, have shown association with FECD [30], corneal thinning [31] and Axenfeld-Rieger syndrome [30,31]. Several other genes have been identified through genetic association studies as potential determinants of CCT [24,32,33], but have not been extensively tested in FECD patients (Table 1).
Here, we report results from an association analysis on a large sample of late-onset FECD cases and controls from the FECD Genetics Multi-center Study Group [10]. We surveyed common genetic variation in nine genes that may contribute to CCT, FECD and related corneal dystrophies for association with three phenotypes: FECD case-control status, a seven-step semi-quanti-tative FECD severity scale, and CCT. To distinguish direct effects
on CCT from corneal thickening secondary to FECD, we adjusted for CCT in analyses of FECD, and vice versa.
Materials and Methods
Ethics Statement
This work was performed in accordance with the tenets of the Declaration of Helsinki. Written informed consent was obtained from all participants. Data were collected under multi-center Institutional Review Board (IRB) approval.
Study sample
Families enriched in FECD and unrelated FECD controls were recruited by the FECD Genetics Multi-center Study, as previously described [10]. Only individuals of European descent were genotyped for this study, to minimize population heterogeneity; ethnic classification was self-reported.
The severity of FECD was assessed using a modified grading scale [1] with grades from 0 to 6. FECD controls were required to have no evidence of FECD (grade 0 in both eyes, indicating lack of guttae), whereas cases were defined as having a grade of 4 (2– 5 mm confluent guttae) or higher in the worse eye. Participants with grades 1–3 in the worse eye were considered missing for FECD case/control status, but were included in analyses of FECD grade (as intermediate cases) and CCT. Investigators were provided a grading scale with photographic examples of each grade, a training manual and video demonstration of slit-lamp biomicroscopy. A certification exam for grading FECD was also administered to investigators at the outset of the study (for details, see [10]).
Probands eligible for recruitment had an available histopathol-ogy specimen, containing the endothelial layer and Descemet membrane, from penetrating or endothelial keratoplasty; a pathology report; or a family member with advanced FECD confirmed by histopathological examination. Families containing a proband and a living relative (other than parents or children) were eligible for inclusion. Control subjects were matched to index cases by age, sex and ethnic group, and were required to have an FECD grade of 0 in both eyes.
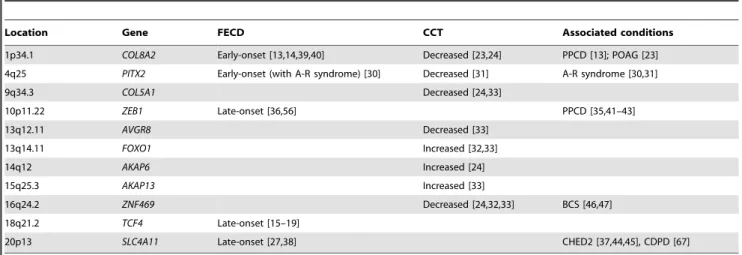
Table 1.Candidate genes for FECD and related diseases of the cornea.
Location Gene FECD CCT Associated conditions
1p34.1 COL8A2 Early-onset [13,14,39,40] Decreased [23,24] PPCD [13]; POAG [23] 4q25 PITX2 Early-onset (with A-R syndrome) [30] Decreased [31] A-R syndrome [30,31]
9q34.3 COL5A1 Decreased [24,33]
10p11.22 ZEB1 Late-onset [36,56] PPCD [35,41–43]
13q12.11 AVGR8 Decreased [33]
13q14.11 FOXO1 Increased [32,33]
14q12 AKAP6 Increased [24]
15q25.3 AKAP13 Increased [33]
16q24.2 ZNF469 Decreased [24,32,33] BCS [46,47]
18q21.2 TCF4 Late-onset [15–19]
20p13 SLC4A11 Late-onset [27,38] CHED2 [37,44,45], CDPD [67]
The columns FECD and CCT indicate whether genes have been implicated in Fuchs dystrophy and central corneal thickness, respectively. The effects on CCT are those for rare (variant) alleles; ‘‘Increased’’ and ‘‘Decreased’’ indicate that the variant (minor) allele is associated with an increase or decrease in CCT. A-R syndrome, Axenfeld-Rieger syndrome; PPCD, posterior polymorphous corneal dystrophy; POAG, primary open angle glaucoma; CHED, congenital hereditary endothelial dystrophy; CDPD, corneal dystrophy and perceptive deafness (Harboyan syndrome).
Eyes of FECD cases and relatives were excluded from the study for any of the following conditions: cataract surgery within one year of examination; history of blunt, penetrating or perforating trauma to the cornea; or evidence of another corneal endothelial dystrophy. In addition, eyes that had undergone penetrating or endothelial keratoplasty were excluded from analyses involving CCT. Exclusion criteria for unrelated controls included family history of heritable disease of the cornea, bilateral corneal surgery, perforating corneal trauma with scarring, refractive astigmatism of greater than 3.5 diopters, or a history of interstitial or infectious keratitis, anterior uveitis, or vascularization of the cornea.
CCT measurements were obtained by ultrasonic pachymetry. Pachymeters were used from the following manufacturers: Accutome, Malvern PA; Bausch and Lomb Surgical, Rancho Cucamonga, CA; DGH Technology, Exton PA; KMI Surgical, Downington, PA; Eye Technology, Inc., Ardmore, PA; Haag-Streit, Mason, OH; Sonogage, Cleveland, OH; Sonomed, New Berlin, WI; and Tomey, Phoenix, AZ.
Genotyping
SNPs were chosen from published reports on the genetics of FECD and related diseases of the cornea [14,15,30,32,34–38]. We selected two genes that have previously been associated with FECD: COL8A2 [13,14,39,40] and TCF4 [15–19]. We also selected genes predominantly associated with PPCD (ZEB1) [35,41–43], CHED (SLC4A11) [37,44,45], Axenfeld-Reiger Syn-drome (PITX2) [30,31], brittle cornea syndrome (ZNF469) [46,47] and with central corneal thickness (COL5A1[24,33],AVGR8[33],
FOXO1[32,33],AKAP6[24], andAKAP13[33]).
For the genes COL8A2, ZEB1 (TCF8), PITX2 and SLC4A11, additional SNPs were selected to capture common genetic variation, using Tagger [48]. Tag SNPs were identified under an
r2 threshold of 0.8, based on the linkage disequilibrium in the HapMap CEU sample. In addition, some SNPs were chosen from regions highly conserved among mammals.
DNA samples were obtained from study participants as described [10]. Samples were genotyped for candidate SNPs via two assays: TaqMan (Applied Biosystems, Carlsbad, CA) and LGC Genomics (formerly KBiosciences, Teddington, Middlesex, UK). For each assay, genotypes were automatically called by the Applied Biosystems Sequence Detection System software, and afterwards, clusters were manually reviewed. Twelve TaqMan assays with rare minor alleles were clustered manually. One TaqMan SNP was found to harbor a DNA copy-number variant on manual review, and was not used for SNP association analysis. For LGC Genomics genotyping, SNPs were automatically called via the KASP system (http://www.kbioscience.co.uk/reagents/ KASP.html) and viewed with LGC’s SNP Viewer software. The KASP assay uses fluorescent resonance energy transfer to suppress (quench) fluorescence in reporter oligonucleotides until they are incorporated into allele-specific PCR products.
Approximately 0.26% of the genotypes were manually called after inspection of the clusters. For both genotyping methods, SNPs were designed in-house and were validated by the respective companies. Ten DNA samples were omitted for analysis due to poor genotyping (call rate,95%). Eighteen SNPs with rare minor alleles (frequency,1% in the FECD sample) were not analyzed for SNP association.
Genotype data on 1092 individuals were downloaded from the 1000 Genomes Project database (http://www.1000genomes.org/; accessed February 1, 2012), October 2011 Integrated Variant Set (release ICHG2011), using the Data Slicer tool. Six individuals were omitted from calculations of allele frequencies because of family relationships with other members of the data set.
Statistical Analysis
Allele frequencies in FECD cases and controls were estimated by the maximum-likelihood approach for family data implement-ed in the FREQ program in the S.A.G.E. software package [49]. Association analysis with adjustment for family correlations was carried out using the GWAF package for R [50]. GWAF fits a linear mixed model for quantitative traits in which the SNP genotype is included as a fixed effect. Family correlations are modeled as a polygenic random effect. For binary (case/control) traits, GWAF estimates the correlation structure among relatives via a generalized-estimating-equation (GEE) model within the logistic regression framework. Age and sex were included as covariates in all analyses. In some analyses, the semi-quantitative FECD severity grade was included as a covariate affecting CCT, and vice versa. Association analyses incorporated an additive genetic model, with each minor allele exerting the same effect, unless fewer than ten individuals with the rare homozygous genotype were available, in which case the dominant model in the rare allele was used. Gene-by-gene interactions were coded as the product of the number of minor alleles at each SNP in the model. Meta-analysis combining results from published studies was conducted by inverse-variance-weighted averaging of log ORs. Adjustment for multiple testing was carried out through a Bonferroni correction based on the number of effective indepen-dent tests accounting for LD structure among SNPs in the same gene, as determined by the program SNPSpDlite (http://gump. qimr.edu.au/general/daleN/SNPSpDlite/) [51] using the esti-mate proposed by Li and Ji [52].
In haplotype-based association analyses, a subset of the genotyped sample comprising unrelated cases (mostly probands) and controls was selected (n= 245 cases and 158 controls). Haplotype frequencies and effects were estimated by linear regression with concurrent haplotype phasing, using the haplo.glm function of the R package HaploStats [53], and overall significance was measured by a score test implemented under the haplo.score function.
Results
Study sample
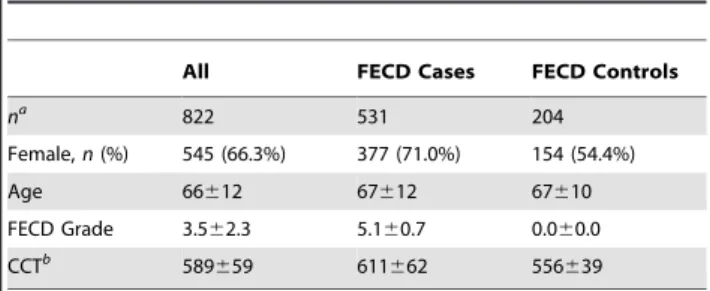
A total of 531 FECD cases with clinically significant disease and 204 controls were successfully genotyped (Table 2); 87 individuals had intermediate FECD status. Although a substantially greater proportion of cases were female (71%, vs. 54% in controls), the cases and controls were well matched in age (p.0.05 for difference in mean age, by Student’s t test). CCT in cases was overall
Table 2.Summary of genotyped samples.
All FECD Cases FECD Controls
na
822 531 204
Female,n(%) 545 (66.3%) 377 (71.0%) 154 (54.4%)
Age 66612 67612 67610
FECD Grade 3.562.3 5.160.7 0.060.0
CCTb 589
659 611662 556639
Unless otherwise indicated, statistics are shown as mean6SD.
aTotal includes 87 individuals with FECD grade of 1–3 in worse eye, not
classified as FECD cases or controls.
bAverage of two eyes, when available.
significantly greater than that in controls (p,1026
), with a mean thickness 55mm greater.
Association results for FECD case/control status and FECD grade
We found a highly significant association between FECD case/ control status and SNP rs613872 in TCF4 (p= 2.0610219; Table 3), confirming results from earlier studies [15–19]. The per-allele odds ratio (OR) of 6.01 is consistent with the large ORs reported originally in a Caucasian sample [15]. Consistent with this large effect, the frequency of the risk, or G, allele was much greater in cases (0.477) than in controls (0.191). The association remained very strong when FECD status was adjusted for CCT (p= 2.0610213), with an allelic OR of 4.84. We observed two other nominally significant associations with the binary FECD trait, one SNP each in pituitary homeobox 2 (PITX2) (rs17554590) and autogenous vein graft remodeling associated protein 8 (AVGR8) (rs1034200), with p values of 0.028 and 0.015, respectively, for FECD status adjusted for CCT (Table 3 and Table S1).
We obtained similar results from association analyses on the seven-step FECD severity scale taken as a quantitative trait (Table 4). The rs613872 variant inTCF4was highly significantly associated with FECD severity grade, whether adjusted for age and sex only (p= 4.8610225) or whether CCT was included as a covariate (p= 2.2610216). Each G allele of rs613872 was associated with a 1.15-unit increase in FECD severity grade when adjusted for age and sex only, and with a 1.02-unit increase when adjusted further for CCT in the eye with more severe FECD. Variation in rs613872 accounted for 10.9% and 9.6% of the
variance in CCT and CCT adjusted for FECD, respectively. Results for other variants were, in general, not significant (Table S2). However, the PITX2 SNP rs17554590 and AVGR8
SNP rs1034200 showed modest associations with FECD severity (p= 0.0073 and 0.019, respectively), as did one marker in zinc-finger protein 469 (ZNF469) (p= 0.0081), after adjustment for CCT (Table 4). These markers explained 0.6% (PITX2), 0.6% (AVGR8) and 0.4% (ZNF469) of the phenotype variance, respec-tively (Table S2). No SNP apart from rs613872 inTCF4reach a level of significance of p,0.0010, the Bonferroni-corrected threshold for an experiment-wide significance of 0.05 based on an effective number of 48 independent SNPs across all the genes, as determined by analysis of correlation among SNPs [51] (see Materials and Methods).
Meta-analysis for association ofTCF4SNP rs613872 with FECD
We combined our association result for rs613872 with data from previously published studies on Caucasian populations [15– 17,19] in an inverse-variance-weighted meta-analysis (Fig. 1). Sample sizes in the previous studies ranged from 350 to 790 combined FECD cases and controls. The combined OR for each G allele was 4.96 (95% CI = [4.25, 5.80];p= 2.0610289
).
Association results for CCT
In contrast to the FECD severity grade, association analyses for CCT yielded significant results on a large number of SNPs in several genes (Table 5 and Table S3). The G allele of rs613872 in
TCF4 was very strongly associated with increasing corneal thickness (p= 6.161027; Bonferroni-correctedp= 2.961025), with
Table 3.Association analyses for FECD case/control status.
FECD only Adjusted for CCT
Gene Chr SNPs Best SNP Position Ref. All.
OR
(95% CI) p
OR
(95% CI) p
COL8A2 1 15 rs7553155 36,568,236 A 0.72 (0.46, 1.13)*
0.19* 0.86 (0.50, 1.46)*
0.57*
PITX2 4 18 rs17554590 111,562,902 G 2.12 (0.91, 4.91)
0.081 2.70 (1.11, 6.57)
0.028 COL5A1 9 4 rs1536478 137,432,248 T 1.15
(0.88, 1.48)
0.30 1.07
(0.77, 1.47)
0.69
ZEB1 10 25 rs11008516 31,819,360 G 1.27
(0.88, 1.84)
0.20 1.23
(0.80, 1.88)
0.34
AVGR8 13 1 rs1034200 23,228,691 T 0.82 (0.62, 1.07)
0.14 0.66
(0.47, 0.92)
0.015 FOXO1 13 1 rs2755237 41,109,429 C 1.07
(0.75, 1.52)
0.72 1.38
(0.90, 2.12)
0.14
AKAP6 14 1 rs768787 33,046,471 T 0.99 (0.76, 1.27)
0.92 0.99
(0.71, 1.37)
0.96
AKAP13 15 1 rs6496932 85,825,567 A 0.82 (0.60, 1.12)
0.21 0.92
(0.60, 1.42)
0.71
ZNF469 16 5 rs9925231 88,338,107 T 0.96 (0.74, 1.23)
0.72 1.09
(0.81, 1.48)
0.56
TCF4 18 1 rs613872 53,210,302 G 6.01
(4.07, 8.87)
2.0610219 4.84 (3.18, 7.37)
2.0610213
SLC4A11 20 17 rs2144771 3,214,020 G 0.88 (0.68, 1.13)
0.32 0.82
(0.61, 1.11)
0.20
Chr., chromosome; No. SNPs, number of SNPs in or near gene passing QC; Best SNP, SNP with smallestpvalue; Position, physical map position (NCBI human genome build 36); Ref. All., reference (minor) allele; OR, odds ratio per copy of the reference allele (additive model) or for presence of minor allele (dominant model).pvalues in
each copy conferring an expected 18.6-mm increase in CCT. Eleven SNPs in or near COL8A2 show weak evidence for association with p,0.05, with one study-wide significant result with regard to rs4652900 (p= 7.861024
; Bonferroni-corrected
p= 0.037). Each copy of the minor allele of rs4652900 was associated with a 14.8-mm decrease in CCT (95% CI = [223.4, 26.2]). An analysis of interaction betweenTCF4SNP rs613872 and each of the SNPs inCOL8A2, including additive main effects and an interaction term, failed to detect significant gene-by-gene interaction effects (p.0.10 in all tests).
One SNP each in PITX2, collagen V subunit A1 (COL5A1),
AVGR8, andZNF469 were also associated with a thinner CCT with nominalp,0.05. All five zinc finger E-box-binding homeo-box 1 (ZEB1) SNPs tested were associated with modest increases in CCT, from 7 to 10mm per minor allele. Three SNPs in solute
carrier 4A11 (SLC4A11) had somewhat larger apparent effect sizes. The minor T allele of SNP rs6084312 was associated with an increase of about 14mm, whereas those of rs6051669 and
rs3803955 were associated with decreases of about 9 and 11mm,
respectively.
These associations generally persisted with no loss of signifi-cance when CCT was adjusted for FECD severity grade, with one important exception: evidence for association at rs613872 inTCF4
was reduced sharply with addition of FECD grade as a covariate, and the magnitude of the estimated per-allele effect fell significantly (effect =20.4mm, vs. 18.6mm). Otherwise, the
magnitude of effect sizes were overall maintained in the most strongly associated SNPs. One SNP, rs3803955 in SLC4A11, Table 4.Association analyses for FECD severity grade (worse eye).
Grade only Adjusted for CCT
Gene Chr. SNPs Best SNP Position Ref. All. Effect
(95% CI) P
Effect
(95% CI) p
COL8A2 1 15 rs7542594 36,593,856 A 20.23 (20.47, 0.01)
0.063* 0.09
(20.17, 0.36)* 0.50*
PITX2 4 18 rs17554590 111,562,902 G 0.18 (20.46, 0.82)
0.57* 0.96
(0.26, 1.66)
0.0073*
COL5A1 9 4 rs4840244 137,431,904 T 0.07 (20.14, 0.29)
0.51 0.00
(20.24, 0.24) 0.97
ZEB1 10 25 rs12217563 31,741,273 C 0.27
(0.04, 0.49)
0.020 20.02 (20.28, 0.24)
0.87
AVGR8 13 1 rs1034200 23,228,691 T 20.04 (20.27, 0.19)
0.72 20.35
(20.60,20.09)
0.0082 FOXO1 13 1 rs2755237 41,109,429 C 0.07
(20.21, 0.35)
0.62 0.22
(20.10, 0.53) 0.18
AKAP6 14 1 rs768787 33,046,471 T 20.12 (20.32, 0.08)
0.25 20.04
(20.26, 0.18) 0.73
AKAP13 15 1 rs6496932 85,825,567 A 20.20 (20.45, 0.06)
0.14 20.12
(20.41, 0.17) 0.41
ZNF469 16 5 rs9927272 88,346,709 G 0.12 (20.08, 0.33)
0.24 0.25
(0.03, 0.47)
0.024
TCF4 18 1 rs613872 53,210,302 G 1.15
(0.93, 1.36)
4.8610225 1.02 (0.78, 1.27)
2.2610216
SLC4A11 20 17 rs2422862 3,199,703 G 0.23 (20.04, 0.51)
0.097 0.11
(20.20, 0.43) 0.48
Chr., chromosome; No. SNPs, number of SNPs in or near gene passing QC; Best SNP, SNP with smallestpvalue; Position, physical map position (NCBI human genome build 36); Ref. All., reference (minor) allele; effect, expected change in FECD grade per copy of the reference allele (additive model) or for presence of minor allele (dominant model).pvalues initalicsare less than 0.05; inbold,less than 0.001 (the Bonferroni threshold for study-wide significance at the 0.05 level). *, dominant model.
doi:10.1371/journal.pone.0046742.t004
Figure 1. Meta-analysis for association ofTCF4SNP rs613872
with FECD case/control status.Horizontal lines denote the 95% CI
for the OR for each G allele at rs613872. The width of the squares indicating estimates of OR is proportional to the sample size in each study.
reached borderline study-wide significance (p= 0.0012; Bonfer-roni-correctedp= 0.058).
Haplotype-based analyses
Linkage disequibrium (LD) was extensive enough among SNPs in the same gene to warrant haplotype-based association analysis (Fig. S1). We conducted both LD-based analyses of SNPs within blocks of tight LD, and moving-window analyses with a window size of three SNPs. None of the analyses of FECD case/control status, FECD severity grade or CCT revealed any association peaks substantially stronger than the corresponding single-SNP analyses.
Analysis of rare variation inCOL8A2
Our lack of significant association betweenCOL8A2SNPs and FECD phenotypes, despite several reports linking the two [13,14,39,40], led us to examine population-level genetic variation in theCOL8A2 coding region. We surveyed available polymor-phism data on 1086 unrelated individuals from the 1000 Genomes Project database [54] for coding variants previously discovered in studies on FECD reporting sequence data [13,14,20,39,40,55] (Table S4). Two mutations identified as causal, Gln455Lys [13] and Leu450Trp [14], did not appear as variant loci in any of the 1000 Genomes samples (data not shown). Another missense mutation, Arg155Gln, previously associated with early-onset FECD [13], was found in East Asian samples (CHB + CHS +
JPT) with variant allele frequency 6.3%, but was present in Table 5.Nominally significant results from association analyses for CCT.
Gene/SNP Position Ref. Effect (95% CI) p Effect (95% CI) p
COL8A2
rs491603 36,532,316 T 213.1 (222.1,24.1) 0.0043 210.4 (218.2,22.6) 0.0090
rs538638 36,534,644 G 213.4 (226.5,20.4)* 0.043* 211.0 (222.2, 0.2)* 0.055* rs3754076 36,549,157 A 214.0 (227.1,20.9)* 0.036* 213.1 (224.4,21.9)* 0.022*
rs3767703 36,555,758 T 217.6 (231.5,23.6)* 0.014* 213.1 (225.2,21.0)* 0.033*
rs3738360 36,563,158 C 215.1 (228.3,21.8)* 0.026* 214.6 (226.0,23.2)* 0.012*
rs274754 36,565,617 G 211.0 (219.3,22.7) 0.0095 28.0 (215.1,20.8) 0.030
rs4652900 36,565,999 A 214.8 (223.4,26.2) 0.00078 211.6 (219.1,24.2) 0.0023
rs7550047 36,567,343 G 216.8 (229.9,23.7)* 0.012* 211.8 (223.1,20.5)* 0.049*
rs7553155 36,568,236 A 216.3 (228.7,23.9)* 0.010* 210.8 (221.5,20.0)* 0.049*
rs96067 36,571,920 G 214.0 (223.0,25.1) 0.0020 210.0 (217.7,22.4) 0.010
rs7542594 36,593,856 A 211.3 (219.4,23.2) 0.0062 29.0 (216.0,22.0) 0.012 PITX2
rs1947187 111,545,497 T 29.5 (218.4,20.6) 0.037 27.7 (215.4,20.0) 0.049 COL5A1
rs1409832 137,428,425 G 28.7 (216.4,21.0) 0.027 27.8 (214.4,21.2) 0.021 ZEB1
rs12217563 31,741,273 C 7.9 (0.3, 15.5) 0.042 6.8 (0.1, 13.4) 0.047
rs12781751 31,912,832 C 8.4 (1.7, 15.1) 0.014 7.0 (1.2, 12.8) 0.018
rs10763867 31,914,975 A 7.2 (0.5, 13.8) 0.035 7.3 (1.5, 13.0) 0.013
rs4747753 31,917,426 T 8.4 (1.5, 15.2) 0.016 7.3 (1.4, 13.2) 0.015
rs7092560 31,925,230 G 10.0 (2.6, 17.3) 0.0079 9.8 (3.4, 16.1) 0.0025
AVGR8
rs1034200 23,228,691 T 6.7 (20.9, 14.4) 0.084 9.8 (3.2, 16.4) 0.0035
ZNF469
rs12447690 88,298,124 C 26.6 (213.5, 0.3) 0.059 26.9 (212.8,20.9) 0.039
rs9938149 88,331,640 C 27.7 (214.3,21.0) 0.024 27.1 (212.9,21.4) 0.015
rs9927272 88,346,709 G 24.3 (210.9, 2.4) 0.21 25.8 (211.6,20.1) 0.047
TCF4
rs613872 53,210,302 G 18.6 (11.3, 25.9) 6.161027
20.4 (27.4, 6.6) 0.92
SLC4A11
rs6084312 3,211,235 T 14.2 (2.7, 25.8)* 0.016* 13.7 (3.8, 23.5) 0.0068*
rs3803955 3,214,126 T 210.5 (218.1,23.0) 0.0064 210.8 (217.4,24.3) 0.0012
rs6051669 3,216,203 T 28.6 (215.2,22.0) 0.011 28.5 (214.3,22.8) 0.0036
GenesFOXO1, AKAP6andAKAP13showed no significant associations, and therefore do not appear in this table. Position, physical map position (NCBI human genome build 36); Ref. All., reference (minor) allele; effect, expectedmm change in CCT per copy of the reference allele (additive model) or for presence of minor allele (dominant
European samples (CEU+FIN+GBR+IBS+TSI) at only 0.1% (Table S4). Only twoCOL8A2 coding variants, both silent, were present at a frequency of greater than 1% in Europeans: Pro586Pro [13] (2.1%) and Gly495Gly [39] (1.2%). The latter was very common in the East Asian samples (49.8%).
Discussion
Although several rare mutations causing familial, early-onset FECD and rare variants associated with late-onset FECD have been identified [13,14,27,30,38–40,56,57], our current knowledge of the heritable causes of late-onset FECD is severely limited. No causal variant has been identified that is common in the population and that is of relatively modest effect. To date, the locus most consistently replicated in association studies on late-onset FECD has been TCF4 [15–19]. In samples of European descent, highly significant association has been reported specifi-cally with a particular SNP, rs613872, with large per-allele ORs of between 4.0 and 5.5 [15–17,19], consistent with our estimate of 6.0 (Fig. 1). Because it resides in intron 3 ofTCF4, the causal locus at or captured by rs613872 is most likely a regulatory locus and not a coding variant. Indeed, the G allele of rs613872 was absent in a small Chinese sample of FECD cases and controls, but another SNP in intron 3, rs17089887, showed significant association with an odds ratio of 2.57 for each minor allele T [18]. These findings point to either an unknown, shared causal variant in the Chinese and European populations, or a multiplicity of common variants. Linkage to a broader region encompassing TCF4 has also been reported [16,58], strengthening the case that the association signals reflect true linkage disequilibrium between this SNP and a causal variant, although the action ofTCF4may be independent of the FCD2 locus at chromosome 18q21.2–21.32 [17]. The gene product ofTCF4,E2-2, is found in the developing corneal endothelium [15], but changes in the endothelial cell density associated with FECD are not apparent in carriers of the rs613872 G allele in early adulthood [59]. The precise mechanism by which E2-2 alters the structure of the cornea is unknown, but is likely to involve regulation of genes involved in cell growth and differentiation. E2-2, after binding tob-catenin, has been shown to maintain multipotency of corneal epithelial stem cells via theWnt1
pathway [60], and to activate ZEB1, a zinc-finger transcription factor which in turn is involved in dedifferentiation of epithelial cells [61] as well as mediating collagen I deposition. We have confirmed the association and strong effect of the rs613872 variant on FECD and CCT in our multi-center sample of FECD cases and controls. However, while the association with FECD persisted when the phenotype was adjusted for independent effects on CCT, the association with CCT was lost when CCT was adjusted for FECD grade, suggesting that this SNP, or the causal variant tagged by it, affects CCT via its influence on FECD severity.
In contrast, modest association between several SNPs in
COL8A2 and CCT remained when FECD severity grade was included in the analysis as a covariate, suggesting that variation in
COL8A2 may influence CCT independently of FECD. COL8A2
has been identified as a candidate locus for CCT in a genomewide association study (GWAS), i.e., a survey of common genetic variation [24]. Two genomewide significant SNPs in COL8A2
from this mixed-ethnic GWAS, rs96067 and rs7550047, were also associated in our FECD case/control sample, albeit less signifi-cantly (p.0.001). Other studies have either failed to detect association between COL8A2 and FECD or have not detected coding variants in COL8A2 segregating within FECD families [20,55].
Current evidence for the role of COL8A2 in FECD features high-penetrance, coding-sequence changes that are rare in the general population. Such mutations have often been implicated in early-onset FECD [13,14,39,40], with corroborating biological evidence from transgenic mice homozygous for the Gln455Lys mutation [62]. The 1000 Genomes data suggest that these variants are rare in populations of European descent, with allele frequencies below 1%. Notably, the best established functional variants–Gln455Lys [13] and Leu450Trp [14]–appear to be absent in all of the 1000 Genomes samples. Many implicated rare variants in COL8A2 occur in 1000 Genomes samples at a low frequency, and these warrant additional study, but more DNA sequence data from FECD affected and unaffected individuals are necessary. While the Leu450Trp [14] and Gln455Lys [13] mutations likely do play a role in early-onset FECD, as segregation with FECD has been demonstrated, segregation has not been demonstrated for any of the variants identified in late-onset FECD, the majority of which have also been identified in unaffected individuals [13,39]. In summary, genetic variation in
COL8A2spans a continuum of effect sizes and allele frequencies, from common variants affecting corneal thickness in normal populations to rare exonic variants causing early-onset FECD.
Our association results from genes other than TCF4 and
COL8A2 were quite illuminating regarding FECD pathogenesis and the underlying central corneal thickness. We observed no strong associations between FECD and SNPs in any of the other candidate genes in Table 1. Because these variants (except for
SLC4A11) were identified in samples ascertained for early-onset FECD, our lack of strong association findings in these genes is not surprising. Weak associations with FECD were observed between SNPs inPITX2, ZEB1, AVGR8 and ZNF469, and although the estimated effects were substantial (as high as 0.96 FECD grade units per allele) after adjustment for CCT, none reached study-wide significance.PITX2, in which mutations have been identified in Axenfeld-Rieger syndrome, appears to play an important role in development of the eye and structures derived from the pharyngeal arches [63]. We also observed a modest protective effect on FECD of the minor T allele of rs1034200 inAVGR8, a gene not previously implicated in FECD. Little is known about the function of AVGR8, which belongs to the ZNF family of transcription factors [33]. This result provides novel evidence for pleiotropic effects of genes involved in corneal development and molecular structure in FECD and CCT. Indeed, such relation-ships are expected, as described above in the case ofTCF4and
ZEB1.
We detected SNP associations with CCT in some, but not all, genes previously implicated.PITX2, ZEB1, ZNF469, andAVGR8
likely do have an effect on FECD pathogenesis, but were observed to have a much larger estimated effect on CCT, in terms of proportion of variance explained (Tables S2 and S3), which persisted after adjustment for FECD severity grade. Hence, a larger FECD sample would be expected to yield study-wide significant results, given the observed effects in this smaller sample. Our nominal (p,0.05) association findings with rs1034200 in
AVGR8, three SNPs in ZNF469 and with rs1409832 between
COL5A1andRXRA, were all genomewide significantly associated with CCT in recent GWAS [24,33]. As withCOL8A2, these genes were associated with an 8- to 16-mm change in corneal thickness in the present study, considerably larger than, albeit consistent with, the effects observed for genomewide significant SNPs in a recent GWAS (4–6mm) [24]. These larger estimates may be the result of
We also found SNPs inSLC4A11and ZEB1 to be associated with CCT. A role for SLC4A11has been suggested via a small number of late-onset FECD patients carrying coding-sequence mutations within samples of 89 mainly Chinese late-onset FECD patients [38], and 189 Caucasian nuclear families with late-onset FECD [27], with no apparent independent effect on CCT, although association was not established in these studies. Additionally, while nonsense mutations inZEB1have been shown to cause PPCD [34,41], missense mutations have been identified in, and presumed to be causative of, a small number of FECD cases [36,56]. While the potential role ofZEB1in the pathogenesis of FECD remains unclear, it has been proposed to modify FECD pathogenesis [56]. We propose that this modification may be through its effect on CCT.
The relatively large effect sizes attributable to candidate genes associated in this study with FECD and CCT suggest that they affect corneal structure. As a characteristic feature of FECD is a thickened Descemet membrane, and as increasing CCT is associated with even early grades of FECD, baseline corneal thickness prior to the progression to severe FECD is clearly important [64]. Variants in many genes change the architecture of the cornea, including the thickness and the elastic properties. Some variants only affect thickness while others cause sufficient disorganization of the structural proteins to cause widespread guttae and, therefore, FECD.
Although our results confirm the association the rs613872 variant inTCF4with FECD susceptibility, predictive value of the presence of the minor allele in identifying individuals at increased risk of developing FECD is limited. The minor G allele at rs613872 is very common, with a frequency of 18% in the HapMap CEU sample (as a surrogate for a general northern European population), and 19% in our control population. Given that 27% of the cases do not carry the minor allele at rs613872, and that our control sample is, on average, the same age as our cases and shows no evidence of FECD,TCF4risk appears neither necessary nor sufficient to develop disease. Early reports suggest that rs613872 is not the best marker in this gene across ethnic groups, and its frequency varies across the globe [16,18], but it may be feasible to use a composite risk score encompassing multiple markers at the TCF4 locus to predict risk. Prospective studies following individuals with susceptibility alleles inTCF4are warranted to determine what percentage of individuals with risk alleles will develop FECD in their lifetime. One application of such a risk score would be early identification of individuals for monitoring and interventions by physicians, although such preventative measures have yet to be developed. Such a risk score is already in practice for age-related macular degeneration, a common retinal disease with confirmed susceptibility loci that show large effect sizes similar to TCF4 and in aggregate yield receiver operator curves with areas under the curve greater than 80% [65,66]. Thus, a catalog of common genetic variation affecting corneal structure may be relevant to treatment of these diseases.
Supporting Information
Figure S1 Linkage disequilibrium patterns for genes
surveyed in association analyses for FECD and CCT.
Two plots are shown for each chromosome: D’ andr2. Only SNPs with MAF$1% are shown.
(PDF)
Table S1 Results from association tests for FECD case/
control status. Minor allele frequencies for FECD cases
(MAF_Cases) and controls (MAF_Controls) are included for each SNP. Only SNPs with MAF$1% in the combined sample are shown. Odds ratios (OR), 95% confidence intervals (95% CI) and
pvalues are listed for additive and dominant inheritance models and two statistical models: FECD status adjusted for age and sex (FECD,age, sex) and FECD adjusted for age, sex and average CCT (FECD,age, sex, avg. CCT).
(XLS)
Table S2 Results from association tests for FECD
severity grade (worse eye). Statistical models are FECD severity grade adjusted for age and sex (FECD Grade,age, sex) and grade adjusted for age, sex and CCT in the eye with more advanced FECD (FECD Severity Grade,age, sex, worse CCT). The percentage trait variance accounted for by each SNP (perc. var.), effect size in FECD grade units (Effect), 95% CI andpvalue are given for each test.
(XLS)
Table S3 Results from association tests for CCT,
adjusted for age and sex(CCT, age, sex) or for age,
sex, and FECD severity grade(worse eye) (CCT, age,
sex, FECD severity grade). Effect size is given in mm;
otherwise, quantities are as in Table S2. (XLS)
Table S4 Survey of the 1000 Genomes (October 2011)
and Exome Variation Server (EVS) variant data on
COL8A2 coding variants previously reported in the literature.Populations included are (list; including which make up European, African, East Asian, Hispanic). Data are grouped by variant, and at the top of each table are listed the physical map position (build 37) and the major and minor alleles (in European samples). 1000 Genomes data include numbers of individuals with 0 (m0), 1 (m1) and 2 copies of the minor allele, total major and minor alleles, and the minor allele frequency (MAF). EVS data include minor allele frequency in African Americans (AA) and Caucasians.
(XLS)
Acknowledgments
The full FECD Genetics Multi-Center Study group list was published previously [10].
Author Contributions
Conceived and designed the experiments: JHL SKI. Analyzed the data: RPI LJK. Wrote the paper: RPI LJK PJ BT AJA CRC MOP MR JHL SKI. Collected the sample: DB AJA CRC MOP MR JHL SKI Designed and maintained the database for study data: JF. Collected genotype data: PJ BT.
References
1. Krachmer JH, Purcell JJ Jr, Young CW, Bucher KD (1978) Corneal endothelial dystrophy. A study of 64 families. Arch Ophthalmol 96: 2036–2039. 2. Musch DC, Niziol LM, Stein JD, Kamyar RM, Sugar A (2011) Prevalence of
corneal dystrophies in the United States: estimates from claims data. Invest Ophthalmol Vis Sci 52: 6959–6963.
3. Eye Bank Association of America (2010) Statistical Report. Washington, DC: Eye Bank Association of America.
5. Gottsch JD, Sundin OH, Rencs EV, Emmert DG, Stark WJ, et al. (2006) Analysis and documentation of progression of Fuchs corneal dystrophy with retroillumination photography. Cornea 25: 485–489.
6. Wilson SE, Bourne WM, O’Brien PC, Brubaker RF (1988) Endothelial function and aqueous humor flow rate in patients with Fuchs’ dystrophy. Am J Ophthalmol 106: 270–278.
7. Alsbirk PH (1978) Corneal thickness. II. Environmental and genetic factors. Acta Ophthalm (Copenh) 56: 105–113.
8. Charlesworth J, Kramer P, Samples JR, Dyer T, Diego V, et al. (2010) The path to open angle glaucoma gene discovery: endophenotypic status of intraocular pressure, cup-to-disc ratio and central corneal thickness. Invest Ophthalmol Vis Sci 50: 4087–4090.
9. Landers JA, Hewitt AW, Dimasi DP, Charlesworth JC, Straga T, et al. (2009) Heritability of central corneal thickness in nuclear families. Invest Ophthalmol Vis Sci 50: 4087–4090.
10. Louttit MD, Kopplin LJ, Igo RP Jr, Fondran JR, Tagliaferri A, et al. (2012) A multi-center study to map genes for Fuchs’ endothelial corneal dystrophy: baseline characteristics and heritability. Cornea 31: 26–35.
11. Toh T, Liew SHM, MacKinnon JR, Hewitt AW, Poulsen JL, et al. (2005) Central corneal thickness is highly heritable: the Twin Eye Studies. Invest Ophthalmol Vis Sci 46: 3718–3722.
12. Zheng Y, Ge J, Huang G, Zhang J, Liu B, et al. (2008) Heritability of central corneal thickness in Chinese: the Guangzhou Twin Eye Study. Invest Ophthalmol Vis Sci 49: 4303–4307.
13. Biswas S, Munier FL, Yardley J, Hart-Holden N, Perveen R, et al. (2001) Missense mutations inCOL8A2, the gene encoding thea2 chain of type VIII collagen, cause two forms of corneal endothelial dystrophy. Hum Mol Genet 10: 2415–2423.
14. Gottsch JD, Sundin OH, Liu SH, Jun AS, Broman KW, et al. (2005) Inheritance of a novelCOL8A2mutation defines a distinct early-onset subtype of Fuchs corneal dystrophy. Invest Ophthalmol Vis Sci 46: 1934–1939.
15. Baratz KH, Tosakulwong N, Ryu E, Brown WL, Branham K, et al. (2010) E2-2 protein and Fuchs’s corneal dystrophy. N Engl J Med 363: 1016–1024. 16. Li Y-J, Minear MA, Rimmler J, Zhao B, Balajonda E, et al. (2011) Replication
ofTCF4through association and linkage studies in late-onset Fuchs endothelial corneal dystrophy. PLoS ONE 6: e18044.
17. Riazuddin SA, McGlumphy EJ, Yeo WS, Wang J, Katsanis N, et al. (2011) Replication of theTCF4intronic variant in late-onset Fuchs corneal dystrophy and evidence of independence from theFCD2locus. Invest Ophthalmol Vis Sci 52: 2825–2829.
18. Thalamuthu A, Khor CC, Venkataraman D, Koh LW, Tan DTH, et al. (2011) Association ofTCF4gene polymorphisms with Fuchs corneal dystrophy in the Chinese. Invest Ophthalmol Vis Sci 52: 5573–5578.
19. Kuot A, Hewitt AW, Griggs K, Klebe S, Mills R, et al. (2012) Association of TCF4 and CLU polymorphisms with Fuchs’ endothelial dystrophy and implication of CLU and TGFB1 proteins in the disease process. Eur J Hum Genet doi: 10.1038/ejhg.2011.248.
20. Kobayashi A, Fujiki K, Murakami A, Kato T, Chen LZ, et al. (2004) Analysis of COL8A2gene mutation in Japanese patients with Fuchs’ endothelial dystrophy and posterior polymorphous dystrophy. Jpn J Ophthalmol 48: 195–198. 21. Afshari NA, Li Y-J, Pericak-Vance MA, Gregory S, Klintworth GK (2009)
Genome-wide linkage scan in Fuchs endothelial corneal dystrophy. Invest Ophthalmol Vis Sci 50: 1093–1097.
22. Gottsch JD, Zhang C, Sundin OH, Bell WR, Stark WJ, et al. (2005) Fuchs corneal dystrophy: aberrant collagen distribution in an L450W mutant of the COL8A2gene. Invest Ophthalmol Vis Sci 46: 4504–4511.
23. Desronvil T, Logan-Wyatt D, Abdrabou W, Triana M, Jones R, et al. (2010) Distribution ofCOL8A2andCOL8A1gene variants in Caucasian primary open angle glaucoma patients with thin central corneal thickness. Mol Vision 16: 2185–2191.
24. Vithana EN, Aung T, Khor CC, Cornes BK, Tay W-T, et al. (2011) Collagen-related genes influence the glaucoma risk factor, central corneal thickness. Hum Mol Genet 20: 649–658.
25. Puk O, Dalke C, Calzada-Wack J, Ahmad N, Klaften M, et al. (2009) Reduced corneal thickness and enlarged anterior chamber in a novel ColVIIIa2G257D mutant mouse. Invest Ophthalmol Vis Sci 50: 5653–5661.
26. Hopfer U, Fukai N, Hopfer H, Wolf G, Joyce N, et al. (2005) Targeted disruption of Col8a1 and Col8a2 genes in mice leads to anterior segment abnormalities in the eye. FASEB J 19: 1232–1244.
27. Riazuddin SA, Vithana EN, Seet L-F, Liu Y, al-Saif A, et al. (2010) Missense mutations in the sodium borate cotransporterSLC4A11cause late-onset Fuchs corneal dystrophy. Hum Mutat 31: 1261–1268.
28. Ehlers N, Mo´dis L, Møller-Pedersen T (1998) A morphological and functional study of Congenital Hereditary Endothelial Dystrophy. Acta Ophthalmol Scand 76: 314–318.
29. Shimizu S, Krafchak C, Fuse N, Epstein MP, Schteingart MT, et al. (2004) A locus for posterior polymorphous corneal dystrophy (PPCD3) maps to chromosome 10. Am J Med Genet A 130A: 372–377.
30. Kniestedt C, Taralczak M, Phil L, Thiel MA, Stuermer J, et al. (2006) A novel PITX2mutation and a polymorphism in a 5-generation family with Axenfel-Rieger anomaly and coexisting Fuchs’ endothelial dystrophy. Ophthalmology 113: 1791–1797.
31. Asai-Coakwell M, Backhouse C, Casey RJ, Gage PJ, Lehmann OJ (2006) Reduced human and murine corneal thickness in an Axenfeld-Rieger syndrome subtype. Invest Ophthalmol Vis Sci 47: 4905–4909.
32. Lu Y, Dimasi DP, Hysi PG, Hewitt AW, Burdon KP, et al. (2010) Common genetic variants near the brittle cornea syndrome locusZNF469influence the blinding disease risk factor central corneal thickness. PLoS Genet 6: e1000947. 33. Vitart V, Bencˇic´ G, Hayward C, Herman JSˇ, Huffman J, et al. (2010) New loci associatied with central cornea thickness includeCOL5A1, AKAP13andAVGR8. Hum Mol Genet 19: 4304–4311.
34. Aldave AJ, Yellore VS, Yu F, Bourla N, Sonmez B, et al. (2007) Posterior polymorphous corneal dystrophy is associated withTCF8gene mutations and abdominal hernia. Am J Med Genet A 143A: 2549–2556.
35. Liskova P, Tuft SJ, Gwilliam R, Ebenezer ND, Jirsova K, et al. (2007) Novel mutations in the ZEB1 gene identified in Czech and British patients with posterior polymorphous corneal dystrophy. Hum Mutat 28: 638.
36. Mehta JS, Vithana EN, Tan DTH, Yong VHK, Yam GHF, et al. (2008) Analysis of the posterior polymorphous corneal dystrophy 3 gene,TCF8, in late-onset Fuchs endothelial corneal dystrophy. Invest Ophthalmol Vis Sci 49: 184– 188.
37. Vithana EN, Morgan P, Sundaresan P, Ebenezer ND, Tan DTH, et al. (2006) Mutations in sodium-borate cotransporterSLC4A11cause recessive congenital hereditary endothelial dystrophy (CHED2). Nat Genet 38: 755–757. 38. Vithana EN, Morgan PE, Ramprasad V, Tan DTH, Yong VHK, et al. (2008)
SLC4A11mutations in Fuchs endothelial dystrophy. Hum Mol Genet 17: 656– 666.
39. Mok J-W, Kim H-S, Joo C-K (2009) Q445V mutation inCOL8A2is associated with Fuchs’ corneal dystrophy in Korean patients. Eye 23: 895–903. 40. Hemadevi B, Srinivasan BS, Arunkumar J, Prajna N, Sundaresan P (2010)
Genetic analysis of patients with Fuchs endothelial corneal dystrophy in India. BMC Ophthalmol 10: 3.
41. Krafchak CM, Pawar H, Moroi SE, Sugar A, Lichter PR, et al. (2005) Mutations inTCF8cause posterior polymorphous corneal dystrophy and ectopic expression ofCOL4A3by corneal endothelial cells. Am J Hum Genet 77: 694–708. 42. Vincent AL, Niederer RL, Richards A, Karolyi B, Patel DV, et al. (2009)
Phenotypic characterisation and ZEB1 mutational analysis in posterior polymorphous corneal dystrophy in a New Zealand population. Mol Vision 15: 2544–2553.
43. Liskova P, Filipec M, Merjava S, Jirsova K, Tuft SJ (2010) Variable ocular phenotypes of posterior polymorphous corneal dystrophy caused by mutations in theZEB1gene. Ophthalm Genet 31: 230–234.
44. Jiao X, Sultana A, Garg P, Ramamurthy B, Vemuganti GK, et al. (2007) Autosomal recessive corneal endothelial dystrophy (CHED2) is associated with mutations inSLC4A11. J Med Genet 44: 64–48.
45. Ramprasad VL, Ebenezer ND, Aung T, Rajagopal R, Yong VHK, et al. (2007) Novel SLC4A11mutations in patients with recessive congenital hereditary endothelial dystrophy (CHED2). Hum Mutat 28: 522–523.
46. Abu A, Frydman M, Marek D, Pras E, Nir U, et al. (2008) Deleterious mutations in the zinc-finger 469 gene cause brittle cornea syndrome. Am J Hum Genet 82: 1217–1222.
47. Burkitt Wright EMM, Spencer HL, Daly SB, Manson FDC, Zeef LAH, et al. (2011) Mutations inPRDM5in brittle cornea syndrome identify a pathway regulating extracellular matrix development and maintenance. Am J Hum Genet 88: 767–777.
48. de Bakker PIW, Yelensky R, Pe’er I, Gabriel SB, Daly MJ, et al. (2005) Efficiency and power in genetic association studies. Nat Genet 37: 1217–1223. 49. S.A.G.E. (2011) Statistical Analysis for Genetic Epidemiology, version 6.1. 50. Chen M-H, Yang Q (2010) GWAF: an R package for genome-wide association
analyses with family data. Bioinformatics 26: 580–581.
51. Nyholt DR (2004) A simple correction for multiple testing for single-nucleotide polymorphisms in linkage disequilibrium with each other. Am J Hum Genet 74: 765–769.
52. Li J, Ji L (2005) Adjusting multiple testing in multilocus analyses using the eigenvalues of a correlation matrix. Heredity 95: 221–227.
53. Schaid DJ (2004) Evaluating associations of haplotypes with traits. Genet Epidemiol 27: 348–364.
54. 1000 Genomes Project Consortium (2010) A map of human genome variation from population-scale sequencing. Nature 467: 1061–1073.
55. Aldave AJ, Rayner SA, Salem AK, Yoo GL, Kim BT, et al. (2006) No pathogenic mutations identified in theCOL8A1andCOL8A2genes in familial Fuchs corneal dystrophy. Invest Ophthalmol Vis Sci 47: 3787–3790. 56. Riazuddin SA, Zaghloul NA, Al-Saif A, Davey L, Diplas BH, et al. (2010)
Missense mutations inTCF8 cause late-onset Fuchs corneal dystrophy and interact withFCD4on chromosome 9p. Am J Hum Genet 86: 45–53. 57. Riazuddin SA, Parker DS, McGlumphy EJ, Oh EC, Iliff BW, et al. (2012)
Mutations inLOXHD1, a recessive-deafness locus, cause dominant late-onset Fuchs corneal dystrophy. Am J Hum Genet 90: 533–539.
58. Sundin OH, Broman KW, Chang HH, Vito ECL, Stark WJ, et al. (2006) A common locus for late-onset Fuchs corneal dystrophy maps to 18q21.2-q21.32. Invest Ophthalmol Vis Sci 47: 3919–3926.
60. Lu R, Qu Y, Ge J, Zhang L, Su Z, et al. (2012) Transcription factorTCF4 maintains the properties of human corneal epithelial stem cells. Stem Cells 30: 753–761.
61. Sa´nchez-Tillo´ E, de Barrios O, Siles L, Cuatrecasas M, Castells A, et al. (2012)
b-Catenin/TCF4 complex induces the epithelial-to-mesenchymal transition (EMT)-activatorZEB1to regulate tumor invasiveness. Proc Natl Acad Sci USA 108: 19204–19209.
62. Jun AS, Meng H, Ramanan N, Matthaei M, Charkravarti S, et al. (2012) An alpha 2 collagen VIII transgenic knock-in mouse model of Fuchs endothelial corneal dystrophy shows early endothelial cell unfolded protein response and apoptosis. Hum Mol Genet 21: 384–393.
63. Bohnsack BL, Kasprick DS, Kish PE, Goldman D, Kahana A (2012) A zebrafish model of Axenfeld-Rieger syndrome reveals thatpitx2regulation by retinoic acid
is essential for ocular and craniofacial development. Invest Ophthalmol Vis Sci 53: 7–22.
64. Kopplin LJ, Przepyszny K, Schmotzer B, Rudo K, Babineau DC, et al. (2012) Relationship of Fuchs’ endothelial corneal dystrophy severity to central corneal thickness. Arch Ophthalmol 130: 433–439.
65. Jostins L, Barrett JC (2011) Genetic risk prediction in complex disease. Hum Mol Genet 20: R182–188.
66. Chen W, Stambolian D, Edwards AO, Branham KE, Othman M, et al. (2010) Genetic variants near TIMP3 and high-density lipoprotein-associated loci influence susceptibility to age-related macular degeneration. Proc Natl Acad Sci USA 107: 7401–7406.