ACPD
15, 23507–23541, 2015Emissions factors of pollutants from offshore vessels in
China
F. Zhang et al.
Title Page
Abstract Introduction
Conclusions References
Tables Figures
◭ ◮
◭ ◮
Back Close
Full Screen / Esc
Printer-friendly Version
Interactive Discussion
Discussion
P
a
per
|
Discussion
P
a
per
|
Discussion
P
a
per
|
Discussion
P
a
per
|
Atmos. Chem. Phys. Discuss., 15, 23507–23541, 2015 www.atmos-chem-phys-discuss.net/15/23507/2015/ doi:10.5194/acpd-15-23507-2015
© Author(s) 2015. CC Attribution 3.0 License.
This discussion paper is/has been under review for the journal Atmospheric Chemistry and Physics (ACP). Please refer to the corresponding final paper in ACP if available.
Emissions factors for gaseous and
particulate pollutants from o
ff
shore diesel
engine vessels in China
F. Zhang1,4, Y. Chen1,2, C. Tian1, J. Li3, G. Zhang3, and V. Matthias5
1
Key Laboratory of Coastal Environmental Processes and Ecological Remediation, Yantai Institute of Coastal Zone Research, Chinese Academy of Sciences (CAS), Shandong Provincial Key Laboratory of Coastal Environmental Processes, YICCAS, Yantai, Shandong 264003, China
2
Key Laboratory of Cities’ Mitigation and Adaptation to Climate Change in Shanghai (China Meteorological Administration), College of Environmental Science and Engineering, Tongji University, Shanghai 200092, China
3
State key Laboratory of Organic Geochemistry, Guangzhou Institute of Geochemistry, Chinese Academy of Sciences, Guangzhou Guangdong 510640, China
4
University of Chinese Academy of Sciences, Beijing 100049, China 5
ACPD
15, 23507–23541, 2015Emissions factors of pollutants from offshore vessels in
China
F. Zhang et al.
Title Page
Abstract Introduction
Conclusions References
Tables Figures
◭ ◮
◭ ◮
Back Close
Full Screen / Esc
Printer-friendly Version
Interactive Discussion
Discussion
P
a
per
|
Discussion
P
a
per
|
Discussion
P
a
per
|
Discussion
P
a
per
|
Received: 7 July 2015 – Accepted: 11 August 2015 – Published: 1 September 2015
Correspondence to: Y. Chen ([email protected]) and C. Tian ([email protected])
Published by Copernicus Publications on behalf of the European Geosciences Union.
ACPD
15, 23507–23541, 2015Emissions factors of pollutants from offshore vessels in
China
F. Zhang et al.
Title Page
Abstract Introduction
Conclusions References
Tables Figures
◭ ◮
◭ ◮
Back Close
Full Screen / Esc
Printer-friendly Version
Interactive Discussion
Discussion
P
a
per
|
Discussion
P
a
per
|
Discussion
P
a
per
|
Discussion
P
a
per
|
Abstract
Shipping emissions have significant influence on atmospheric environment as well as human health, especially in coastal areas and the harbor districts. However, the con-tribution of shipping emissions on the environment in China still need to be clarified especially based on measurement data, with the large number ownership of vessels
5
and the rapid developments of ports, international trade and shipbuilding industry. Pol-lutants in the gaseous phase (carbon monoxide, sulfur dioxide, nitrogen oxides, total volatile organic compounds) and particle phase (particulate matter, organic carbon, el-emental carbon, sulfates, nitrate, ammonia, metals) in the exhaust from three different diesel engine power offshore vessels in China were measured in this study.
Concen-10
trations, fuel-based and power-based emissions factors for various operating modes as well as the impact of engine speed on emissions were determined. Observed con-centrations and emissions factors for carbon monoxide, nitrogen oxides, total volatile organic compounds, and particulate matter were higher for the low engine power vessel than for the two higher engine power vessels. Fuel-based average emissions factors
15
for all pollutants except sulfur dioxide in the low engine power engineering vessel were significantly higher than that of the previous studies, while for the two higher engine power vessels, the fuel-based average emissions factors for all pollutants were com-parable to the results of the previous studies. The fuel-based average emissions factor for nitrogen oxides for the small engine power vessel was more than twice the
Inter-20
national Maritime Organization standard, while those for the other two vessels were below the standard. Emissions factors for all three vessels were significantly different during different operating modes. Organic carbon and elemental carbon were the main components of particulate matter, while water-soluble ions and elements were present in trace amounts. Best-fit engine speeds during actual operation should be based on
25
ACPD
15, 23507–23541, 2015Emissions factors of pollutants from offshore vessels in
China
F. Zhang et al.
Title Page
Abstract Introduction
Conclusions References
Tables Figures
◭ ◮
◭ ◮
Back Close
Full Screen / Esc
Printer-friendly Version
Interactive Discussion
Discussion
P
a
per
|
Discussion
P
a
per
|
Discussion
P
a
per
|
Discussion
P
a
per
|
1 Introduction
Gaseous and particulate pollutants emitted from vessels operating in the open ocean as well as in coastal areas and inland waterways have significant adverse impacts on human health, air quality, and climate change (Cappa et al., 2014; Righi et al., 2011; Marmer and Langmann, 2005; Winebrake et al., 2009). It has been estimated
5
that 87 000 premature deaths occurred in 2012 due to burning of marine fuels with high sulfur content. Shipping-related particulate matter (PM) emissions have been re-ported to be responsible for approximately 60 000 cardiopulmonary and lung cancer deaths annually, with most cases occurring near coastlines in Europe (Viana et al., 2014), East Asia, and South Asia (Corbett et al., 2007). Approximately 9200 and
10
5200 t yr−1 of PM are emitted from oceangoing and coastal ships, respectively, in the USA (Corbett, 2000), with most of which are fine or even ultrafine aerosols (Viana et al., 2009; Saxe and Larsen, 2004). Globally, about 15 % of nitrogen oxides (NOx) and 5– 8 % of sulfur oxides (SOx) emissions are attributable to oceangoing ships (Corbett, 2000). Shipping emissions affect acid deposition and ozone concentrations,
contribut-15
ing>200 mg S m−2yr−1over the southwestern British Isles and Brittany as well as an additional 6 ppb surface ozone during the summer over Ireland (Derwent et al., 2005). Moreover, aerosol emissions from international shipping also greatly impact the Earth’s radiation budget, directly by scattering and absorbing solar radiation and indirectly by altering cloud properties (Righi et al., 2011). Because nearly 70 % of ship emissions
20
are estimated to occur within 400 km of land (Endresen, 2003), ships have the potential to contribute significantly to air quality degradation in coastal areas. In addition, ports are always the most concentrated areas for ships to berth at, emission reduction mea-sures such as switching heavy fuels to cleaner fuels are required when ships are close to ports or offshore areas, but not all of them can obey the regulations (De Meyer et al.,
25
2008), which result in significant influence on atmospheric environment of port cities and regions.
ACPD
15, 23507–23541, 2015Emissions factors of pollutants from offshore vessels in
China
F. Zhang et al.
Title Page
Abstract Introduction
Conclusions References
Tables Figures
◭ ◮
◭ ◮
Back Close
Full Screen / Esc
Printer-friendly Version
Interactive Discussion
Discussion
P
a
per
|
Discussion
P
a
per
|
Discussion
P
a
per
|
Discussion
P
a
per
|
Rapid developments of ports, international trade, and the shipbuilding industry in China have negatively affected the ambient air quality of the coastal zone due to ship-ping emissions. In 2013, there were 0.18 million water transport vessels (Ministry of Transportation, 2013) active in Chinese waters, 8 ports in China were listed among the world’s largest 10 ports, and 11 container ports were listed among the world’s largest
5
20 container ports. The number of ports with cargo handling capacity of more than 200 million t yr−1 grew to 16 (Ministry of Transportation, 2010). Rapid development of ports in China has resulted in increasingly serious pollution of ambient air, particularly in coastal zones and near ports. Only a few studies have focused on pollution from shipping emissions in China. Rough estimates of the influence of shipping emissions
10
on ambient air in the port of Shanghai, the largest port in China (Zhao et al., 2013), and in the Bohai Rim (Zhang et al., 2014) that have been generated using empirical formulas. One case study of real-world emissions of inland vessels on the Grand Canal of China has been conducted (Fu et al., 2013). Other studies also have developed to the inventories in large ports or delta regions (Zheng et al., 2011, 2009) by using EFs
15
obtained from other countries or areas. However, there are no systematic studies of vessel emissions in the coastal zone or in ports, nor accurate estimates of shipping emissions to ambient air based on measured emission factors (EFs). Conditions in China differ substantially from those in other countries, such as in vessel types (more small motor vessels), use of bunker oil (fuel meeting the GB/T 17 411–1998 standard,
20
which is less stringent than the ISO 8217–2010 international standard), age of vessels (Chinese commercial vessels have an average age of 19.2 yr compared with 8.0 and 8.9 yr for Japan and Germany, respectively). Thus, experimentally determined EFs for vessels in other countries cannot be used directly to estimate shipping emissions and their contribution to ambient air quality in China. Systematical experimental
measure-25
ment EFs for different kinds of vessels in China is essential.
ACPD
15, 23507–23541, 2015Emissions factors of pollutants from offshore vessels in
China
F. Zhang et al.
Title Page
Abstract Introduction
Conclusions References
Tables Figures
◭ ◮
◭ ◮
Back Close
Full Screen / Esc
Printer-friendly Version
Interactive Discussion
Discussion
P
a
per
|
Discussion
P
a
per
|
Discussion
P
a
per
|
Discussion
P
a
per
|
of these studies have been carried out by performing tests on-board the vessel from the exhaust pipe (Agrawal et al., 2008; Murphy et al., 2009; Fridell et al., 2008; Juwono et al., 2013; Moldanova et al., 2013) or by taking measurements within the exhaust plumes (Sinha et al., 2003; Chen et al., 2005; Lack et al., 2009; Murphy et al., 2009; Berg et al., 2012; Pirjola et al., 2014; Petzold et al., 2008). NOx, carbon monoxide
5
(CO), sulfur dioxide (SO2), and PM are the main constituents of shipping emissions (Moldanova et al., 2009; Williams et al., 2009; Agrawal et al., 2008; Poplawski et al., 2011; Endresen, 2003) that have been quantified. In addition, black carbon (BC) (Lack and Corbett, 2012; Sinha et al., 2003; Moldanova et al., 2009; Corbett et al., 2010) and cloud condensation nuclei (CCN) (Sinha et al., 2003; Lack et al., 2011) also have
10
been reported in some studies. Reported emissions factors for CO, SO2, NOx, PM, and BC are in the range of 0.5–16, 2.9–44, 22–109, 0.3–7.6, and 0.13–0.18 g kg−1
fuel, respectively, and 0.2–6.2×10¹⁶particles kg−1fuel for CCN. The IMO has set the emission limits for NOxand SOxin the revised MARPOL (Maritime Agreement Regard-ing Oil Pollution) Annex VI rules (IMO, 1998). Even more strRegard-ingent limits have been laid
15
down in some national or regional regulations. For example, the EU environment minis-ters had limited the use of fuels of 1.5 % sulfur (by mass) by all ships in the Baltic Sea, North Sea and English Channel in June 2004 (Eyring, 2005), and the ships operating in the Baltic Sea must use reduced-sulfur fuels (fuel sulfur content less than or equal to 1 % by mass) since 1 July 2010, and even lower sulfur fuels of 0.1 % in January 2015.
20
Additionally, in some ports such as EU ports, seagoing ships at berth are required to switch into using fuels of under 0.1 % sulfur (European Union, 2012). But in China, no specific policy or limit for shipping emissions has been implemented except in Hong Kong, which is making legislation about the limit of 0.5 % sulfur content fuel used when berth in the port from 2015.
25
Average EFs are often used for shipping emissions inventories on large scales or in regional areas (Tzannatos, 2010; Eyring, 2005). However, to evaluate the effects of shipping emissions on air pollution in local areas such as near ports, various ship speeds and operating modes should be considered, including docking, berthing, and
ACPD
15, 23507–23541, 2015Emissions factors of pollutants from offshore vessels in
China
F. Zhang et al.
Title Page
Abstract Introduction
Conclusions References
Tables Figures
◭ ◮
◭ ◮
Back Close
Full Screen / Esc
Printer-friendly Version
Interactive Discussion
Discussion
P
a
per
|
Discussion
P
a
per
|
Discussion
P
a
per
|
Discussion
P
a
per
|
departing from ports etc. Previous studies have confirmed that EFs are significantly different under various load conditions (Petzold et al., 2010) or in different operating modes (Fu et al., 2013; Winnes and Fridell, 2010) for individual vessels. Therefore, more detailed measurements of EFs in different operating modes are necessary to better estimate the impacts of shipping emissions on the environment.
5
In this study, experimental data for three different diesel engine power vessels were collected. All pollutants were measured directly in the stack. Gaseous emissions and PM from the diesel engines were the main targets, including CO, carbon dioxide (CO2), SO2, NOx, total volatile organic compounds (TVOCs), and total suspended particulates
(TSP). Fuel-based EFs for the three vessels were calculated using the carbon balance
10
method under different operating conditions. In addition, fuel-based average EFs as well as power-based average EFs to values reported in other studies and for other vessels were compared. Finally, the impacts of engine speed on the EFs of NOx were evaluated.
2 Experimental 15
2.1 Test vessels and fuel types
Three different diesel engine power offshore vessels, including one engineering vessel,
Haohai 0007(HH), with low power and high speed engine, one large research ves-sel,Dongfanghong 2(DFH), with high power and medium speed engine, and another research vessel, Xiangyanghong 08 (XYH), with medium power and medium speed
20
engine were selected for this study, whose technical parameters are shown in Table 1. High speed and medium speed engines are the predominant engines used in vessels of offshore and inland rivers in China, which always take light diesel as fuel. Engi-neering vessels are designed for construction activities such as building docks in port areas or waterways, dredging, etc. They are common vessels in coastal areas of China
25
mainte-ACPD
15, 23507–23541, 2015Emissions factors of pollutants from offshore vessels in
China
F. Zhang et al.
Title Page
Abstract Introduction
Conclusions References
Tables Figures
◭ ◮
◭ ◮
Back Close
Full Screen / Esc
Printer-friendly Version
Interactive Discussion
Discussion
P
a
per
|
Discussion
P
a
per
|
Discussion
P
a
per
|
Discussion
P
a
per
|
nance of engineering vessels is typically poorer than for other types of vessels and as a result, they may have relatively high emissions. On the other hand, research vessels of DFH and XYH from universities and research institutes are generally well maintained and use high-quality diesel fuel but with different engine powers, which might have rel-atively low emission factors for pollutions. Therefore, these research vessels can reflect
5
the impact of engine power on emissions and also can represent the lower end of ex-pected EFs for Chinese vessels. In all, a general range of EFs for gaseous and PM pollutants emitted from different offshore vessels of China and their influence factors could be given through the on-board measurement.
The fuels used in all test vessels were common diesel fuels obtained from fueling
10
stations near the ports. Results of fuel analyses are presented in Table 2. All of these fuels had relatively low sulfur contents (≤0.13 % m) and low metals concentrations (V, Al, Si, Pb, Zn, Mn, etc.).
2.2 Test operating modes
As noted above, EFs are significantly different under differing load conditions and
oper-15
ating modes. In this study, vessel operating modes were classified according to actual sailing conditions. There were six modes of HH: low speed (4 knots), medium speed (8 knots), high speed (11 knots), acceleration process, moderating process and idling, four modes of DFH: cruise (10 knots, medium speed for DFH), acceleration process, moderating process and idling, and five modes of XYH: low speed (3 knots), high speed
20
(10 knots), acceleration process, moderating process and idling. Three to five groups of replicate samples were collected for each operating mode.
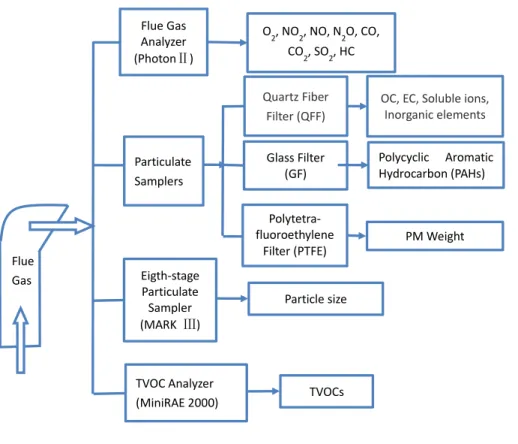
2.3 Emissions measurement system and chemical analysis of particulate matter
A combined on-board emissions test system (Fig. 1) was used to measure emissions
25
from the coastal vessels under actual operating conditions. There was no dilution in
ACPD
15, 23507–23541, 2015Emissions factors of pollutants from offshore vessels in
China
F. Zhang et al.
Title Page
Abstract Introduction
Conclusions References
Tables Figures
◭ ◮
◭ ◮
Back Close
Full Screen / Esc
Printer-friendly Version
Interactive Discussion
Discussion
P
a
per
|
Discussion
P
a
per
|
Discussion
P
a
per
|
Discussion
P
a
per
|
this test system with all the species measured directly from the exhaust. Detailed com-positions were given as follows: a slender tube was placed into the vessel exhaust pipe to extract flue gas. The sample was then divided into five subsamples through a man-ifold for different analyses and evacuation of the excess gas. There were four main components of the system: a flue gas analyzer, three particulate samplers, an
eight-5
stage particulate sampler, and a TVOC analyzer (see Supplement for more details). All analytes are also shown in Fig. 1: the flue gas analyzer (Photon II) is aimed to test instantaneous emissions of gaseous pollutions, including O2, NO2, NO, N2O, CO, CO2 and SO2. Three particulate samplers are installed to collect PM using different filters at the same time, including quartz fiber filter, glass filter and polytetrafluoroethylene filter
10
to analyze different chemical components of PM. And the portable TVOC Analyzer is used to monitor the concentration of total VOCs with isobutylene as correction coeffi -cient gas. Besides, a temperature sensor is installed near the smoke outlet to test the flue gas temperature. A total of 33 sets of samples for HH, 20 sets for DFH and 23 sets for XYH were collected, with 3 to 5 sets for each operating mode.
15
The OC and EC were measured on a 0.544 cm2quartz filter punched from each filter by thermal optical reflectance (TOR) following the IMPROVE protocol with a DRI Model 2001 Thermal/Optical Carbon Analyzer (Atmoslytic Inc., Calabasas, CA). The measur-ing range of TOR was from 0.05 to 750 µg C cm−2with an error of less than 10 %. Con-centrations of water soluble ions in PM2.5, such as Na+, NH+4, K+, Mg2+, Ca2+, Cl−,
20
NO−
3 and SO 2−
4 , were determined by Ion Chromatography (Dionex ICS3000, Dionex
Ltd. America) based on the measurement method of Shahsavani et al. (Shahsavani et al., 2012). The detection limit was 10 ng mL−1 with an error of less than 5 %, and 1 mL RbBr with concentration of 200 ppm was put in the solution as internal standard before sampling. The concentrations of 33 inorganic elements in PM2.5were estimated
25
ACPD
15, 23507–23541, 2015Emissions factors of pollutants from offshore vessels in
China
F. Zhang et al.
Title Page
Abstract Introduction
Conclusions References
Tables Figures
◭ ◮
◭ ◮
Back Close
Full Screen / Esc
Printer-friendly Version
Interactive Discussion
Discussion
P
a
per
|
Discussion
P
a
per
|
Discussion
P
a
per
|
Discussion
P
a
per
|
2.4 Data analysis
Carbon balance formula was used to calculate the EFs for all exhaust gas components. It was assumed that all carbon in the fuel was emitted as carbon-containing gases (CO, CO2, and TVOC) and carbon-containing particulate matter. So there was a certain equilibrium relationship between the carbon in the fuel and in the exhaust:
5
CF=RFG×(c(CCO)+c(CCO
2)+c(CPM)+c(CTVOC)) (1)
whereCFrepresents the mass of C in per kg diesel fuel (g C kg−1fuel);RFGrepresents the flue gas emissions rate (m3kg−1fuel); andc(CCO),c(CCO2),c(CPM), andc(CTVOC) represent the mass concentrations of carbon as CO, CO2, PM, and TVOC (g C m−3) in the flue gas, respectively.
10
The EF for CO2was calculated as follows:
EFCO
2=RFG·c(CO2)·MCO2 (2)
where EFCO
2 is the EF for CO2(g kg
−1fuel),c(CO
2) is the molar concentration of CO2
(mol m−3), andMCO2 is the molecular weight of CO2(44 g mol−1). The remaining EFs were calculated as follows:
15
EFx= ∆X
∆CO2·
MX
MCO2 ·EFCO2 (3)
where EFx is the EF for speciesX (g kg−1 fuel),X and CO2represent the concentra-tions ofX and CO2with the background concentrations subtracted (mol m−3), andMX
represents the molecular weight of speciesX (g mol−1).
In addition, average EFs for each vessel were calculated based on actual operating
20
conditions, as follows:
EFX,A=X
X,iEFi×Pi (4)
ACPD
15, 23507–23541, 2015Emissions factors of pollutants from offshore vessels in
China
F. Zhang et al.
Title Page
Abstract Introduction
Conclusions References
Tables Figures
◭ ◮
◭ ◮
Back Close
Full Screen / Esc
Printer-friendly Version
Interactive Discussion
Discussion
P
a
per
|
Discussion
P
a
per
|
Discussion
P
a
per
|
Discussion
P
a
per
|
where EFX,A is the average EF for species X, EFi is the EF for operating mode i
for speciesX, and Pi is the percentage of time spent in operating modei during the
shipping cycle.
3 Results and discussion
3.1 Concentrations in shipping emissions 5
Concentrations of CO, NOx, SO2, TVOC, and PM from the three vessels are shown in Fig. A1. Nearly all of the concentrations measured in the exhaust of low engine power vessel HH were higher than those of the two higher engine power vessels. Concentra-tions of CO, SO2, and NOx from HH were 10.7–756, 5.34–33.1, and 87.8–1295 ppm, respectively, and 14.3–59.5 mg m−3PM. In contrast, concentrations of CO, SO2, NOx,
10
and PM were 50.1–141, 5.27–16.9, 169–800 ppm and 7.06–21.8 mg m−3, respectively,
for DFH and 36.0–224, 0.49–35.9, and 235–578 ppm and 0.56–6.31 mg m−3, respec-tively, for XYH.
A previous study demonstrated that concentrations of CO primarily depend on en-gine power, with higher CO emissions resulting from vessel enen-gines with lower power
15
(Sinha et al., 2003). There was a similar trend in this study with generally higher con-centrations for HH and lower concon-centrations for DFH. The CO concon-centrations in the present study were similar but slightly lower than those of inland vessels (Fu et al., 2013), except in the idling mode of HH. In different operating modes, CO concentra-tions were significantly different. For example, the maximum value was observed in
20
idling mode and the minimum value in medium speed mode for HH. All three ships had the lowest CO concentrations at their economic speeds (medium speed for HH, cruise mode for DFH, and high speed for XYH), demonstrating that their engines are optimized for the most common operating mode.
More than 80 % of the NOxwas NO in this study, with NO2and N2O accounting for
25
ACPD
15, 23507–23541, 2015Emissions factors of pollutants from offshore vessels in
China
F. Zhang et al.
Title Page
Abstract Introduction
Conclusions References
Tables Figures
◭ ◮
◭ ◮
Back Close
Full Screen / Esc
Printer-friendly Version
Interactive Discussion
Discussion
P
a
per
|
Discussion
P
a
per
|
Discussion
P
a
per
|
Discussion
P
a
per
|
higher in the exhaust gas of HH than in that of the two vessels. In high speed modes, all of the vessels had high concentrations of NOx. NOx emissions mainly depend on the combustion temperature of the engines. More powerful combustion systems operate at higher temperatures, thereby producing more NOx (Corbett, 1999). However, the NOx emissions were much lower than for the inland vessels studied by Fu et al. (Fu et al.,
5
2013), particularly in cruise mode (NOxconcentrations of∼1000 ppm).
SO2concentrations in the exhaust gas depend on the sulfur content of the fuel and the flow rate of the flue gas. There were significant differences among the three vessels in their flow rates, which could account for the different concentrations of one vessel in different operating modes. But because of the low-sulfur fuels used in these vessels,
10
the SO2concentrations were low compared with those in other studies (Williams et al., 2009; Berg et al., 2012).
Much lower concentrations of PM in the exhaust gas were observed in the present study compared to those of inland ships in China (Fu et al., 2013). However, they were similar to those from ships at berth reported by Cooper et al. (Cooper, 2003). HH
15
had higher PM concentrations than the two vessels in the exhaust gas. There were significant differences among the different operating modes because of changes in the injection point of the engines (Sippula et al., 2014; Li et al., 2014).
3.2 Fuel-based emissions factors
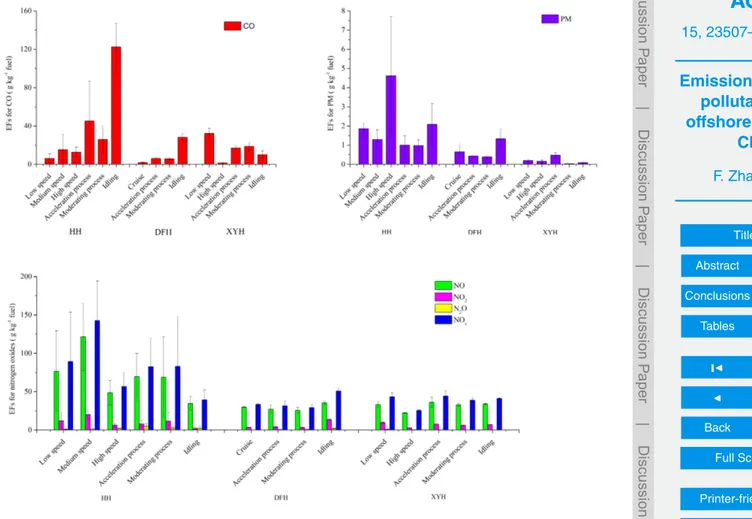
Fuel-based EFs for the gaseous species CO2, CO, NO, NO2, N2O, and TVOCs and
20
for PM based on the carbon balance method were determined. In addition, SO2 was calculated based on the sulfur content of the fuels. Fuel-based EFs for the typical pollutants such as CO, PM and nitrogen oxides in different operating modes are shown in Fig. 2 (detailed EFs for all the gaseous pollutants are shown in Table B1 and detailed EFs for PM and its chemical compositions are shown in Table B2).
25
CO2emissions from vessels primarily depend on the carbon content of the fuel (Carl-ton et al., 1995). Accordingly, the EFs for CO2in the present study should theoretically be 3177, 3168, and 3171 g kg−1fuel for complete combustion. Under actual conditions,
ACPD
15, 23507–23541, 2015Emissions factors of pollutants from offshore vessels in
China
F. Zhang et al.
Title Page
Abstract Introduction
Conclusions References
Tables Figures
◭ ◮
◭ ◮
Back Close
Full Screen / Esc
Printer-friendly Version
Interactive Discussion
Discussion
P
a
per
|
Discussion
P
a
per
|
Discussion
P
a
per
|
Discussion
P
a
per
|
CO2emissions were 2940–3106, 3121–3160, and 3102–3162 g kg−1fuel for HH, DFH
and XYH, respectively, which means they had high combustion efficiencies with 92.5– 97.8, 98.5–99.7 % and 97.8–99.7 % for these three vessels.
CO emissions of HH were much higher than of XYH, followed by DFH. The power of their respective engines was 350, 600, and 1600 kW. In addition, there were large
dif-5
ferences in CO emissions among different modes. All these three vessels had relatively high EFs for CO while accelerating compared with other modes, but the highest EFs were during the idling modes of HH and DFH, and the low-speed mode of XYH. Be-cause CO emissions in diesel engines primarily depend on the excess air ratio (which determines the fuel-air mixture), combustion temperature, and uniformity of the fuel-air
10
mixture in the combustion chamber (D, 2004), ship engines with lower power generally have higher CO emissions (Carlton et al., 1995). Localized hypoxia and incomplete combustion in cylinder were the main reasons for CO emission of diesel engine. CO emissions always had positive relationships with the air-fuel ratio. There was lower air fuel ratio when in low engine load, which resulted in lower CO emission, and vice versa
15
(Ni, 1999).
Much higher NOx EFs were observed for HH than for the other two vessels. These
results were inconsistent with those of Sinha et al. (Sinha et al., 2003), in which emis-sions of NOxincreased with the power of the ship engine. With increasing vessel speed, NOx EFs for HH first increased and then decreased. XYH had lower EFs when
oper-20
ating at high speed than at low speed. Nitrogen oxides included NO, NO2, and N2O in the present study. More than 70 % of the NOx was in the form of NO for all vessels, because most of the NOx emissions were generated through thermal NO formation
(Haglind, 2008). The primary reasons that slow diesel engines such as the one in HH have higher NOx emissions include higher peak flame temperatures and the NO
for-25
ACPD
15, 23507–23541, 2015Emissions factors of pollutants from offshore vessels in
China
F. Zhang et al.
Title Page
Abstract Introduction
Conclusions References
Tables Figures
◭ ◮
◭ ◮
Back Close
Full Screen / Esc
Printer-friendly Version
Interactive Discussion
Discussion
P
a
per
|
Discussion
P
a
per
|
Discussion
P
a
per
|
Discussion
P
a
per
|
more adiabatic, resulting in higher combustion temperatures and more NOx. Besides, with the increasing of air-fuel ratios, concentration of NOx showed a tendency first to increase, then to decrease, which always had the maximum value in the operating mode that close to full load of engine because of the high temperature and oxygen in the engine cylinder (Ni, 1999). Furthermore, there were always higher EFs values in
5
acceleration process and lower in moderating process in this study. When the engines were in transient operating conditions, such as acceleration process or moderating pro-cess, concentrations of NOxalways had corresponding changes in the cylinder. Studies about diesel engines showed that when the rotational speed had a sudden increase, there would be a first increasing, then decreasing and last stable tendency for the NOx
10
concentrations, and vice versa (Tan et al., 2012).
TVOCs emissions from HH were much higher than from the other two vessels; the lowest emissions were observed for DFH. Previous studies (Sinha et al., 2003) have reported that hydrocarbon emissions from vessels depend on engine power, with low-power engines emitting more hydrocarbons. The present results were partially
consis-15
tent with these previous studies. As for various operating modes, TVOCs EFs had large differences. For example, HH had the highest TVOCs emissions in accelerating mode, which was almost three times the high of the lowest value in medium-speed mode. The EFs for SO2depended solely on the sulfur content of the fuels and were 1.6, 0.9, and 2.6 g kg−1 fuel for HH, DFH, and XYH, respectively in this study. Hydrocarbon could
20
be generated because of the incomplete combustion. For example, in diesel cylinders, there always exist air in wall regions and crevices, as well as when scavenging oc-curred during the aeration, which could cause the uneven mixing of air and fuel (Ni, 1999).
Fuel-based EFs for PM and its chemical components were shown in Table B2. OC
25
and EC were the main components of PM, followed by SO24−, NH+4, and NO−3. Metals such as V, Ni, Cr, Fe, As, and Cd made up a proportionately small part of the total PM mass. However, other rare elements such as Tb, Er, Yb, and Lu had higher values than did some of the common elements. PM was an in-process product during the
ACPD
15, 23507–23541, 2015Emissions factors of pollutants from offshore vessels in
China
F. Zhang et al.
Title Page
Abstract Introduction
Conclusions References
Tables Figures
◭ ◮
◭ ◮
Back Close
Full Screen / Esc
Printer-friendly Version
Interactive Discussion
Discussion
P
a
per
|
Discussion
P
a
per
|
Discussion
P
a
per
|
Discussion
P
a
per
|
tion in cylinder, whose forming process included the molecular cracking, decomposition and polymerization results of lack of oxygen. High temperature and oxygen deficiency were the main reasons for the formation in diesel engines, which always had high con-centration values in high load operating modes (Ni, 1999).
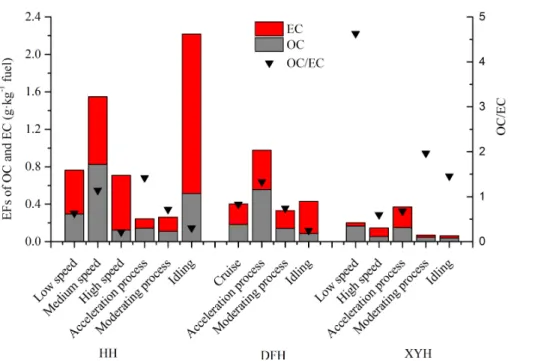
EFs for OC and EC and the ratios between them are shown in Fig. 3. EFs for OC and
5
EC for HH were higher than for the other two vessels. Organic matter (OM) is generally calculated as OC×1.2 (Petzold et al., 2008) to account for the mass of elements other
than carbon in the emitted molecules. OM EFs for individual vessels mainly depend on the engine type and the amount of unburned fuel, i.e., the efficiency of combustion. (Moldanova et al., 2013) BC emissions also depend heavily on the engine type (Lack
10
et al., 2009). Therefore, the different types of engines and their levels of maintenance could account for the large differences in OC and EC EFs observed among the three vessels in this study. The ratios of OC to EC in the present study were much lower than those for large diesel ships reported previously (OC/EC=12) (Moldanova et al., 2009) and also lower than that reported for a medium-speed vessel (Petzold et al., 2010).
15
However, they were higher than that of automobile diesel soot, in which EC comprises 75–80 wt % of the total PM (Clague et al., 1999).
Studies have shown that SO2−
4 formed from vessel-emitted SO2is a major contributor
to CCN and ship track formation (Schreier et al., 2006; Lauer et al., 2007). Sulfate is also an important component of PM emitted from vessels. In the present study, EFs for
20
SO2−
4 were much lower than previously reported (Petzold et al., 2008; Agrawal et al.,
2008), but similar to those detected by a high-resolution time-of-flight aerosol mass spectrometer in a previous study (Lack et al., 2009). This may be because EFs for SO2−
4 are mainly related to the sulfur content of the fuel; SO 2−
4 is not generally emitted
directly from the engines, but forms after release from the stack (Lack et al., 2009).
25
Because PM was collected directly from engine emissions in the present study, the sulfur-to-sulfate ratios were low (<0.6 % for vessels). Other ions such as NO−
3 and NH + 4
ACPD
15, 23507–23541, 2015Emissions factors of pollutants from offshore vessels in
China
F. Zhang et al.
Title Page
Abstract Introduction
Conclusions References
Tables Figures
◭ ◮
◭ ◮
Back Close
Full Screen / Esc
Printer-friendly Version
Interactive Discussion
Discussion
P
a
per
|
Discussion
P
a
per
|
Discussion
P
a
per
|
Discussion
P
a
per
|
to SO3in catalytic reaction cycles with metals commonly present in the exhaust gas (V, Ni), while hydroxyl radicals are additional needed to convert NOx to NO−3 (Moldanova et al., 2009).
Na+and Cl− were considered to originate from marine air. Their concentrations were highly correlated (r2=0.78); the differing air demands of the engines under different
5
conditions might have caused observed variations in the EFs relative to the fuel de-mand.
The elemental compositions of PM in the present study differed from previous studies showing high elemental contents of S, Ca, V, Fe, Cu, Ni, and Al (Agrawal et al., 2008; Moldanova et al., 2009). V and Ni are typically associated with combustion of heavy
10
fuel oil (Almeida et al., 2005). In the present study, the high-quality fuels resulted in low EFs for V and Ni. In our previous study, PM from shipping emissions was estimated to account for 2.94 % of the total PM2.5 at Tuoji Island in China, using V as a tracer of shipping emissions (Zhang et al., 2014). Reconsidering the former results based on the EFs obtained in the present study, we determined that the contribution of vessels near
15
Tuoji Island had been underestimated, because the estimate should have included both heavy and other types of fuels. However, some rare elements such as Tb, Er, Yb, and Lu had relatively high EFs compared with those of other elements in the present study, which may be related to the source of the fuels.
3.3 Fuel-based average emissions factors 20
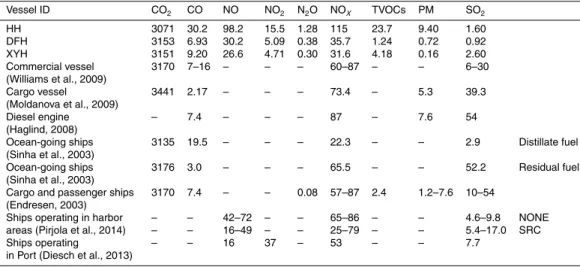
Based on actual operating conditions, average EFs for the three vessels in the present study along with EFs from previous studies are shown in Table 3. EFs for all of the pollutants except SO2 were significantly higher for HH than for the other two vessels, potentially due to poor combustion conditions. Most of the EFs for DFH and XYH were within the range of emissions for other vessels due to having well maintained engines
25
and the high quality of the fuels used. The EFs for NOx, PM, and SO2were much lower than reported for vessels in previous studies (other than NOxfor ocean-going vessels). All the sulfur of the fuels in the present study were significantly below the emissions
ACPD
15, 23507–23541, 2015Emissions factors of pollutants from offshore vessels in
China
F. Zhang et al.
Title Page
Abstract Introduction
Conclusions References
Tables Figures
◭ ◮
◭ ◮
Back Close
Full Screen / Esc
Printer-friendly Version
Interactive Discussion
Discussion
P
a
per
|
Discussion
P
a
per
|
Discussion
P
a
per
|
Discussion
P
a
per
|
limit of 3.50 % established by IMO in the revised MARPOL Annex VI rules, applicable since 2012 (IMO, 1998).
The IMO Tier I emissions limit for NOxis 45.0×n −0.2
g kW h−1(130< n <2000 rpm). Thus, the emissions limits for HH, DFH, and XYH would be 54.5, 57.5, and 56.5 g kg−1 fuel, respectively, based on the engine parameters. The average fuel-based EFs for
5
NOx of ship HH was >100 % above the IMO standard, while those of the other two ships were below the IMO standard (Table 3). PM emissions for HH were also higher than previously reported, but those for the two research vessels were much lower (Ta-ble 3). Low sulfur content in fuels reduces PM formation, which also could be one reason for the low PM EFs (Lack et al., 2011). In addition, different engines and
lev-10
els of maintenance have a significant impact on all combustion-dependent emissions. Emission reduction measures have been used in some vessels. For example, NOx emissions can be reduced by measures such as selective catalytic reduction (SCR) and direct water injection (DWI), which had been implemented on some vessels previ-ously studied in a harbor in Finland (Pirjola et al., 2014). The results showed that SCR
15
effectively reduced NOxemissions, while vessels with DWI had high PM emissions.
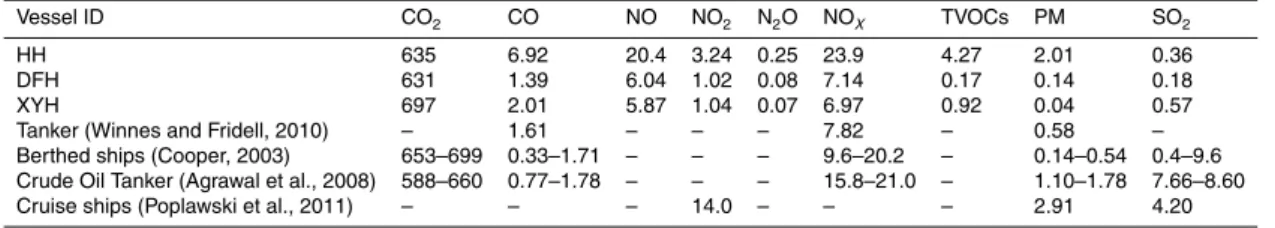
3.4 Power-based emissions factors
Based on the engine power and fuel consumption rates of the vessels, power-based EFs were calculated and compared to results from previous studies (Table 4). The EFs for HH were much higher than those for the other two vessels, except for SO2.
20
HH also had significantly higher EFs for CO and NOxthan previously reported values. On the other hand, most of the EFs for DFH and XYH were within the range of pre-viously reported results. All of the EFs for SO2 in the present study were lower than those in previous studies, because of the low sulfur content of the present fuels. Gen-erally, PM emissions from marine diesel fuels are dependent on the fuel (sulfate and
25
com-ACPD
15, 23507–23541, 2015Emissions factors of pollutants from offshore vessels in
China
F. Zhang et al.
Title Page
Abstract Introduction
Conclusions References
Tables Figures
◭ ◮
◭ ◮
Back Close
Full Screen / Esc
Printer-friendly Version
Interactive Discussion
Discussion
P
a
per
|
Discussion
P
a
per
|
Discussion
P
a
per
|
Discussion
P
a
per
|
bustion conditions were likely the determining factor. The PM emissions observed in the present study were within the range previously reported, except for XYH, which had a much lower value.
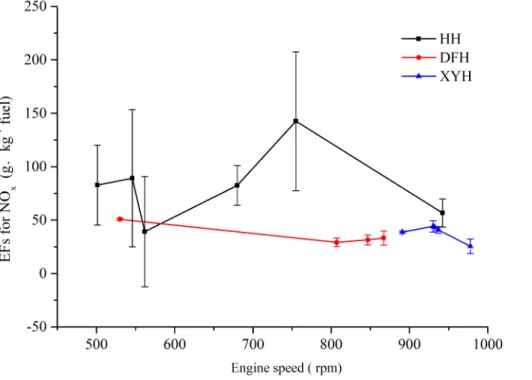
3.5 Impact of engine speed on NOx emissions factors
NOx is formed in the combustion chamber by a combination of atmospheric nitrogen
5
and oxygen under high-pressure and high-temperature conditions. Many factors affect NOxformation, including engine temperature, injection point, and fuel quality. The IMO emissions limit for NOxis determined by the rated speed of the engine; however, other factors must also be considered to reduce NOxemissions.
The NOx EFs for the test vessels at various engine speeds are shown in Fig. 4.
10
The rated speeds of the vessels were 1200, 900, and 1000 rpm for HH, DFH, and XYH, respectively. The actual engine speeds of HH were much lower than the rated speed, while the two larger engine power vessels operated close to their rated speeds, except during one operating mode of DFH. The NOx EFs for HH differed significantly in different operating modes, ranging from 39.1 to 143 g kg−1 fuel. The NOx EF was
15
highest when the engine speed reached ∼750 rpm (Fig. 4). At lower engine speeds,
the NOx EFs had fluctuating but lower values. At higher engine speeds closer to the
rated speed of 1200 rpm, the NOxEFs were much lower. The NOxEFs for the two larger engine power vessels changed slightly with engine speed, but also had lowest values when their engine speeds approached their rated speeds. Combined with the diesel
20
propulsion characteristic curve, there were large increases in the fuel consumption rate when the engine speed increased. Therefore, a best-fit engine speed should be determined based on both EFs and economic costs.
Engineering approaches for reducing the NOx emissions of marine engines may be applied before, during, or after the combustion process (Verschaeren et al., 2014;
25
Habib et al., 2014). In the present study, the NOxEFs of the two research vessels were
below the IMO Tier I emissions limits. However, for EMS, measures should be taken to meet the IMO emissions limit, including increasing the engine speed and applying
ACPD
15, 23507–23541, 2015Emissions factors of pollutants from offshore vessels in
China
F. Zhang et al.
Title Page
Abstract Introduction
Conclusions References
Tables Figures
◭ ◮
◭ ◮
Back Close
Full Screen / Esc
Printer-friendly Version
Interactive Discussion
Discussion
P
a
per
|
Discussion
P
a
per
|
Discussion
P
a
per
|
Discussion
P
a
per
|
engineering technologies during or after combustion, such as exhaust gas recirculation (EGR), selective non-catalytic reduction (SNCR), or SCR.
4 Conclusions
Three offshore vessels with different engine power were chosen in this study to collect measured data of gaseous species and particulate matter, including NO2, NO, N2O,
5
CO, CO2, TVOCs, SO2 and the total suspended particulate. Besides, chemical com-positions of the PM were also analyzed to give detailed EFs for OC, EC, water soluble ions and metal elements. Concentrations, fuel-based EFs, fuel-based average EFs as well as power-based average EFs for species of offshore vessels in China were given. Furthermore, impact of engine speed on NOx EFs was also discussed.
10
There were higher concentrations of pollutants for low engine power vessel HH than for the other two vessels. CO concentrations for offshore vessels were slightly lower than inland vessels in China, and all the three vessels had the lowest CO concentra-tions at their economic speeds (the speed of the least vessel operating expenditures during one voyage, they were high speed mode, cruise mode and high speed mode
15
for HH, DFH and XYH, respectively). More than 80 % of the NOx was NO, and all the offshore vessels had higher NOx concentrations in high speed modes. Because of the low-sulfur fuels used in this study, SO2 concentrations of these three offshore vessels were lower than that in the literatures. And the PM concentrations were much lower than inland vessels while showing significant differences among different
operat-20
ing modes.
Fuel-based EFs for gaseous species and PM were given based on the carbon bal-ance method. EFs for CO2 were 2940–3106, 3121–3160, and 3102–3162 g kg−1 fuel for HH, DFH and XYH with high combustion efficiencies. Because of the combustion conditions such as excess air ratio, combustion temperature and uniformity of the
fuel-25
ACPD
15, 23507–23541, 2015Emissions factors of pollutants from offshore vessels in
China
F. Zhang et al.
Title Page
Abstract Introduction
Conclusions References
Tables Figures
◭ ◮
◭ ◮
Back Close
Full Screen / Esc
Printer-friendly Version
Interactive Discussion
Discussion
P
a
per
|
Discussion
P
a
per
|
Discussion
P
a
per
|
Discussion
P
a
per
|
but showed higher values when in acceleration process. EFs for SO2 were 1.6, 0.9 and 2.6 g kg−1 fuel for HH, DFH and XYH based on sulfur content of the fuels. OC and EC were the main components of PM, with low OC to EC ratios lower than 0.1, followed by SO24−, NH+4, and NO−3. Metals such as V, Ni, Cr, Fe, As, and Cd made up a proportionately small part of the total PM mass.
5
Fuel-based average EFs as well as power-based EFs for the three different engine power vessels were given. EFs for most gaseous species and PM of HH were much higher compared with the other higher engine power vessels, which was also>100 % above the IMO standard for NOx. Average PM EF of the low engine power vessel, HH was also much higher than that in the literatures. However, average EFs for most
10
species of the two larger engine power vessels were within the range of previously reported results.
The impact of engine speed on EFs for NOxshowed that when the engine speed was
close to the rated speed, there would be lower NOx EFs values. However, combined with the high fuel consumption rate, an optimal engine speed should be determined
15
based on both EFs and economic costs. Emission reduction measures for NOx for
some of the offshore vessels in China are still essential to meet the IMO emission limit. Given the limits of vessel types and numbers, this study substantially gives the EFs for gaseous species and PM of three different diesel engine power offshore vessels. However, as the development of ports in China, emissions from cargo ships and
con-20
tainer ships with large engine power have becoming one of the most important air pollution sources in port cities and regions. Systematical EFs of all kinds of offshore vessels in China are essential in order to give the accurate emission inventory of ships.
Supplement
Supplement includes the details of the concentrations of main gaseous matters and
25
PM in shipping emissions (Fig. S1), the fuel-based EFs for the gaseous pollutants (Table S1), PM and the chemical compositions in PM (Table S2) for different operating modes.
ACPD
15, 23507–23541, 2015Emissions factors of pollutants from offshore vessels in
China
F. Zhang et al.
Title Page
Abstract Introduction
Conclusions References
Tables Figures
◭ ◮
◭ ◮
Back Close
Full Screen / Esc
Printer-friendly Version
Interactive Discussion
Discussion
P
a
per
|
Discussion
P
a
per
|
Discussion
P
a
per
|
Discussion
P
a
per
|
The Supplement related to this article is available online at doi:10.5194/acpd-15-23507-2015-supplement.
Acknowledgements. This study was supported by the CAS Strategic Priority Research Pro-gram (No. XDB05030303) and the Natural Scientific Foundation of China (Nos. 41273135 and 41473091). The authors would like to express their gratitude to the vessel owners, Haohai
5
Ocean Engineering Limited Liability Company for vessel Haohai 0007, Ocean University of China for vesselDongfanghong 02, and North China Sea Branch of the State Oceanic Ad-ministration for vesselXiangyanghong 08, for making their vessels available for the shipping emissions study. The views expressed in this document are solely those of the authors, and the funding agencies do not endorse any products or commercial services mentioned in this
10
publication.
References
Agrawal, H., Welch, W. A., Miller, J. W., and Cocker, D. R.: Emission measurements from a crude oil tanker at sea, Environ. Sci. Technol., 42, 7098–7103, doi:10.1021/es703102y, 2008.
15
Almeida, S. M., Pio, C. A., Freitas, M. C., Reis, M. A., and Trancoso, M. A.: Source apportion-ment of fine and coarse particulate matter in a sub-urban area at the Western European Coast, Atmos. Environ., 39, 3127–3138, doi:10.1016/j.atmosenv.2005.01.048, 2005. Berg, N., Mellqvist, J., Jalkanen, J.-P., and Balzani, J.: Ship emissions of SO2 and
NO2: DOAS measurements from airborne platforms, Atmos. Meas. Tech., 5, 1085–1098,
20
doi:10.5194/amt-5-1085-2012, 2012.
Cappa, C. D., Williams, E. J., Lack, D. A., Buffaloe, G. M., Coffman, D., Hayden, K. L., Hern-don, S. C., Lerner, B. M., Li, S.-M., Massoli, P., McLaren, R., Nuaaman, I., Onasch, T. B., and Quinn, P. K.: A case study into the measurement of ship emissions from plume intercepts of the NOAA shipMiller Freeman, Atmos. Chem. Phys., 14, 1337–1352,
doi:10.5194/acp-14-25
1337-2014, 2014.
ACPD
15, 23507–23541, 2015Emissions factors of pollutants from offshore vessels in
China
F. Zhang et al.
Title Page
Abstract Introduction
Conclusions References
Tables Figures
◭ ◮
◭ ◮
Back Close
Full Screen / Esc
Printer-friendly Version
Interactive Discussion
Discussion
P
a
per
|
Discussion
P
a
per
|
Discussion
P
a
per
|
Discussion
P
a
per
|
Chen, G., Huey, L. G., Trainer, M., Nicks, D., Corbett, J., Ryerson, T., Parrish, D., Neuman, J. A., Nowak, J., Tanner, D., Holloway, J., Brock, C., Crawford, J., Olson, J. R., Sullivan, A., We-ber, R., Schauffler, S., Donnelly, S., Atlas, E., Roberts, J., Flocke, F., Hubler, G., and Fehsen-feld, F.: An investigation of the chemistry of ship emission plumes during ITCT 2002, J. Geophys. Res.-Atmos., 110, D10S90, doi:10.1029/2004jd005236, 2005.
5
Clague, A. D. H., Donnet, J., Wang, T. K., and Peng, J. C. M.: A comparison of diesel engine soot with carbon black, Carbon, 37, 1553–1565, doi:10.1016/s0008-6223(99)00035-4, 1999. Cooper, D. A.: Exhaust emissions from ships at berth, Atmos. Environ., 37, 3817–3830,
doi:10.1016/s1352-2310(03)00446-1, 2003.
Corbett, J. J., Fischbeck, P. S., and Pandis, S. N.: Global nitrogen and sulfur inventories for
10
oceangoing ships, J. Geophys. Res.-Atmos., 104, 3457–3470, 1999.
Corbett, J. J. and Fischbeck, P. S.: Emissions from waterborne commerce vessels in United States continental and inland waterways, Environ. Sci. Technol., 34, 3254–3260, 2000. Corbett, J. J., Winebrake, J. J., Green, E. H., Kasibhatla, P., Eyring, V., and Lauer, A.:
Mor-tality from ship emissions: a global assessment, Environ. Sci. Technol., 41, 8512–8518,
15
doi:10.1021/es071686z, 2007.
Corbett, J. J., Lack, D. A., Winebrake, J. J., Harder, S., Silberman, J. A., and Gold, M.: Arctic shipping emissions inventories and future scenarios, Atmos. Chem. Phys., 10, 9689–9704, doi:10.5194/acp-10-9689-2010, 2010.
De Meyer, P., Maes, F., and Volckaert, A.: Emissions from international shipping in the
Bel-20
gian part of the North Sea and the Belgian seaports, Atmos. Environ., 42, 196–206, doi:10.1016/j.atmosenv.2007.06.059, 2008.
Derwent, R. G., Stevenson, D. S., Doherty, R. M., Collins, W. J., Sanderson, M. G., John-son, C. E., Cofala, J., Mechler, R., Amann, M., and Dentener, F. J.: The contribution from shipping emissions to air quality and acid deposition in Europe, Ambio, 34, 54–59,
25
doi:10.1639/0044-7447(2005)034[0054:tcfset]2.0.co;2, 2005.
Diesch, J.-M., Drewnick, F., Klimach, T., and Borrmann, S.: Investigation of gaseous and par-ticulate emissions from various marine vessel types measured on the banks of the Elbe in Northern Germany, Atmos. Chem. Phys., 13, 3603–3618, doi:10.5194/acp-13-3603-2013, 2013.
30
Endresen, Ø., Sørgård, E., Sundet, J. K., Dalsøren, S. B., Isaksen, I. S., Berglen, T. F., and Gravir, G.: Emission from international sea transportation and environmental impact, J. Geo-phys. Res.-Atmos., 108, 4560, doi:10.1029/2002jd002898, 2003.
ACPD
15, 23507–23541, 2015Emissions factors of pollutants from offshore vessels in
China
F. Zhang et al.
Title Page
Abstract Introduction
Conclusions References
Tables Figures
◭ ◮
◭ ◮
Back Close
Full Screen / Esc
Printer-friendly Version
Interactive Discussion
Discussion
P
a
per
|
Discussion
P
a
per
|
Discussion
P
a
per
|
Discussion
P
a
per
|
European Union: DIRECTIVE 2012/33/EU, available at: http://eur-lex.europa.eu/LexUriServ/ LexUriServ.do?uri=OJ:L:2012:327:0001:0013:EN:PDF (last access: 28 August 2015), 2012.
Eyring, V., Köhler, H. W., van Aardenne, J., and Lauer, A.: Emission from international shipping: 1. the last 50 years, Geophys. Res., 110, D17305, doi:10.1029/2004jd005619, 2005.
5
Fridell, E., Steen, E., and Peterson, K.: Primary particles in ship emissions, Atmos. Environ., 42, 1160–1168, 2008.
Fu, M., Ding, Y., Ge, Y., Yu, L., Yin, H., Ye, W., and Liang, B.: Real-world emis-sions of inland ships on the Grand Canal, China, Atmos. Environ., 81, 222–229, doi:10.1016/j.atmosenv.2013.08.046, 2013.
10
Habib, H. A., Basner, R., Brandenburg, R., Armbruster, U., and Martin, A.: Selective Catalytic Reduction of NOx of Ship Diesel Engine Exhaust Gas with C3H6 over Cu/Y Zeolite, ACS Catalysis, 4, 2479–2491, 2014.
Haglind, F.: A review on the use of gas and steam turbine combined cycles as prime movers for large ships. Part III: Fuels and emissions, Energ. Convers. Manage., 49, 3476–3482,
15
doi:10.1016/j.enconman.2008.08.003, 2008.
Juwono, A. M., Johnson, G., Mazaheri, M., Morawska, L., Roux, F., and Kitchen, B.: Investi-gation of the airborne submicrometer particles emitted by dredging vessels using a plume capture method, Atmos. Environ., 73, 112–123, 2013.
Lack, D. A. and Corbett, J. J.: Black carbon from ships: a review of the effects of ship speed, fuel
20
quality and exhaust gas scrubbing, Atmos. Chem. Phys., 12, 3985–4000, doi:10.5194/acp-12-3985-2012, 2012.
Lack, D. A., Corbett, J. J., Onasch, T., Lerner, B., Massoli, P., Quinn, P. K., Bates, T. S., Covert, D. S., Coffman, D., Sierau, B., Herndon, S., Allan, J., Baynard, T., Lovejoy, E., Ravishankara, A. R., and Williams, E.: Particulate emissions from commercial
ship-25
ping: chemical, physical, and optical properties, J. Geophys. Res.-Atmos., 114, D00f04 doi:10.1029/2008jd011300, 2009.
Lack, D. A., Cappa, C. D., Langridge, J., Bahreini, R., Buffaloe, G., Brock, C., Cerully, K., Coff -man, D., Hayden, K., Holloway, J., Lerner, B., Massoli, P., Li, S.-M., McLaren, R., Middle-brook, A. M., Moore, R., Nenes, A., Nuaaman, I., Onasch, T. B., Peischl, J., Perring, A.,
30
ACPD
15, 23507–23541, 2015Emissions factors of pollutants from offshore vessels in
China
F. Zhang et al.
Title Page
Abstract Introduction
Conclusions References
Tables Figures
◭ ◮
◭ ◮
Back Close
Full Screen / Esc
Printer-friendly Version
Interactive Discussion
Discussion
P
a
per
|
Discussion
P
a
per
|
Discussion
P
a
per
|
Discussion
P
a
per
|
emissions: implications for climate and air quality, Environ. Sci. Technol., 45, 9052–9060, doi:10.1021/es2013424, 2011.
Lauer, A., Eyring, V., Hendricks, J., Jöckel, P., and Lohmann, U.: Global model simulations of the impact of ocean-going ships on aerosols, clouds, and the radiation budget, Atmos. Chem. Phys., 7, 5061–5079, doi:10.5194/acp-7-5061-2007, 2007.
5
Li, X., Xu, Z., Guan, C., and Huang, Z.: Effect of injection timing on particle size distribution from a diesel engine, Fuel, 134, 189–195, 2014.
Marmer, E. and Langmann, B.: Impact of ship emissions on the Mediterranean summer-time pollution and climate: a regional model study, Atmos. Environ., 39, 4659–4669, doi:10.1016/j.atmosenv.2005.04.014, 2005.
10
MARPOL 73/78: Annex VI: Regulations for the Prevention of Air Pollution from Ships and NOx Technical Code: Regulation 13 – Nitrogen Oxides, International Maritime Organization, Lon-don, 1998.
Ministry of Transportation: Report on China Shipping Development of 2010: Part XVI: Port Service, China Communications Press, Beijing, 2010.
15
Ministry of Transportation: China Statistical Yearbook of 2013: Part XVI: Transport, Post and Telecommunication Services, China Communications Press, Beijing, 2013.
Moldanova, J., Fridell, E., Popovicheva, O., Demirdjian, B., Tishkova, V., Faccinetto, A., and Focsa, C.: Characterisation of particulate matter and gaseous emissions from a large ship diesel engine, Atmos. Environ., 43, 2632–2641, doi:10.1016/j.atmosenv.2009.02.008, 2009.
20
Moldanová, J., Fridell, E., Winnes, H., Holmin-Fridell, S., Boman, J., Jedynska, A., Tishkova, V., Demirdjian, B., Joulie, S., Bladt, H., Ivleva, N. P., and Niessner, R.: Physical and chemical characterisation of PM emissions from two ships operating in European Emission Control Areas, Atmos. Meas. Tech., 6, 3577–3596, doi:10.5194/amt-6-3577-2013, 2013.
Murphy, S. M., Agrawal, H., Sorooshian, A., Padró, L. T., Gates, H., Hersey, S., Welch, W.,
25
Jung, H., Miller, J., and Cocker III, D. R.: Comprehensive simultaneous shipboard and air-borne characterization of exhaust from a modern container ship at sea, Environ. Sci. Tech-nol., 43, 4626–4640, 2009.
Ni, J.: Principles of Automotive Internal Combustion Engine, Tongji University Press, Shanghai, 1999 (in Chinese).
30
Petzold, A., Hasselbach, J., Lauer, P., Baumann, R., Franke, K., Gurk, C., Schlager, H., and Weingartner, E.: Experimental studies on particle emissions from cruising ship, their
ACPD
15, 23507–23541, 2015Emissions factors of pollutants from offshore vessels in
China
F. Zhang et al.
Title Page
Abstract Introduction
Conclusions References
Tables Figures
◭ ◮
◭ ◮
Back Close
Full Screen / Esc
Printer-friendly Version
Interactive Discussion
Discussion
P
a
per
|
Discussion
P
a
per
|
Discussion
P
a
per
|
Discussion
P
a
per
|
acteristic properties, transformation and atmospheric lifetime in the marine boundary layer, Atmos. Chem. Phys., 8, 2387–2403, doi:10.5194/acp-8-2387-2008, 2008.
Petzold, A., Weingartner, E., Hasselbach, I., Lauer, P., Kurok, C., and Fleischer, F.: Physical properties, chemical composition, and cloud forming potential of particulate emissions from a marine diesel engine at various load conditions, Environ. Sci. Technol., 44, 3800–3805,
5
doi:10.1021/es903681z, 2010.
Pirjola, L., Pajunoja, A., Walden, J., Jalkanen, J.-P., Rönkkö, T., Kousa, A., and Koskentalo, T.: Mobile measurements of ship emissions in two harbour areas in Finland, Atmos. Meas. Tech., 7, 149–161, doi:10.5194/amt-7-149-2014, 2014.
Poplawski, K., Setton, E., McEwen, B., Hrebenyk, D., Graham, M., and Keller, P.:
Im-10
pact of cruise ship emissions in Victoria, BC, Canada, Atmos. Environ., 45, 824–833, doi:10.1016/j.atmosenv.2010.11.029, 2011.
Righi, M., Klinger, C., Eyring, V., Hendricks, J., Lauer, A., and Petzold, A.: Climate impact of biofuels in shipping: global model studies of the aerosol indirect effect, Environ. Sci. Technol., 45, 3519–3525, doi:10.1021/es1036157, 2011.
15
Saxe, H. and Larsen, T.: Air pollution from ships in three Danish ports, Atmos. Environ., 38, 4057–4067, 2004.
Schreier, M., Kokhanovsky, A. A., Eyring, V., Bugliaro, L., Mannstein, H., Mayer, B., Bovens-mann, H., and Burrows, J. P.: Impact of ship emissions on the microphysical, optical and radiative properties of marine stratus: a case study, Atmos. Chem. Phys., 6, 4925–4942,
20
doi:10.5194/acp-6-4925-2006, 2006.
Shahsavani, A., Naddafi, K., Haghighifard, N. J., Mesdaghinia, A., Yunesian, M., Nabizadeh, R., Arhami, M., Yarahmadi, M., Sowlat, M. H., Ghani, M., Jafari, A. J., Alimohamadi, M., Mote-valian, S. A., and Soleimani, Z.: Characterization of ionic composition of TSP and PM10 during the Middle Eastern Dust (MED) storms in Ahvaz, Iran, Environ. Monit. Assess., 184,
25
6683–6692, doi:10.1007/s10661-011-2451-6, 2012.
Sinha, P., Hobbs, P. V., Yokelson, R. J., Christian, T. J., Kirchstetter, T. W., and Bruintjes, R.: Emissions of trace gases and particles from two ships in the southern Atlantic Ocean, Atmos. Environ., 37, 2139–2148, doi:10.1016/s1352-2310(03)00080-3, 2003.
Sippula, O., Stengel, B., Sklorz, M., Streibel, T., Rabe, R., Orasche, J., Lintelmann, J.,
30
ACPD
15, 23507–23541, 2015Emissions factors of pollutants from offshore vessels in
China
F. Zhang et al.
Title Page
Abstract Introduction
Conclusions References
Tables Figures
◭ ◮
◭ ◮
Back Close
Full Screen / Esc
Printer-friendly Version
Interactive Discussion
Discussion
P
a
per
|
Discussion
P
a
per
|
Discussion
P
a
per
|
Discussion
P
a
per
|
aromatic emission profiles under various operating conditions, Environ. Sci. Technol., 48, 11721–11729, doi:10.1021/es502484z, 2014.
Tan, P., Feng, Q., Hu, Z., and Lou, D.: Emissions from a vehicle diesel engine during transient operating conditions, J. Eng. Thermophys., 33, 1819–1822, 2012 (in Chinese).
Tzannatos, E.: Ship emissions and their externalities for Greece, Atmos. Environ., 44, 2194–
5
2202, doi:10.1016/j.atmosenv.2010.03.018, 2010.
Verschaeren, R., Schaepdryver, W., Serruys, T., Bastiaen, M., Vervaeke, L., and Verhelst, S.: Experimental study of NOx reduction on a medium speed heavy duty diesel engine by
the application of EGR (exhaust gas recirculation) and Miller timing, Energy, 76, 614–621, doi:10.1016/j.energy.2014.08.059, 2014.
10
Viana, M., Amato, F., Alastuey, A., Querol, X., Moreno, T., Garcia Dos Santos, S., Dolores Herce, M., and Fernandez-Patier, R.: Chemical tracers of particulate emissions from com-mercial shipping, Environ. Sci. Technol., 43, 7472–7477, doi:10.1021/es901558t, 2009. Viana, M., Hammingh, P., Colette, A., Querol, X., Degraeuwe, B., de Vlieger, I., and van
Aar-denne, J.: Impact of maritime transport emissions on coastal air quality in Europe, Atmos.
15
Environ., 90, 96–105, doi:10.1016/j.atmosenv.2014.03.046, 2014.
Wang, X., Bi, X., Sheng, G., and Fu, H.: Hospital indoor PM10/PM2.5 and asso-ciated trace elements in Guangzhou, China, Sci. Total Environ., 366, 124–135, doi:10.1016/j.scitotenv.2005.09.004, 2006.
Williams, E. J., Lerner, B. M., Murphy, P. C., Herndon, S. C., and Zahniser, M. S.: Emissions of
20
NOx, SO2, CO, and HCHO from commercial marine shipping during Texas Air Quality Study (TexAQS) 2006, J. Geophys. Res., 114, D21306, doi:10.1029/2009jd012094, 2009.
Winebrake, J. J., Corbett, J. J., Green, E. H., Lauer, A., and Eyring, V.: Mitigating the health impacts of pollution from oceangoing shipping: an assessment of low-sulfur fuel mandates, Environ. Sci. Technol., 43, 4776–4782, doi:10.1021/es803224q, 2009.
25
Winnes, H. and Fridell, E.: Emissions of NOX and particles from manoeuvring ships, Transport. Res. D-Tr. E., 15, 204–211, doi:10.1016/j.trd.2010.02.003, 2010.
Woodyard, D.: Pounder’s Marine Diesel Engines and Gas Turbines, 8th edn., Elsevier Ltd, Oxford, UK, 2004.
Zhang, F., Chen, Y., Tian, C., Wang, X., Huang, G., Fang, Y., and Zong, Z.: Identification and
30
quantification of shipping emissions in Bohai Rim, China, Sci. Total Environ., 497–498, 570– 577, doi:10.1016/j.scitotenv.2014.08.016, 2014.