Ultra-processed foods and
the nutritional dietary profile
in Brazil
Alimentos ultraprocessados e perfil
nutricional da dieta no Brasil
I Programa de Pós-Graduação em Nutrição
em Saúde Pública. Faculdade de Saúde Pública. Universidade de São Paulo. São Paulo, SP, Brasil
II Núcleo de Pesquisas Epidemiológicas em
Nutrição e Saúde. Universidade de São Paulo. São Paulo, SP, Brasil
III Departamento de Nutrição Aplicada. Instituto
de Nutrição. Universidade do Estado do Rio de Janeiro. Rio de Janeiro, RJ, Brasil
IV Departamento de Medicina Preventiva.
Faculdade de Medicina. Universidade de São Paulo. São Paulo, SP, Brasil
V Departamento de Nutrição. Universidade
Federal de Minas Gerais. Belo Horizonte, MG, Brasil
VI Departamento de Nutrição. Faculdade de
Saúde Pública. Universidade de São Paulo. São Paulo, SP, Brasil
Correspondence: Carlos Augusto Monteiro
Departamento de Nutrição – FSP/USP Av. Dr. Arnaldo, 715 2º andar 01246-903 São Paulo, SP, Brasil E-mail: [email protected] Received: 1/20/2015 Approved: 4/24/2015
Article available from: www.scielo.br/rsp
ABSTRACT
OBJECTIVE: To assess the impact of consuming ultra-processed foods on
the nutritional dietary proile in Brazil.
METHODS: Cross-sectional study conducted with data from the module on individual food consumption from the 2008-2009 Pesquisa de Orçamentos
Familiares (POF – Brazilian Family Budgets Survey). The sample, which
represented the section of the Brazilian population aged 10 years or over, involved 32,898 individuals. Food consumption was evaluated by two 24-hour food records. The consumed food items were classiied into three groups: natural or minimally processed, including culinary preparations with these foods used as a base; processed; and ultra-processed.
RESULTS: The average daily energy consumption per capita was 1,866 kcal, with 69.5% being provided by natural or minimally processed foods, 9.0% by processed foods and 21.5% by ultra-processed food. The nutritional proile
of the fraction of ultra-processed food consumption showed higher energy
density, higher overall fat content, higher saturated and trans fat, higher levels of free sugar and less iber, protein, sodium and potassium, when compared to
the fraction of consumption related to naturalor minimally processed foods.
Ultra-processed foods presented generally unfavorable characteristics when compared to processed foods. Greater inclusion of ultra-processed foods in the diet resulted in a general deterioration in the dietary nutritional proile. The indicators of the nutritional dietary proile of Brazilians who consumed less ultra-processed foods, with the exception of sodium, are the stratum of the population closer to international recommendations for a healthy diet.
CONCLUSIONS: The results from this study highlight the damage to health
that is arising based on the observed trend in Brazil of replacing traditional
meals, based on naturalor minimally processed foods, with ultra-processed
foods. These results also support the recommendation of avoiding the consumption of these kinds of foods.
DESCRIPTORS: Food Consumption. Industrialized Foods. Nutritive Value. Food Quality. Nutritional Epidemiology.
Maria Laura da Costa LouzadaI,II
Ana Paula Bortoletto MartinsII
Daniela Silva CanellaII,III
Larissa Galastri BaraldiI,II
Renata Bertazzi LevyII,IV
Rafael Moreira ClaroII,V
Jean-Claude MoubaracII
Geoffrey CannonII
Ultra-processed foods are ready-to-consume products
that are made up entirely or mostly from substances extracted from food (oils, fats, sugar, proteins), derived from food constituents (hydrogenated fats, modiied starches), or synthesized, based on organic materials (dyes, lavorings, lavor enhancers and other additives
used to alter the food’s sensory properties).11,12,15,16,18
Analysis of household budget surveys from three
countries2,9,19 and time series food sales statistics in 79 countries14 indicate a general trend of increasing
ultra-processed food consumption, being more acute in middle-income countries such as Brazil.
Studies that investigate household food purchases using data from household budget surveys, performed in Brazil, Canada and Chile, show that ultra-processed
RESUMO
OBJETIVO: Avaliar o impacto do consumo de alimentos ultraprocessados
sobre o peril nutricional da dieta.
MÉTODOS: Estudo transversal com dados obtidos do módulo sobre consumo alimentar de indivíduos da Pesquisa de Orçamentos Familiares 2008-2009. A amostra, representativa da população brasileira de 10 ou mais anos de idade, envolveu 32.898 indivíduos. O consumo alimentar foi avaliado por meio de dois registros alimentares de 24h. Os alimentos consumidos foram classiicados
em três grupos: in natura ou minimamente processados, incluindo preparações culinárias à base desses alimentos; processados; e ultraprocessados.
RESULTADOS: O consumo médio diário de energia per capita foi de 1.866 kcal,
sendo 69,5% proveniente de alimentos: in natura ou minimamente processados,
9,0% de alimentos processados e 21,5% de alimentos ultraprocessados. O peril nutricional da fração do consumo relativo a alimentos ultraprocessados mostrou maior densidade energética, maior teor de gorduras em geral, de gordura
saturada, de gordura trans e de açúcar livre e menor teor de ibras, de proteínas,
de sódio e de potássio, quando comparado à fração do consumo relativa a
alimentos in natura ou minimamente processados. Alimentos ultraprocessados apresentaram, no geral, características desfavoráveis quando comparados aos alimentos processados. Maior participação de alimentos ultraprocessados na dieta determinou generalizada deterioração no peril nutricional da alimentação. Os indicadores do peril nutricional da dieta dos brasileiros que menos consumiram alimentos ultraprocessados, com exceção do sódio, aproximam este estrato da população das recomendações internacionais para uma alimentação saudável.
CONCLUSÕES: Os resultados indicam prejuízos à saúde decorrentes da tendência observada no Brasil de substituir refeições tradicionais baseadas em
alimentos in natura ou minimamente processados por alimentos ultraprocessados
e apoiam a recomendação para ser evitado o consumo desses alimentos.
DESCRITORES: Consumo de Alimentos. Alimentos Industrializados. Valor Nutritivo. Qualidade dos Alimentos. Epidemiologia Nutricional.
INTRODUCTION
foods averagely have higher energy density, higher free sugar content and less iber than natural or minimally processed food, even when these foods are combined with culinary ingredients such as salt, sugar and
fats.3,13,17 We found no records of any studies that have
linked ultra-processed foods to the nutritional dietary quality of what is actually consumed by individuals. This study’s objective was to evaluate the impact of
ultra-processed food consumption on the nutritional
dietary proile in Brazil.
METHODS
The data analyzed during this study was taken from the
Pesquisa de Orçamentos Familiares (POF – Brazilian
Institute of Geography and Statistics (IBGE) between
May 2008 and May 2009.5,6
The sample of households from the POF was extracted using a sampling plan by conglomerates with a census sector rafle in the irst stage, and households, in the second. The census tracts were grouped prior to the
rafle in strata with suficient geographical and socio
-economic homogeneity. The census tract rafle within each stratum was performed with a probability that was proportional to the number of households in each sector. During the second stage, within each tract, the households were selected by simple random sampling, without replacement. The sample was made up of
55,970 households.5
The search module relating to individual food
consumption was applied in a random subsample of
13,569 households (24.3% of the total studied house
-holds). All residents from these households, aged 10 years or older, were selected. This sub-sample involved 34,003 individuals.
Food consumption was evaluated using two 24-hour
food records, on non-consecutive days, in which the individuals recorded, using home measurements, the
quantities and preparation methods of each consumed
food. Eventually, the records were completed with the help from other household resident or complemented by interviews, in which the research agent would review the information illed in by the informant. The research agent then transcribed the information so it could be entered onto an electronic data system.
Data such as the respondent’s date of birth, gender and
household income per capita were obtained by stan
-dardized questionnaires. The data also included the
urban or rural situation of the household and its loca
-tion in term of one of Brazil’s ive macroregions (North, Northeast, Midwest, Southeast and South).
Food quantities were listed about grams or milli
-liters, based on the home measurement table used
for food consumed in Brazil,7 which was built from
compiling home measurement tables and other infor
-mation sources. Amounts deemed unlikely or whenever missing were imputed based on a similarity matrix. This matrix was formed based on variables that had been
correlated with the quantity consumed variable (infor
-mant’s gender, age, state, macro-region and informed
measurement unit) using the hot deck technique.7
These food quantities were converted into kilocalo
-ries and into grams or milligrams of nutrients based on a table representing information regarding food
consumption in Brazil.8 This table was constructed
based on data from the Brazilian Food Composition Table and a similar table from the United States
Department of Agriculture, in addition to regional
recipes and food label references.8
In accordance with the guidelines provided by the
IBGE,8 added sugar content in fruit juices, coffee and
tea was standardized in an amount equivalent to 10.0% of the consumed volume, whenever the individual reported to habitually add sugar to drinks; and 5.0% of the volume of added sugar and artiicial sweeteners. A drink was considered to be without added sugar when
the individual reported that they did not usually add
sugar to their drinks.
The 1,120 reported consumption items were classi
-ied into three groups: natural or minimally processed
foods, processed foods, and ultra-processed foods.11,15,18
The irst group included foods that had been directly obtained from plants or animals (such as leaves, fruits, eggs and milk), those acquired for consumption without
having undergone any alteration following their harvest
(natural foods) and naturalfoods that, prior to having
been acquired, were cleaned, had their inedible or unwanted parts removed, and had been subjected to drying, packing, pasteurization, freezing, reinement,
fermentation and other processes that do not include
substances being added to the original food (minimally processed foods). Culinary preparations based on one
or more naturalor minimally processed food items
were included in this irst group. These preparations
were included when the food and all the other
ingredi-ents, including any other edible foods used in the inal project such as salt, sugar, vinegar and oils, were used in the recipe.11,15,18
The second group is essentially made up of indus-trial products produced in which salt or sugar (and
eventually oil or vinegar) had been added to a natural or minimally processed food, including canned vegetables, fruits in syrup, cheeses and breads made with lour, water, and salt (and yeast used to ferment the lour).11,15,18
The third group is composed of industrial products that
are entirely or mostly made from substances extracted from food (oils, fats, sugar, proteins), those that are derived from food constituents (hydrogenated fats, modiied starch) or foods synthesized in laboratory based on organic materials (colorants, lavorings, lavor
enhancers and other additives used to give the
prod-ucts attractive sensory properties).11,15,18 Ultra-processed
All analyses were conducted with individuals who
had illed out records referring to two days of food consumption, which were conducted for 96.8% of the total number of individuals who participated in the search module regarding individual food consumption.
The study population’s consumption pattern was
described by distributing the total calories consumed by individuals, according to the three food groups used in this study, and internally within these groups, according to selected subgroups.
Individuals were classiied into ive strata according to the caloric value that ultra-processed foods contributed to the total value of their diet. These strata were related to the distribution quintiles of caloric contribution from ultra-processed food across the Brazilian population.
The consumption pattern in each of these strata was
described in a similar manner to what was used for the whole population.
The impact ultra-processed food consumption on diet
quality took into account indicators for which the
World Health Organization established recommenda
-tions for consumption, which are valid for the whole
population, independent of gender, age and physio
-logical state: protein, carbohydrates, free sugar, iber, total fats, saturated fat, trans fat, iber, sodium and
potassium.30,34 Indicators relating to iber, sodium and
potassium intake were expressed per 1,000 kcal, while other nutrients were expressed as a percentage of total calories ingested. Additionally, energy density from the solid fraction of the diet was included, which was calculated by dividing the sum of calories from solid food intake by the amount in grams of these foods.
The recommendations used for this indicator were as
proposed by the World Cancer Research Fund.29
Nutritional indicators were used to assess the quality of
the average Brazilian diet. The averages from the nutri
-tional indicators of the fraction of the diet, exclusively made up by ultra-processed foods, were compared to
the fraction of the diet that only consisted of
consum-able items from the naturalor minimally processed
food group, and with the fraction of the diet that was
restricted to processed foods. The Student’s t-test was
used for these comparisons.
The indicators were used to evaluate the dietary quality
of the Brazilian population strata corresponding to the distribution quintiles of caloric contribution from
ultra-processed foods to total calories. Linear regres
-sion analyses were used to identify the direction and
the statistical signiicance of the association between the distribution quintiles of caloric contribution from ultra-processed foods and nutritional indicators, with
and without itting for confounding variables (house
-hold income, urban or rural residence, macro-region, age and gender).
All analyses were performed using Stata 13.0 software, considering the complex sample design.
This study was approved by the Research Ethics Committee from the Faculdade de Saúde Pública at the Universidade de São Paulo (Protocol 128,958, 10/19/2012).
RESULTS
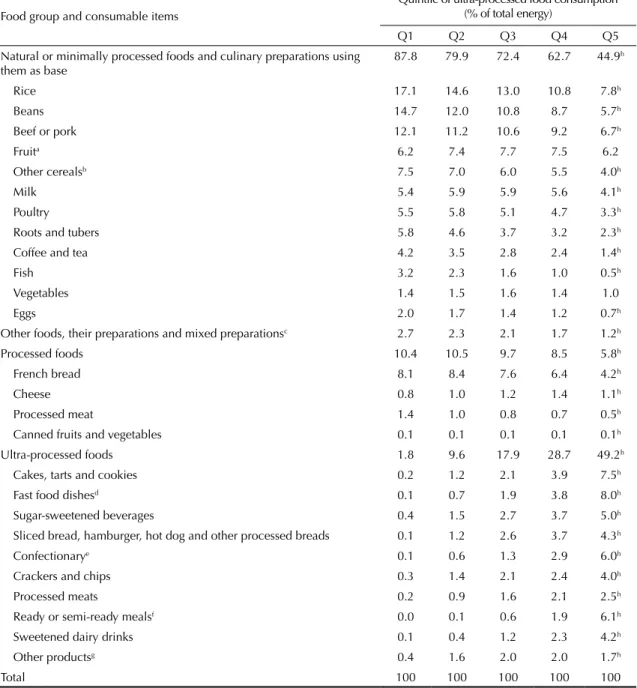
The average daily energy consumption for Brazilians aged ten years or over was 1,866 kcal, with 69.5% being by the consumption of natural or minimally processed food, 9.0% from processed foods and 21.5% from ultra-processed foods (Table 1).
When considered together, rice and beans are respon
-sible for more than one quintile (22.9%) of the energy
consumed throughout the day. Other natural or mini
-mally processed foods, which are relevant to Brazilian food consumption, are red meats, fruits, other cereals (not rice) and milk, with each of them contributing at least 5.0% of total daily energy. Poultry, roots and tubers, coffee and tea, ish, vegetables and eggs contribute less to energy.
Among the processed foods, the largest contribution to total energy intake came from French bread (6.9% of daily calories), followed by cheese, processed meats and canned fruits and vegetables.
Among the ultra-processed foods are cakes, pies and cookies (3.0% of daily calories), fast food dishes (2.9%), sugar-sweetened beverages (2.6%), sliced loafs, hamburger and hot dog breads (2.4%) and confectionary (2.2%). Second in energy contribution, are crackers, chips, sausages, ready or semi-ready meals and sweetened dairy drinks. The mean contribution from ultra-processed foods
towards total consumed energy ranged from less
than 2.0% in the irst quintile to about 50.0% in the last quintile. The contribution from all categories of
ultra-processed foods significantly increases from
the irst quintile to the last. An inverse tendency was
observed for all naturalor minimally processed foods,
except for fruits and vegetables, which did not varied
signiicantly. Signiicant, albeit not uniform, varia
-tions were observed in processed foods: cheese and canned fruits and vegetables represented increased
consumption of ultra-processed foods, while the oppo
-site was observed for French bread and processed meat. Thus, there is evidence to afirm that a mixed nature involved in the processed foods group exists, part to
do with the varying pattern found in naturalor
mini-mally processed foods, and part to do with the varying pattern of ultra-processed foods (Table 2).
respectively, for naturalor minimally processed foods, processed foods and ultra-processed foods.
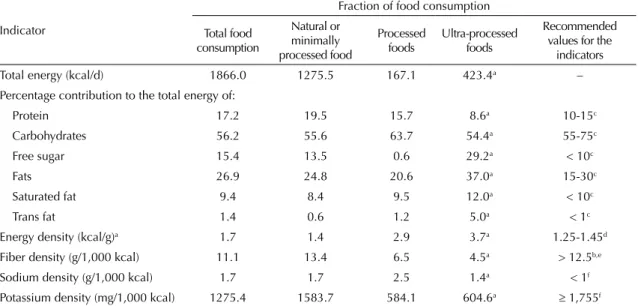
The diet of the Brazilian population exceeds consump
-tion recommenda-tions for energy density, protein, free sugar, trans fat and sodium and is insuficient regarding iber and potassium.
Compared to the fraction of the diet concerning natural or minimally processed food, the fraction
referring to ultra-processed foods has 2.5 times more energy per gram, 2 times more free sugar, 1.5 times
more overall and saturated fats and 8 times more
trans fats, in addition to being lower in iber (3 times less), proteins (2 times less) and potassium Table 1. Absolute and relative consumption averages of natural or minimally processed foods, processed foods and ultra-processed foods in the Brazilian population aged 10 years or over (2008-2009).
Food group and consumable items Kcal/day % of total energy intake
Natural or minimally processed foods (including culinary preparations
using them as base) 1275.5 69.5
Rice 226.0 12.6
Beans 189.6 10.3
Beef or pork 188.7 10.0
Fruitsa 132.7 7.0
Other cerealsb 110.6 6.0
Milk 96.1 5.4
Poultry 88.1 4.9
Roots and tubers 78.0 3.9
Coffee and tea 47.7 2.9
Fish 33.2 1.7
Vegetables 21.7 1.4
Eggs 24.4 1.4
Other natural or minimally processed foodsc 38.6 2.0
Processed foods 167.1 9.0
French bread 126.3 6.9
Cheeses 21.4 1.1
Processed meat 17.7 0.9
Canned fruits and vegetables 1.8 0.1
Ultra-processed foods 423.4 21.5
Cakes, pies and cookies 62.4 3.0
Fast food dishesd 55.9 2.9
Sugar-sweetened beverages 51.5 2.6
Sliced bread, hamburger, hot dog and similar baps 42.2 2.4
Confectionarye 47.8 2.2
Crackers and chips 39.9 2.0
Sausages 27.7 1.5
Ready or semi-ready mealsf 55.9 1.7
Sweetened dairy drinks 31.7 1.6
Other ultra-processed foodsg 29.2 1.5
Total 1866.0 100
a Including juices squeezed from fruit.
b Corn, oats and wheat and their flours and preparations such as couscous and pasta dishes
c Nuts and seeds, plain yogurt, preparations with a lentil base, peas, soy, seafood and preparations made with mixtures of various foods.
d Burgers of all kinds, hotdogs, fried and baked snacks or similar. e Candies, chocolates, gelatin, flan and ice cream.
(2.5 times less) content. In comparison to processed foods, ultra-processed foods also have greater energy density, a higher content of free sugar, overall fats, saturated and trans fats and a lower protein and iber content. Processed and ultra-processed foods have similar potassium contents. Processed foods have particularly high sodium contents: 2.5 g per 1,000 kcal compared with 1.4 g in ultra-processed foods and 1.7 g in minimally processed foods and their culinary preparations.
Table 4 presents indicators of the nutritional dietary
profile for the five strata of the population
corre-sponding to increasing quintiles in energy contribution from ultra-processed foods.
The energy density of the diet and the relative content
of free sugar, general fats, saturated fats and trans fats
increase signiicantly with the increase in the contribu
-tion of ultra-processed foods, while the opposite occurs for protein, iber, potassium and sodium. Controlling Table 2. Distribution (%) of total energy intake according to food groups and consumption items in strata of the Brazilian population aged 10 years or over referring to quintiles of ultra-processed food consumption (2008-2009).
Food group and consumable items
Quintile of ultra-processed food consumption (% of total energy)
Q1 Q2 Q3 Q4 Q5
Natural or minimally processed foods and culinary preparations using them as base
87.8 79.9 72.4 62.7 44.9h
Rice 17.1 14.6 13.0 10.8 7.8h
Beans 14.7 12.0 10.8 8.7 5.7h
Beef or pork 12.1 11.2 10.6 9.2 6.7h
Fruita 6.2 7.4 7.7 7.5 6.2
Other cerealsb 7.5 7.0 6.0 5.5 4.0h
Milk 5.4 5.9 5.9 5.6 4.1h
Poultry 5.5 5.8 5.1 4.7 3.3h
Roots and tubers 5.8 4.6 3.7 3.2 2.3h
Coffee and tea 4.2 3.5 2.8 2.4 1.4h
Fish 3.2 2.3 1.6 1.0 0.5h
Vegetables 1.4 1.5 1.6 1.4 1.0
Eggs 2.0 1.7 1.4 1.2 0.7h
Other foods, their preparations and mixed preparationsc 2.7 2.3 2.1 1.7 1.2h
Processed foods 10.4 10.5 9.7 8.5 5.8h
French bread 8.1 8.4 7.6 6.4 4.2h
Cheese 0.8 1.0 1.2 1.4 1.1h
Processed meat 1.4 1.0 0.8 0.7 0.5h
Canned fruits and vegetables 0.1 0.1 0.1 0.1 0.1h
Ultra-processed foods 1.8 9.6 17.9 28.7 49.2h
Cakes, tarts and cookies 0.2 1.2 2.1 3.9 7.5h
Fast food dishesd 0.1 0.7 1.9 3.8 8.0h
Sugar-sweetened beverages 0.4 1.5 2.7 3.7 5.0h
Sliced bread, hamburger, hot dog and other processed breads 0.1 1.2 2.6 3.7 4.3h
Confectionarye 0.1 0.6 1.3 2.9 6.0h
Crackers and chips 0.3 1.4 2.1 2.4 4.0h
Processed meats 0.2 0.9 1.6 2.1 2.5h
Ready or semi-ready mealsf 0.0 0.1 0.6 1.9 6.1h
Sweetened dairy drinks 0.1 0.4 1.2 2.3 4.2h
Other productsg 0.4 1.6 2.0 2.0 1.7h
Total 100 100 100 100 100
a,b,c,d,e,f,g,h See Table 1.
the household income, urban or rural residence, region, age and gender variables do not make any difference to these results.
In contrast with the Brazilian population’s average diet,
the diet of the quintile of individuals with lower rela-tive consumption of ultra-processed food was in line
with recommendations for iber and trans fat consump
-tion and close to recommenda-tions for that of energy
density, free sugar, and potassium (Table 3). The
diet of the quintile of individuals with lower relative
consumption of ultra-processed food is also suitable for consumption levels of total and saturated fats, which
are nutrients that are excessively consumed by the quin
-tile with higher relative consumption of ultra-processed
foods. Sodium consumption in the diet exceeded the recommended amount (< 1 g/1,000 kcal) in all strata of the population.
DISCUSSION
The results from this study conirm the negative nutri
-tional proile of ultra-processed food and document
their largely negative impact on food quality in the
Brazilian population, particularly considering the increase of the diet’s energy density, levels of sugar,
saturated and trans fat and the decreasing levels of iber and potassium.
High energy density diets make it dificult for the human body to regulate energy balance, which increases
the risk of excessive weight gain.24 Excessive free
sugar in the diet also increases the risk of excessive
weight gain and obesity,28 in addition to increasing
the incidence of tooth decay.20 Excessive saturated
and trans fat content increase morbidity and mortality
from cardiovascular diseases.21,32 On the other hand,
insuficient iber intake increases the risk of obesity, diabetes, cardiovascular diseases and several types of
cancer, such as colon, rectal, and breast,10,22,30 while
insuficient potassium intake increases the risk of high
blood pressure.33
As the ultra-processed food category has only recently
been deined, few population studies that have evalu
-ated the association between their consumption and
morbidity and mortality exist.11,12,15,16,18 However,
studies that have been performed in Brazil indicate the existence of significant associations between ultra-processed food consumption and metabolic
syndrome in adolescents,27 dyslipidemias in children23
and obesity in all age groups.1
Table 3. Averages of nutritional indicators, from food consumption in the Brazilian population aged 10 years or over, and the fraction of this consumption referring to the groups containing in natura or minimally processed foods, processed foods and ultra-processed foods (2008-2009).
Indicator
Fraction of food consumption
Total food consumption
Natural or minimally processed food
Processed foods
Ultra-processed foods
Recommended values for the
indicators
Total energy (kcal/d) 1866.0 1275.5 167.1 423.4a –
Percentage contribution to the total energy of:
Protein 17.2 19.5 15.7 8.6a 10-15c
Carbohydrates 56.2 55.6 63.7 54.4a 55-75c
Free sugar 15.4 13.5 0.6 29.2a < 10c
Fats 26.9 24.8 20.6 37.0a 15-30c
Saturated fat 9.4 8.4 9.5 12.0a < 10c
Trans fat 1.4 0.6 1.2 5.0a < 1c
Energy density (kcal/g)a 1.7 1.4 2.9 3.7a 1.25-1.45d
Fiber density (g/1,000 kcal) 11.1 13.4 6.5 4.5a > 12.5b,e
Sodium density (g/1,000 kcal) 1.7 1.7 2.5 1.4a < 1f
Potassium density (mg/1,000 kcal) 1275.4 1583.7 584.1 604.6a ≥ 1,755f
a Value significantly different (p < 0.05) from the estimated value for in natura or minimally processed food and processed foods.
b Energy density only calculated for the solid fraction of the diet, referring to the sum of the calories from solid foods divided by the amount of these foods in grams.
c World Health Organization (WHO). Diet, nutrition and the prevention of chronic diseases. Geneva: World Health Organization; 2003.
d World Cancer Research Foundation (WCRF). Energy density: finding the balance for cancer prevention. London: World Cancer Research Foundation; 2009.
e Recommended value based on a 2,000 kcal diet.
Studies based on household food purchases made in Brazil13 and in other countries3,17 found an inferiority in the nutritional quality of all ultra-processed foods when
they are jointly compared with other foods.
The stratiication of the Brazilian population, based on
the inclusion of ultra-processed foods in the diet, indi
-cates that the 20.0% of Brazilians who consume fewer
ultra-processed foods meet or are close to international recommendations regarding all nutritional indicators of
the diet considered in this study, with the exception of sodium. On the other hand, the 20.0% of Brazilians who consume more ultra-processed foods have excessive total, saturated and trans fat content, excessive free sugar and sodium, and insuficient iber and potassium content. This inding indicates that the reducing ultra-processed
food consumption is a natural way to promote healthy
eating in Brazil. The high sodium content found in the
three fractions of the diet, considered in this study, indi
-cate that the solution to the excessive sodium consump
-tion in Brazil requires both a reduc-tion in sodium content added by food manufacturers to processed and ultra-processed foods, and a reduction in salt quantities that are added to culinary preparations.
The average protein content in the Brazilian diet (17.2% of the calories) exceeds the recommended level for this
nutrient (10.0%-15.0%)30 and is due to the high protein
content observed for naturalor minimally processed
food (19.5%), caused by the large amount of beans and meat included in the Brazilian diet. In any case,
the adverse health effects that result from high protein
intake are unclear and apparently only occur, as in the case of kidney function damage, when intake is more
than two times the recommendation’s upper limit.31
On the other hand, recent studies have indicated that increases of between 10.0% and 20.0% in protein
content increase the diet’s satiation factor and prevent
excessive calorie consumption.4,25
Among the highlighted strengths of this study are: the
strictly probabilistic character of the studied sample and the national representativeness, ensured by there being more than 30 thousand people involved, who reside in urban and rural areas from various regions of Brazil; the two 24-hour food records; and the use of a new food classiication system, which groups every
consumed item according to the industrial processing
involved in its production.
This study’s limitations are based on the inherent poten
-tial biases when using food records: underestimating
food consumption, modifying habitual consump
-tion during the days included in the study, differ
-ences between the actual and standardized recipes and differences between the nutritional composition of the consumed foods and the composition indicated by the nutritional composition table used. To minimize these biases, the collection instrument was pre-tested and validated, quality control procedures were performed
during data collection and inconsistent records were
deleted and replaced with imputed values.6 In addition,
the food composition table of foods used was specii
-cally built for this study, including recipes that are more consistent with the culinary habits of Brazilian people.
As the instrument used to record food consumption was not designed to evaluate the food according to the
industrial processing to which they were submitted, some consumption items may have been misclassiied. Classiication errors are more likely with items such Table 4. Averages of nutritional indicators from food consumption by strata of the Brazilian population aged 10 years or over, referring to quintiles of ultra-processed food consumption (2008-2009).
Indicador Quintile of ultra-processed food consumption (% of total energy)
Q1 Q2 Q3 Q4 Q5
Total energy (kcal/d) 1707.9 1794.4 1841.0 1920.4 2066.8b
Energy density (kcal/g)a 1.5 1.5 1.6 1.7 1.9b
Percentage contribution to the total energy of:
Protein 19.3 18.2 17.3 16.3 14.8b
Carbohydrate 56.7 56.5 56.2 56.1 55.6b
Free sugar 10.9 13.1 15.0 17.6 20.2b
Total fat 23.8 25.4 26.8 28.1 30.4b
Saturated fat 7.9 8.5 9.1 10.0 11.5b
Trans fat 0.8 1.3 1.5 1.7 1.9b
Nutrient density:
Fiber (g/1,000 kcal) 13.0 11.9 11.3 10.3 8.9b
Sodium (g/1,000 kcal) 1.9 1.8 1.7 1.7 1.6b
Potassium (mg/1,000 kcal) 1414.2 1347.8 1309.7 1230.6 1074.6b
a See Table 3.
as pizzas, sweets and fruit juices, which can be both
culinary preparations from the irst group and indus
-trialized products from the third group. Whenever any absence of information was observed in the records
that allowed a distinction to be made between culi
-nary preparations and industrialized products, such as details regarding the recipe or the product’s brand, the most common alternative was chosen based on cases where there was information. Finally, the study did not include people aged less than 10 years, meaning that its results only apply rigorously to the Brazilian adolescent and adult population.
The importance of verifying the negative effects from consuming ultra-processed food to the nutritional
quality of the Brazilian diet has been growing in signiicance since the 1990s, this being the period in
which sales of ultra-processed foods began expanding strongly in Brazil and, more generally, in all middle
income countries.14,26 In addition, surveys regarding
food purchasing for home consumption, performed in metropolitan areas in Brazil between 1987-1988 and 2008-2009, indicated systematic increases in
ultra-processed food involvement and a concomitant reduction in the inclusion of naturalfoods or mini-mally processed foods and culinary ingredients such
as oils and sugar.9
The results of this study support the main
recommen-dation from the new edition of the Guia Alimentar para a População Brasileira (Dietary Guidelines for
the Brazilian population):11 “Always prefer natural or
minimally processed foods and freshly made dishes
and meals to ultra-processed foods”.
1. Canella DS, Levy RB, Martins AP, Claro RM, Moubarac J-C, Baraldi LG, et al. Ultra-processed food products and obesity in Brazilian households (2008-2009). PLoS One. 2014;9(3):e92752.
DOI:10.1371/journal.pone.0092752. eCollection 2014
2. Crovetto MM, Uauy R. [Changes in processed food expenditure in the population of Metropolitan Santiago in the last twenty years].
Rev Med Chil. 2012;140(3):305-12. Spanish. DOI:10.4067/S0034-98872012000300004
3. Crovetto MM, Uauy R, Martins AP, Moubarac J-C, Monteiro C. [Household availability of ready-to-consume food and drink products in Chile: impact on nutritional quality of the diet].
Rev Med Chil. 2014;142(7):850-8. Spanish. DOI:10.4067/S0034-98872014000700005
4. Gosby AK, Conigrave AD, Raubenheimer D, Simpson SJ. Protein leverage and energy intake. Obes Rev. 2014;15(3):183-91. DOI: 10.1111/obr.12131
5. Instituto Brasileiro de Geografia e Estatística. Pesquisa de orçamentos familiares 2008-2009: avaliação nutricional da disponibilidade de alimentos no Brasil. Rio de Janeiro; 2010.
6. Instituto Brasileiro de Geografia e Estatística. Pesquisa de orçamentos familiares 2008-2009: análise do consumo alimentar pessoal no Brasil. Rio de Janeiro; 2011.
7. Instituto Brasileiro de Geografia e Estatística. Pesquisa de orçamentos familiares 2008-2009: tabela de medidas referidas para os alimentos consumidos no Brasil. Rio de Janeiro; 2011.
8. Instituto Brasileiro de Geografia e Estatística. Pesquisa de orçamentos familiares 2008-2009: tabelas de composição nutricional dos alimentos consumidos no Brasil. Rio de Janeiro; 2011.
9. Martins APB, Levy RB, Claro RM, Moubarac J-C, Monteiro CA. Increased contribution of ultra-processed food products in the Brazilian diet
(1987-2009). Rev Saude Publica. 2013;47(4):656-65. DOI:10.1590/S0034-8910.2013047004968
10. McKeown NM, Meigs JB, Liu S, Saltzman E, Wilson PW, Jacques PF. Carbohydrate nutrition, insulin resistance, and the prevalence of the metabolic syndrome in the Framingham Offspring Cohort. Diabetes Care. 2004;27(2):538-46. DOI:10.2337/diacare.27.2.538
11. Ministério da Saúde. Dietary Guidelines for the Brazilian population. 2a. ed. Brasília (DF); 2014.
12. Monteiro CA. Nutrition and health. The issue is not food, nor nutrients, so much as processing.
Public Health Nutr. 2009;12(5):729-31. DOI:10.1017/S1368980009005291
13. Monteiro CA, Levy RB, Claro RM, Castro IR, Cannon G. Increasing consumption of ultra-processed foods and likely impact on human health: evidence from Brazil. Public Health Nutr. 2011;14(1):5-13. DOI:10.1017/S1368980010003241
14. Monteiro CA, Moubarac J-C, Cannon G, Ng SW, Popkin B. Ultra-processed products are becoming dominant in the global food system. Obes Rev. 2013;14(Suppl 2):21-28. DOI:10.1111/obr.12107
15. Monteiro CA, Cannon G, Levy RB, Claro RM, Moubarac J-C. Ultra-processing and a new
classification of foods. In: Neff R, editor. Introduction to U.S. Food System: public health, environment, and equity. San Francisco: Jossey Bass; 2015. p. 338-9.
16. Moodie R, Stuckler D, Monteiro C, Sheron N, Neal B, Thamarangsi T, et al. Profits and pandemics: prevention of harmful effects of tobacco, alcohol, and ultra-processed food and drink industries. Lancet. 2013;381(9867):670-9. DOI:10.1016/S0140-6736(12)62089-3
17. Moubarac J-C, Martins AP, Claro RM, Levy RB, Cannon G, Monteiro CA. Consumption of ultra-processed foods and likely impact on human health. Evidence from Canada. Public Health Nutr. 2013;16(12):2240-8. DOI:10.1017/S1368980012005009
18. Moubarac J-C, Parra DC, Cannon G, Monteiro CA. Food classification systems based on food processing: significance and implications for policies and actions: a systematic literature review and assessment. Curr Obes Rep. 2014;3(2):256-72. DOI:10.1007/s13679-014-0092-0
19. Moubarac J-C, Batal M, Martins AP, Claro R, Levy RB, Cannon G, et al.Processed and ultra-processed food products: consumption trends in Canada from 1938 to 2011. Can J Diet Pract Res. 2014;75(1):15-21. DOI:10.3148/75.1.2014.15
20. Moynihan PJ, Kelly SA. Effect on caries of restricting sugars intake: systematic review to inform
WHO guidelines. J Dent Res. 2014;93(1):8-18. DOI:10.1177/0022034513508954
21. Mozaffarian D, Aro A, Willett WC. Health effects of trans-fatty acids: experimental and observational evidence. Eur J Clin Nutr. 2009;63(Suppl 2):S5-21. DOI:10.1038/sj.ejcn.1602973
22. Pereira MA, O’Reilly E, Augustsson K, Fraser GE, Goldbourt U, Heitmann BL, et al. Dietary fiber and risk of coronary heart disease: a pooled analysis of cohort studies. Arch Intern Med. 2004;164(4):370-6. DOI:10.1001/archinte.164.4.370
23. Rauber F, Campagnolo PD, Hoffman DJ, Vitolo MR. Consumption of ultra-processed food products and its effects on children’s lipid profiles: a longitudinal study. Nutr Metab Cardiovasc Dis. 2015;25(1):116-22. DOI:10.1016/j.numecd.2014.08.001
24. Rolls BJ.The relationship between dietary energy density and energy intake.
Physiol Behav. 2009;97(5):609-15. DOI:10.1016/j.physbeh.2009.03.011
25. Simpson SJ, Raubenheimer D. Perspective: tricks of the trade. Nature. 2014;508(7496):S66. DOI:10.1038/508S66a
26. Stuckler D, McKee M, Ebrahim S, Basu S. Manufacturing epidemics: the role of global producers in increased consumption of unhealthy commodities including processed foods, alcohol, and tobacco. PLoS Med. 2012;9(6):e1001235. DOI:10.1371/journal.pmed.1001235
27. Tavares LF, Fonseca SC, Rosa MLG, Yokoo EM. Relationship between ultra-processed foods and metabolic syndrome in adolescents from a Brazilian Family Doctor Program. Public Health Nutr. 2012;15(1):82-7. DOI:10.1017/S1368980011001571
28. Te Morenga L, Mallard S, Mann J. Dietary sugars and body weight: systematic review and meta-analyses of randomised controlled trials and cohort studies. BMJ. 2013;346:e7492. DOI:10.1136/bmj.e7492
29. World Cancer Research Foundation. Energy density: finding the balance for cancer prevention. London; 2009.
30. World Health Organization. Diet, nutrition and the prevention of chronic diseases: report of a Joint WHO/FAO Expert Consultation. Geneva; 2003. (WHO Technical Report Series, 916).
31. World Health Organization. Protein and amino acid requirements in human nutrition: report of a joint FAO/WHO/UNU expert consultation. Geneva; 2007. (WHO Technical Report Series, 935).
32. World Health Organization. Fats and fatty acids in human nutrition: report of an expert consultation. Geneva; 2009. (FAO food and nutrition paper, 91).
33. World Health Organization. Effect of increased potassium intake on cardiovascular disease, coronary heart disease and stroke. Geneva; 2012.
34. World Health Organization. WHO issues new guidance on dietary salt and potassium. Geneva; 2013.
Research supported by the Fundação de Amparo à Pesquisa do Estado de São Paulo (FAPESP – Process 2012/18027-0, doctoral scholarship).
Article based on the doctoral thesis by Maria Laura da Costa Louzada, which will be presented at the Postgraduate Program in Nutrition and Public Health, at the Faculdade de Saúde Pública from the Universidade de São Paulo, in 2015.
ANNEX
Classification of foods based on the industrial processing they were submitted to before their acquisition.
Group Definition and characteristics Examples
Natural or minimally processed foods and culinary preparations with these foods as their base
Natural foods are obtained directly from plants or animals (such as leaves and fruit or eggs and milk) and are purchased ready for consumption without having undergone any alteration after leaving the natural source. Minimally processed foods are natural foods that, prior to their acquisition, underwent minor changes that do not involve adding substances to the food. Cleaning, removal of non-edible parts, fractioning, drying, packaging, fermentation, pasteurization, refrigeration, freezing, milling and refinement are examples of the processes that natural foods go through. Culinary preparations based on these foods include natural or minimally processed foods being used as the main item in the recipe with all of the remaining ingredients, including culinary ingredients such as oils, fats, sugar and salt, other natural or minimally processed foods (such as garlic and onion) and even processed or ultra-processed foods (such as cheeses and processed meats) when they are included as secondary items in the culinary preparations. These preparations are prepared in domestic kitchens, traditional restaurants or places similar to these.
Vegetables, greens, fruits, potatoes, cassava and other roots and tubers in natura or packaged, fractionated, chilled or frozen, white, brown or parboiled rice, in bulk or packaged, corn grain or on the cob, wheat grain and other cereals, beans of all colors, lentils, chickpeas and other legumes, fresh or dried mushrooms, dried fruits, fruit juices and pasteurized fruit juice and fruit juice with no added sugar or other substances, nuts, walnuts, peanuts and other oilseeds with no added salt or sugar, cloves, cinnamon, spices in general and fresh or dried herbs, cassava, corn or wheat flour and fresh or dried pasta or pasta made with these flours and water, beef, pork and poultry and fresh, chilled or frozen fish, pasteurized, UHT (long-life milk) or powdered milk, plain yogurt (without added sugar, sweeteners or dyes), eggs, tea, coffee and drinking water.
Processed foods Processed foods are manufactured by the food industry, these foods have salt, sugar or any other commonly used culinary substance added to the natural or minimally processed food to make it last longer and be more pleasing to the palate. These are products that are directly derived from food and are recognized as versions of the original foods. The processing techniques used for these products resemble culinary techniques, possibly including cooking, drying, fermentation, packing in tins or glass and using preservation methods such as salting, pickling, curing and smoking.
Canned vegetables, corn or peas, fruits in syrup, candied fruits, salted meats, canned fish and fish preserved in oil, cheeses made from milk and salt and bread made from wheat flour, water, yeast and salt (but not containing other added substances such as hydrogenated fat and additives).
Ultra-processed foods
Ultra-processed foods are industrial products that are made entirely or mostly of substances that have been extracted from food (oils, fats, sugar, starch, proteins), derived from food constituents (hydrogenated fats, modified starches) or synthesized in a laboratory based on organic materials such as oil and coal (colorants, flavorings, flavor enhancers and other additives used to give the products attractive sensory properties). Manufacturing techniques include extruding, moulding and preprocessing for frying or baking.
Sliced bread, hamburger or hot dog processed bread, sweet breads and baked products whose ingredients include substances such as hydrogenated vegetable fat, sugar, starch, whey, emulsifiers or other additives, sweet and savory biscuits, chip-like snacks, processed sweets and treats in general (candies, ice creams, chocolates), soft drinks, artificial juices, sweetened and flavored dairy drinks, energy drinks, sauces, margarine, processed meats, processed ready to heat dishes, burgers, hot dogs, chicken or fish nugget, cereal bars.