Abstract – The present work sought to analyze the behavior of wheat price growth rates in the world market. For this purpose, monthly information of prices in the markets of Brazil, Argentina and the United States was used. To estimate the growth rate of wheat prices, the methodologies proposed by Perron and Yabu (2009a, 2009b) were adopted, which consist of estimating the deterministic trend in a context where the noise component can be integrated or stationary, and is dedicated to test if there is a structural change in the growth rate of wheat prices. The results showed that in all the analyzed markets, the growth rates of wheat prices were constant.
Keywords: Argentina, Brazil, deterministic trend, structural change, United States.
Análise das taxas de crescimento do preço do trigo na América
Resumo – O presente trabalho busca analisar o comportamento das taxas de crescimento dos preços do trigo no mercado mundial. Para isso, utilizou-se informações mensais de preços nos mercados de trigo do Brasil, Argentina e Estados Unidos. Para estimar a taxa de crescimento dos preços do trigo, foram adotadas as metodologias propostas por Perron e Yabu (2009a, 2009b), que consistem em estimar a tendência determinística em um contexto em que o componente de ruído pode ser inte-grado ou estacionário, e é dedicado a testar se há uma mudança estrutural na taxa de crescimento dos preços do trigo. Os resultados mostraram que, em todos os mercados analisados, as taxas de crescimento dos preços do trigo foram constantes.
Palavras-chave: Argentina, Brasil, tendência determinística, mudança estrutural, Estados Unidos.
1 Original recebido em 29/3/2017 e aprovado em 12/9/2017.
2 Economista, professor do Departamento de Economia Agrícola da UFC e do Mestrado Acadêmico em Economia Rural (Maer/UFC),
bolsista produtividade da Funcap. E-mail: franzetabosa@ufc.br
3 Economista, professor do Caen/UFC. E-mal: gdirffi@gmail.com 4 Economista. professor de Finanças/UFC. E-mail: pcastelar@gmail.com
An analysis of wheat
price growth rates
at América
1
Francisco José Silva Tabosa2
Guilherme Diniz Irffi3
Pablo Urano Castelar4
Introduction
There is consensus among various works, such as Bass (2011), FAO (2010, 2012) and Troester and Staritz (2013), that food price developments and price volatility can have various impacts at
com-particularly after the Brazilian commercial open-ness which occurred in the early 1990s, and the intensification of the Mercosur trading zone7.
In recent years, due to the appreciation of the real against the dollar, and also the drought experienced in Brazil’s southern region, the national production of wheat, besides favoring Argentine wheat, allowed the free entry of subsi-dized wheat directly from the United States and the European Union, or by means of triangula-tion via Uruguay and other countries, even with the Common External Tariff within the Mercosur zone (BRUM; MILLER, 2008).
Currently, the Brazilian wheat cropping sector is facing difficulties in marketing domestic wheat, as a consequence of the ease of importing wheat from abroad. Furthermore, this sector is under the threat of not being self-sufficient, since Brazilian producers do not have sufficient com-parative and competitive advantages in relation to Argentine producers (BRUM; MILLER, 2008). Another relevant point is that Brazil also com-petes with the United States, which is, at present, the greatest exporter of wheat in the world, as the American wheat sector has numerous com-parative advantages, such as subsidies and wheat import barriers in the American market (ROSSI; NEVES, 2004).
Argentine wheat represents 96% of Brazilian wheat imports, because of lower costs, interest rates and easier payment methods, fol-lowed by Paraguay and the United States of America (FARIA, 2009) as the main providers of the commodity for Brazil.
Thus, this present work aims to analyze the behavior of wheat price growth rates in the world market. For that purpose, monthly information on the wheat prices in the markets of Brazil, Argentina and the United States is used. The modity prices may have an important impact on
local markets (BASS, 2011).
Wheat is a cereal used in large scale in the making of various food products, beverages and animal rations and, thus, is considered, ac-cording to Faria (2009), the be the main source of human food, and one of the main agricultural products traded in the international market.
Almeida et al. (2011) highlight that this commodity is basically destined to food, and as it does not possess products which are direct substitutes, this grain has a unique importance in the world market.
Furthermore, the wheat market has an interesting characteristic, given that some coun-tries are simultaneously great exporters and importers, such as the United States of America and France5.
Concerning the season of 2012/2013, ac-cording to data from Safras & Mercados6, the
United States of America produced 61 thousand tons being, thus, responsible for 9% of the world market production. Meanwhile, Argentina and Brazil are responsible for, respectively, 2% and 1% of world production; however, Argentina is responsible for 5% of worldwide wheat exports.
Wheat represents one of the products which are imported the most in Brazilian agri-business. In 2007, around 70% of the wheat consumed in Brazil was imported, mainly, from Argentina, having produced circa 4 million tons, and consuming 10.5 million tons (FARIA, 2009).
In Brazil, according to Colle (1998), the wheat production chain has certain interest groups, represented by the input, machinery and equipment industries, as well as the milling and processing industries, and producers and consumers, which provided competition gains,
5 For Almeida et al. (2011), this occurs because of the diversity of wheat, and also because of the conditions of being exporter and importer
in the season and offseason, respectively.
6 Safras & Mercado is a Brazilian consulting firm in agribusiness. Available at: <http://www.safras.com.br/>.
7 Mercosur is an economic and political agreement among Argentina, Brazil, Paraguay, Uruguay, and Venezuela; with Bolivia becoming
analysis is performed by estimating trend models to capture, mainly, which of the aforementioned markets presented the greatest growth during the 2004 to 2012 period. The period is chosen to analyze if there is a significant difference in the four year periods immediately before and after the 2008 financial and food crises8.
To estimate the price growth rate, the meth-odology presented in Perron and Yabu (2009a, 2009b) is used, which consists of estimating the deterministic trend in a context where the noise component can be integrated or stationary and is also dedicated to testing if there is a structural change in the wheat price growth rate9.
Thus, it can be said that through estimating the wheat price growth rates in the markets for those three countries, macroeconomic policies can be suggested for the wheat sector, since markets are integrated and do not suffer from price arbitrage.
To present the discussion of the issue at hand and the findings, it was opted to divide the work in five sections, including this introduction. In the following section there is a description of the worldwide wheat market, highlighting the importance of the countries which produce, export and import the commodity. Afterwards, a very brief literature review is presented, with some of the most recent works debating the is-sue. Data presentation and discussion is featured in the fourth section. Afterwards, the model is presented, as well as the estimation methods fea-tured in Perron and Yabu (2009a, 2009b), which are used in this work, and in the next section, the results are presented and analyzed. Lastly, the concluding remarks are made.
Worlwide wheat market
According to data from Safras & Mercado
(2012), the European Union is responsible for roughly 20% of the worldwide production of
wheat. The United States is in 5th place, where its
production represents 9% of worldwide produc-tion. The Argentine market produces 2% of world-wide production, being the eleventh producer, and it takes first place in terms of the Mercosur trading zone, while Brazil is responsible for 1% of world-wide wheat production, being in twelfth place in the world ranking, and second place considering the Mercosur, as can be observed in Table 1.
Concerning the countries which export wheat, the greatest worldwide exporters in 2012 were the United States of America, responsible for 24% of wheat exports, followed by Russia, Canada, Australia and the European Union, all being responsible for over 10% of exports, as can be observed in Figure 1. Note that Argentine ex-ports represent 5% of worldwide wheat exex-ports. Brazil, on the other hand, is not featured among the greater wheat exporters. This fact can also be verified in Table 2, as the country is responsible for only 1% of worldwide production.
As for the world’s most significant import-ers in 2012, 17% of worldwide wheat production is imported by North Africa, followed by the Middle East and Southeast Asia, respectively, 15% and 12%. Figure 2 also shows that Brazil is the fifth greatest wheat importer in the world, importing around 5% of the world’s wheat.
Analyzing the wheat production of the
Mercosur trading zone, the main producers are Argentina, followed by Brazil, Uruguay and Paraguay. Furthermore, it can be observed that the crops analyzed in Argentina and Brazil are responsible for at least 86% of production in the
Mercosur region, as Argentina alone represents at least 50% of the region’s wheat production, making it the main producer for that market.
The relationship among these markets is highlighted by Margarido and Turolla (2012), since the markets for wheat flour in Brazil and the grain of wheat in Argentina are fully integrated, and therefore variations in prices of wheat grain
8 See, for example, The Global Food… (2011).
9 For that purpose, a logarithmic transformation is applied in the wheat price series, and the model’s slope reports the average rate of
Table 1. Worldwide Wheat Production Ranking (in a thousand tons of grains), crops of 2007/2008 to 2012/2013(1).
Countrie Country participation (%)
Crops
2007/2008 2008/2009 2009/2010 2010/2011 2011/2012 2012/2013
European Union 20 120 151 139 136 137 133
China 18 109 112 115 115 118 118
Russia 13 92 115 114 81 114 89
India 14 76 79 81 81 87 91
USA 9 56 68 60 60 54 61
Canada 4 20 29 27 23 25 27
Pakistan 3 23 21 24 24 24 23
Australia 4 14 21 22 28 30 26
Noth Africa 3 14 14 20 16 19 17
Middle East 6 41 30 38 40 40 38
Argentina 2 19 11 12 16 15 12
Brazil 1 4 6 5 6 6 5
Others 4 37 38 46 25 26 27
Total 100 612 683 685 651 694 665
(1) Crop prediction for 2012/2013.
Source: elaborated using data from the Safras & Mercado (2012) consulting firm.
Figure 1. Largest wheat exporters.
Source: Safras & Mercado (2012).
in Argentina are transferred fully to prices of wheat flour in Brazil in the long run.10 According
to those authors, the prices in Argentina are more competitive than the prices of wheat in the United States because of the Mercosur.
Note that the production of Argentina and Brazil represent, together, over 80% of the region’s wheat production. This occurs, mainly, because of the Argentine market, which signifi-cantly increased its production after 2011, and represents over 60% of production in the region.
This is also due to a reduction in Brazilian production for two reasons; one related to the exchange rate, and the other related to climate issues. The first is the appreciation of the real against the dollar, while the other considers the drought experienced in southern Brazil and,
10 Margarido e Turolla (2012) does not find evidence of integration among prices in Brazil and the United States, i.e., prices in the United
consequently, there is a boost in imports of Argentine wheat in Brazil11.
Literature
Due to recent food crises, mainly the ones in 2006-2008 and 2010-2011, a number of authors have dedicated themselves to analyzing commodity prices, particularly of wheat, for, as Troester and Staritz (2013) argue, it has become,
along with rice, the most important commodity worldwide, as it is a staple food for most of the world’s population. In developing countries the large majority of wheat is used for food whereas in developed countries an important share is also used for animal feed in particular poorer qual-ity wheat. In that particular work, Troester and Staritz (2013) analyze trends in the global wheat market by developing a supply and demand model, and find that there is a gap in the model predictions and prices in the wheat market. The authors argue that financialization, as well as financial speculation and recent shifts in the trading on commodity derivative markets may also impact global wheat prices.
In another recent work, Gutierrez and Piras (2013) develop a global VAR model, argu-ing that conventional models have not provided a complete picture of the recent price spikes in agricultural commodity markets, and that there is an urgent need for appropriate policy responses, as food commodity prices fluctuations have important impacts on poverty and food insecu-rity across the world. Thus, the authors present results from a worldwide dynamic model that provides short and long-run impulse responses of wheat international price to various real and financial shocks. The results show that stocks, oil
Table 2. Production (in a thousand tons) of the largest Wheat Producers in the Mercosur region.
Countries/production 2012/2013* 2011/2012 2010/2011 2009/2010
Argentina 12.000 14.000 8.750 9.350
Brazil 5.285 5.656 6.002 5.000
Uruguay 1.500 1.800 1.200 1.900
Paraguay 1.250 1.100 1.150 910
Mercosur 20.035 22.556 17.102 17.160
Argentina + Brazil 17.285 19.656 14.750 14.350
Argentina/Mercosur 0,5985 0,6207 0,5116 0,5448
(Arg+Bra)/Mercosur (in %) 86,27 87,14 86,25 83,62
Source: elaborated using data from the Safras & Mercado (2012) consulting firm.
Note: * Preliminary estimate.
11 For more details, see Safras & Mercado (2012). Figure 2. Largest wheat importers. (2012).
price and US dollar depreciation affect world-wide wheat prices.
Baffes and Dennis (2013) study the issue in a more general manner, analyzing not only wheat prices, but other food commodities such as maize, rice, soybeans and palm oil, using annual data from 1960 to 2012 and long-run elasticity estimates. The authors conclude that most of the price increases during that period are accounted for by crude oil prices (more than 50 percent), following the findings of Gutierrez and Piras (2013), followed by stock-to-use ratios and exchange rate movements, which are esti-mated at about 15 percent each. Crude oil prices mattered most during the recent boom period, according to Baffes and Dennis (2013), because they experienced the largest increase.
Thus, as summarized by De Gorter (2008), many factors have contributed to higher commodity prices in recent years, and these be categorized as follows: (1) macroeconomic forces like declining U.S. $ exchange rates and real interest rates, the latter leading to a wave of speculation in commodity markets; (2) higher oil prices increasing input costs and demand for biofuels; (3) changes in fundamentals of the underlying supply/demand situation such as income growth, especially in Asia, and lower supply growth because of neglect in agricultural R&D expenditures; (4) supply shocks due to bad weather and crop disease; (5) failure to reform current agricultural policies while rising prices have led to policy actions in the short run such as export taxes and bans as well as reduced tariffs on commodity imports; and (6) biofuel policies.
Some authors have also analyzed the Brazilian scenario. For instance, Machado and Freitas (2012) study the dynamics of price forma-tion in the Brazilian wheat market by using the Dickey-Fuller stationarity test and the Johansen co-integration test. The authors find that wheat prices in the U.S. have active participation in the long term equilibrium prices in Brazil, while price variation in Argentina was not statistically significant to explain price formation in Brazil.
Bender Filho et al. (2013) study the fac-tors which impact Brazilian wheat imports in the Mercosur trading zone context, through the use of an autoregressive error-correction vector model. The results indicate that the amount of wheat imported in Brazil suffered a negative in-fluence from external prices, and that exchange rate devaluations increase imports.
As for the Argentine case, Coronel et al. (2010) analyze if wheat prices of the Argentine and the International markets are related, and if these markets are integrated in space. The period studied is from January, 1994 to April, 2009, and the authors use unit root tests, Granger causality and the Johansen co-integration test, as well as the estimation of the impulse response function decomposition of error variation and estimation and analysis of the error correction model. The results indicated that variations in the interna-tional prices of wheat were almost completely transmitted for the run long. However, the au-thors claim, it is not possible to affirm that the Argentine and the International markets are perfectly integrated even if they have a higher transmission of prices This is because the hy-pothesis of perfect integration between the mar-kets is rejected when restrictions were imposed to the coefficients related to the long run. Results also indicated that wheat prices in international markets affect the price levels in Argentina.
Therefore, considering such apparent fluctuations in prices and imports, thus taking the findings of all these works into account, this present work aims to analyze the dynamics of wheat prices in the world markets, particularly the Brazilian, Argentine and American markets. The data used for this purpose is discussed in the following section.
Data
analyzing the growth rates in the world’s largest exporter of wheat, and the two main producers of the commodity in the Mercosur commercial zone, in the 2004 to 2012 period. The period is chosen, as explained in the introduction of this work, because it allows the analysis of the trends in wheat prices before and after the financial and food crises when, according to a The global social… (2011), there was a significant spike in food and energy prices, for a myriad of reasons.
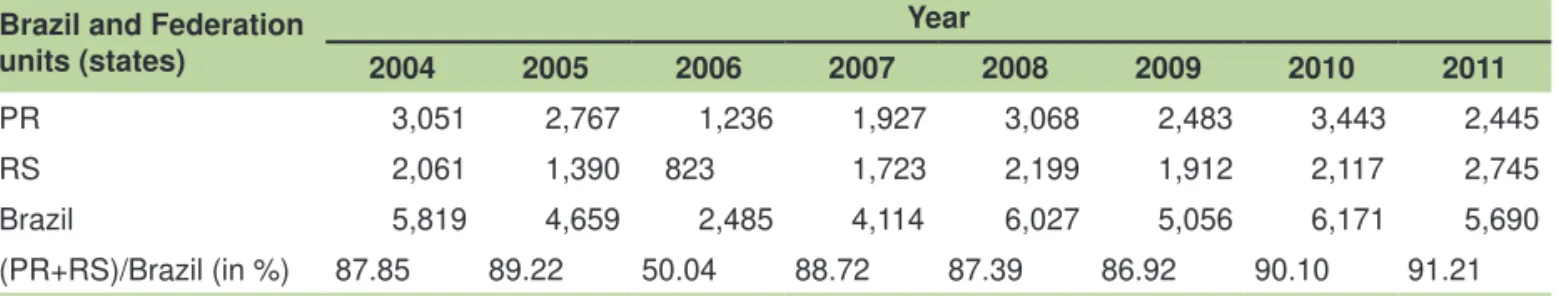
In Brazil, according to the IBGE (2013), wheat production is focused mainly in the coun-try’s southern region; particularly in the states of Rio Grande do Sul and Paraná, which together are responsible for over 80% of the national pro-duction, as can be observed in Table 3.
The state of Paraná stands out in terms of national production when compared to the state of Rio Grande do Sul, according to Brum and Heck (2005) and Brum and Miller (2008), for the following reasons: i) climate conditions; (ii) the anticipation of the wheat harvest, allowing the product to be marketed in the middle region of the country before the entry of imported prod-uct, derived mainly from Argentina and, iii) the proximity to the Southeast, the region with the largest consumer base and processing center of the country, that can channel the crop with lower transport costs.
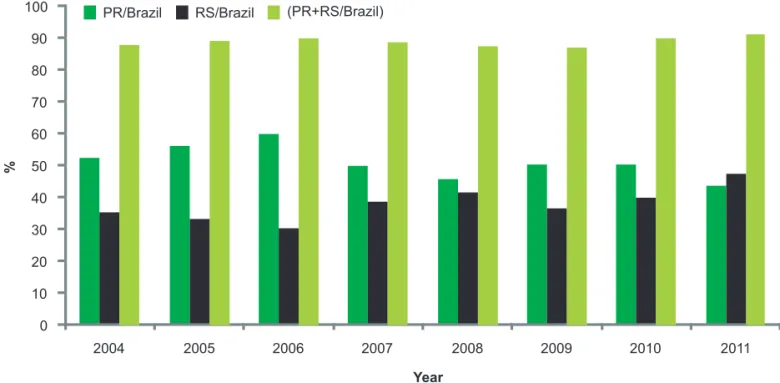
Note in Figure 3 that the percentage of wheat production in the states of Paraná and Rio Grande do Sul together in relation to the Brazilian
production as a whole is on average 80%. Also note that, between 2004 and 2010, the produc-tion in Rio Grande do Sul (RS) is inferior to the production in Paraná (PR), and in 2011, that rela-tion is inverted, and the joint producrela-tion reaches 91.21% of the national wheat production. Thus, it can be said that these two markets are the larg-est wheat producers in Brazil.
Considering the Argentine producers, there are the Bahía Blanca and Necochea re-gions, in the Buenos Aires province and the Up River in Santa Fé. According to Coronel et al. (2010), wheat production in Argentina is focused mainly in the province of Buenos Aires, with approximately 47% of total wheat production in the country. Córdoba12 comes next, with 23%,
and then Santa Fé, with 14%.
As for the American market, the state of Kansas stands out, being the largest national wheat producer. Great part of the American wheat, and also from other countries, is traded through the Chicago Stock Exchange, which has as main agricultural commodities soybeans and corn (SAFRAS & MERCADO, 2012).
To estimate the growth rates in wheat prices, monthly information for the period of January 2004 to June 2012 is used, rounding up 102 observations. The price series for the nine aforementioned markets were obtained from the Safras & Mercado13 consulting agency, with
prices in US$ per ton, based on FOB US Gulf price quotations.
Table 3. Wheat production (in thousand tons) in Paraná (PR), Rio Grande do Sul (RS) and Brazil:
2004-2011.
Brazil and Federation units (states)
Year
2004 2005 2006 2007 2008 2009 2010 2011
PR 3,051 2,767 1,236 1,927 3,068 2,483 3,443 2,445
RS 2,061 1,390 823 1,723 2,199 1,912 2,117 2,745
Brazil 5,819 4,659 2,485 4,114 6,027 5,056 6,171 5,690
(PR+RS)/Brazil (in %) 87.85 89.22 50.04 88.72 87.39 86.92 90.10 91.21
Source: elaborated using data from IBGE (2013).
Trend models
Initially, this study estimates the average rate of growth of the price of wheat for each of the nine markets and, therefore, the following equation is used:
yt = a + βt = ut (1)
Where yt is the logarithm of the price of wheat, β is the parameter which captures the deterministic trend of the price, and ut is the error term. It is worth noting that the subscript t refers to time, measured in months, from January 2004 to June 2012.
From the estimation of this model, the ob-jective consists of verifying if the rate of growth in wheat prices in increasing or decreasing, which is equivalent to testing if H0 : β = 0 vis-à-vis
H1 : β ≠ 0. Rejecting the null hypothesis, it can be said that there is a deterministic trend in the growth rate of wheat prices and, in case it is positive, β > 0 that would be indicative that After presenting the data, it is interesting to
visualize the price series’ behavior over time in the American, Argentine and Brazilian wheat markets (Table 4).
Notice in Figure 4 that during the analyzed period the price series exhibit an upward trend that lasted until mid-2008 (more specifically, May 2008). Then, there is a downturn in prices and, from 2009 onwards, there is a slight recovery in prices, close to the level of 2004.
However, although it seems relatively simple to identify the trend of a time series from the graphi-cal analysis and descriptive statistics, the results can be misleading depending on their properties. In that sense, it is appropriate to employ an econometric methodology to estimate the deterministic trend in wheat prices for the aforementioned markets. Thus, the next section features the presentation of the trend models, with and without structural breaks, as well as the methodology proposed by Perron and Yabu (2009a, 2009b).
Figure 3. Wheat Production in the markets of Paraná and Rio Grande do Sul, 2004 to 2011.
Table 4. Price series and wheat markets analyzed.
Market Series
Bahía Blanca/Argentina Average monthly price of wheat on the Bahía Blanca (Argentina) market
Necochea/Argentina Average monthly price of wheat on the Necochea(1) (Argentina) market
Up River/Argentina Average monthly price of wheat on the Up River (Argentina) market
Chicago/USA Average monthly price of wheat on the Chicago (USA) market
Kansas/USA Average monthly price of wheat on the Kansas (USA) market
Curitiba/Brazil Average monthly price of wheat on the Curitiba/PR (Brazil) market
Porto Alegre/Brazil Average monthly price of wheat on the Porto Alegre/RS (Brazil) market
Maringá/Brazil Average monthly price of wheat on the Maringá/PR (Brazil) market
Cascavel/Brazil Average monthly price of wheat on the Cascavel/PR (Brazil) market
(1) Market located in the province of Buenos Aires, where a large part of the Argentinian wheat market is. For more details, see Safras & Mercado (2012).
Figure 4. Monthly wheat price series, January 2004 to May 2012.
Source: elaborated based on data from Safras & Mercado (2012).
there is a significant growth in prices, while if β < 0, then the growth rate in wheat prices is decreasing. And, if β = 0, it can be inferred that the price of wheat increased at a constant rate during the period analyzed.
the series can possess a stationary trend or a unit root. To estimate equation (1), the Feasible Quasi Generalized Least Squares (FQGLS) method is used, as it allows inferring on the parameter of the slope using the standard normal deviation14.
However, as the series are susceptible to structural breaks15, and these breaks can
in-validate the results of the statistical tests by not modelling these changes, it was opted to also use the methodology featured in Perron and Yabu (2009b), which consists of estimating equation (1) with a dummy variable determined endog-enously, to capture the existence of a structural change in the trend of the prices of wheat.
The break date is estimated from the minimization of the sum of squared errors, being captured from the inclusion of a dummy variable in the regression, as follows:
yt = a + β1t + β2DT = et (2)
where DT = 1 (t > TB) × (t - TB)
Note that (2) differs from (1) only because of the DT term, which represents the dummy variable to capture the structural change, while TB reports the data of the change. The test sta-tistic is based on the FQGLS procedure, with a superefficient estimator with known break dates, based on the Wald test16. On the other hand,
with unknown break dates17, the limitation of the
distributions of the test statistics still depends on the dichotomy between the orders of integration of the series, i.e., I(0) or I(1). However, the Perron and Yabu (2009a) procedure is robust for the presence of components in the error term, i.e., whether it be stationary or integrated18.
As the asymptotic critical values are very close to all significance levels, one allows that in both cases, I(0) and I(1), there is asymptotic convergence. Furthermore, the simulations per-formed by Perron and Yabu (2009b) show signifi-cant improvements in relation to existing tests19.
Based on the above, it should be clear that the choice for the Perron and Yabu (2009a, 2009b) techniques for analyzing the growth rates of wheat prices in Brazil, Argentina and the United States is based on the solid performance of such technique, whether the series is station-ary or not.
Results
From the data obtained from Safras & Mercados for the January 2004 to June 2012 pe-riod of wheat prices for the nine aforementioned markets, the model that was estimated first was the one represented by equation (1), i.e., the deterministic trend model for the price of wheat. Afterwards, equation (2) was estimated, to test if throughout the period analyzed, there was any significant structural change in prices.
Thus, the presentation of the results is based on the statistical significance of the sug-gested break, because if the sugsug-gested date is not statistically significant, then the analysis and discussion of the results are based on the model without breaks.
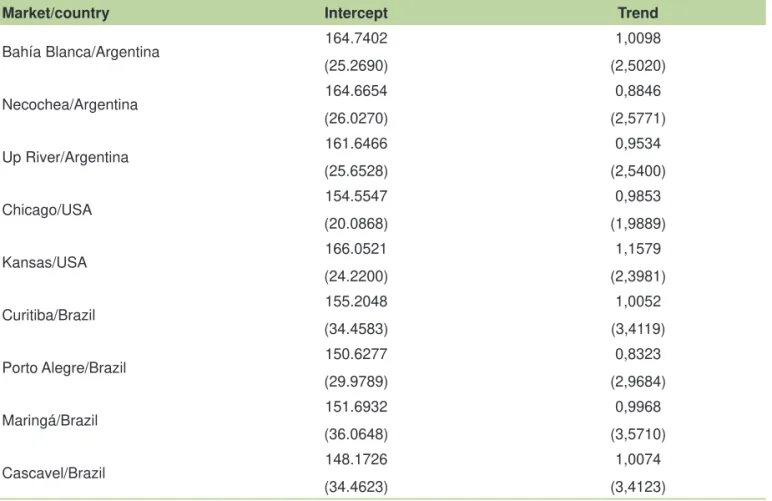
Table 5 presents the estimates of the trend in wheat prices, following the methodology of Perron and Yabu (2009a). The results showed that all markets are growing at a steady rate over the analyzed period. In other words, the growth
14 Perron e Yabu (2009a) argue that it is possible that the function of that test is normally distributed, with critical value at the 95%
confidence level with ± 1,96.
15 As can be observed in Figure 3.
16 The Wald test is asymptotically distributed as a chi-square random variable.
17 It is worth mentioning that the choice of the date of the break is made endogenously. In case it is statiscally significant, the model with
structural break is used in detriment of the linear model.
18 The integrated term denotes the degree of differentiation required to achieve stationarity (which here means having constant mean and
variance over time).
rate of the price of wheat in the markets analyzed is statistically equal to zero from January 2004 to June 2012. Thus, it can be said that these markets are integrated, since the growth rate of wheat prices is constant in Argentina, Brazil and the U.S.
Table 6 includes estimates of the trend before and after the break, and the date of the break, as well as the t-statistic, for the prices in the wheat market. Note that for the nine markets analyzed, none had significant structural change at the 5%level. In other words, for all markets, the estimates of the linear model, presented in Table 5, are statistically valid.
However, in terms of the break date, which is reported in Table 6, for both the Brazilian and Argentine markets, the break occurs in the same period (March 2008). As for the American mar-ket, it can be observed that in Chicago, the break
occurs in December 2007, while in Kansas, it occurs in January 2008. As the structural break analysis is statistically insignificant, it can be in-ferred that this break acts only as an adjustment in the worldwide wheat market.
The breaks occurs firstly on the American market, and then on the other markets. This oc-curs because worldwide wheat prices are deter-mined initially at the Chicago Stock Exchange. Afterwards the price determination in Chicago, the breaks occurs in the other markets in the
Mercosur zone (Argentina and Brazil), which depend on the Chicago quotations for their inter-national trading (exports and imports of wheat).
The break period coincides with the world wheat crisis, which occurs because of an increase in consumption, and production was not able to meet demand. According to Pichetti (2010) and the The global social… (2011), the prices of
Table 5. Estimations of Trends in the prices of wheat, using the methodology from Perron e Yabu (2009a).
Market/country Intercept Trend
Bahía Blanca/Argentina 164.7402 (25.2690)
1,0098
(2,5020)
Necochea/Argentina 164.6654
(26.0270)
0,8846
(2,5771)
Up River/Argentina 161.6466
(25.6528)
0,9534
(2,5400)
Chicago/USA 154.5547
(20.0868)
0,9853
(1,9889)
Kansas/USA 166.0521
(24.2200)
1,1579
(2,3981)
Curitiba/Brazil 155.2048
(34.4583)
1,0052
(3,4119)
Porto Alegre/Brazil 150.6277
(29.9789)
0,8323
(2,9684)
Maringá/Brazil 151.6932
(36.0648)
0,9968
(3,5710)
Cascavel/Brazil 148.1726
(34.4623)
1,0074
(3,4123)
the main agricultural commodities (particularly wheat) increase because of a considerable ex-pansion of foreign consumption, which comes to a halt due to the worldwide financial crisis in 2008. According to Pichetti (2010), the global supply of wheat was also hampered by adverse climate change.
Concluding remarks
This work investigated the behavior of the growth rates in the prices of wheat for three countries, Brazil and Argentina, being the main wheat producers in the Mercosur trading zone, and the United States of America, the largest wheat exporter in the world. Wheat, besides being a cereal widely used in the preparation of various food products, beverages and animal rations, is the largest commodity traded in the international market.
For that purpose, monthly data on the prices of wheat in nine markets in Brazil, Argentina and the United States was used, being three of those markets in Argentina, two in the U.S. and four in Brazil. It is worth noting that these three countries together account for 12% of the world production of wheat. The analysis is taken from the estimation of trend models to capture, mainly, which of aforementioned markets had the highest growth rate during the
period 2004-2012, which are the years before and after the financial and food crises of 2008, where commodity prices spiked worldwide.
It was observed that both in the Brazilian markets, as well as those in Argentina, breaks occurred in the same period (March 2008). However, in the American market, in Chicago, the break occurred in December 2007, while in Kansas, it was in January 2008.
Therefore, the breaks occurred firstly in the American market, and only afterwards in the other markets, due to the fact that worldwide wheat prices are determined initially in the Chicago Stock Exchange. Afterwards, the other markets follow its trend, firstly in Chicago, then in Kansas, and only then the Argentine and Brazilian markets, as these markets depend of Chicago quotations for international trading (i.e.
exporting and importing wheat).
The break period coincides with the worldwide wheat crisis (end of 2007, early 2008), which occurred because of an increase in con-sumption that could not be met sufficiently by the supply, mainly because of adverse climate conditions. However, this increase was inter-rupted due to the 2008 financial crisis.
Thus, overall, it can be said that between 2004 and 2012, the growth rates in wheat prices
Table 6. Estimations and Structural Break Test in the Trend in the Prices of Wheat.
Market/country Break date Intercept Pre-break Post-break Test statistic
Bahía Blanca/Argentina March/2008 160.6050 5.1450 -3.0443 -0.1689
Necochea/Argentina March /2008 160.4010 5.1490 -3.2963 -0.162
Up River/Argentina March /2008 157.3920 5.2080 -3.2178 -0.1624
Chicago/USA December/2007 151.2768 4.2632 -1.8676 -0.1582
Kansas/USA January/2008 162.6800 4.5300 -1.8960 -0.0702
Curitiba/Brazil March /2008 150.3706 5.8394 -3.7341 -0.1188
Porto Alegre/Brazil March /2008 146.9726 4.4874 -2.7512 -0.1876
Maringá/Brazil March /2008 146.9150 5.7750 -3.6876 -0.1504
Cascavel/Brazil March /2008 143.4050 5.7750 -3.6667 -0.1308
in Argentina, Brazil and the United States in-creased at a constant rate.
In this sense, public policies would be advised, such as expanding access to credit and reducing taxes, with the purpose of stimu-lating increased wheat production. That way, Brazilian production could be able to supply the domestic market, which is in great demand. In addition, non-dependence on the Argentine and American markets could be improved, and can be a positive point in generating a fiscal surplus.
References
ALMEIDA, F. M.; SILVA, O. M.; CAMPOS, A. C.Potencial de comércio no mercado Internacional de trigo. Pesquisa & Debate, v. 22, n. 1, p. 189-208, 2011.
BAFFES, J.; DENNIS, A. Long-term drivers of food prices. 2013. (Policy research working paper, 6455). Available at: <http://documents.worldbank.org/curated/ en/832971468150565490/pdf/WPS6455.pdf>. Acesso em: Mar. 20 2014.
BASS, H.-H. Finanzmärkte als Hungerverursacher? Bonn: Deutsche Welthungerhilfe e.V., 2011. 109 p.
BENDER FILHO, R.; AMORIM, A. L.; CORONEL, D. A.; SOUSA, E. P. de. Determinantes da demanda brasileira por importação de trigo do Mercosul. Espacios, v. 34, n. 11, p. 20, 2013.
BRUM, A. L.; HECK, C. R. A economia do trigo no Rio Grande do Sul: breve histórico do cereal na economia do estado. Análise, v. 16, n. 1, p. 29-44, jan./jul., 2005. BRUM, A. L.; MULLER, P. K. A realidade do trigo no Brasil: o elo produtores/cooperativas. Revista de Economia e Sociologia Rural, v. 46, n. 1, p. 145-169, 2008.
BUNZEL, H.; VOGELSANG, T. J. Powerful trend function tests that are robust to strong serial correlation, with an application to the prebish: singer hypothesis. Journal of Business and Economic Statistics, v. 23, n. 4, p. 381-394, Oct. 2005.
COLLE, C. A. A cadeia produtiva do trigo no Brasil: contribuição para a geração de emprego e renda. 1998. 160 f. Dissertação (Mestrado em Economia Rural) – Universidade Federal do Rio Grande do Sul, Porto Alegre.
CORONEL, D. A.; AMORIM, A. L.; SOUSA, E. P. de; LIMA, J. E. de. Integração e transmissão de preços entre os mercados de trigo argentino e internacional. Pesquisa & Debate, v. 21, n. 2, p. 279-305, 2010.
DE GORTER, H. Explaining agricultural commodity price increases: the role of biofuel policies. 2008. Available at: <https://www.researchgate.net/profile/ Harry_Gorter/publication/254954275_Explaining_ Agricultural_Commodity_Price_Increases_The_Role_ of_Biofuel_Policies/links/550c0ba00cf2528164daf87f/ Explaining-Agricultural-Commodity-Price-Increases-The-Role-of-Biofuel-Policies.pdf>. Acesso em: Mar. 20 2014.
FAO. Hunger at a glance: key numbers in the 2010 SOFI report. 2010. Available at: <http://www.fao.org/fileadmin/ user_upload/newsroom/docs/2010_hunger_facts.pdf>. Accessed on: Mar. 20 2014.
FAO. Soaring food prices: facts, perspectives, impacts and actions required. In: HIGH-LEVEL CONFERENCE ON WORLD FOOD SECURITY: THE CHALLENGES OF CLIMATE CHANGE AND BIOENERGY, Rome, 2008. [Proceedings…] Rome, 2008. Available at: <http://www. fao.org/fileadmin/user_upload/foodclimate/HLCdocs/ HLC08-inf-1-E.pdf>. Acesso em: Mar. 20 2014.
FARIA, J. M. Análises das correlações entre preços de trigo: recebido pelo produtor e pago pelo consumidor. In: CONGRESSO DA SOCIEDADE BRASILEIRA DE ECONOMIA E SOCIOLOGIA RURAL, 47., 2009, Porto Alegre. Desenvolvimento rural e sistemas agroalimentares: os agronegócios no contexto de integração das nações: anais… Brasília, DF: Sober, 2009. 16p.
GUTIERREZ, L.; PIRAS, F. A Global Wheat Market Model (GLOWMM) for the analysis of wheat export prices. In: AIEAA CONFERENCE: BETWEEN CRISIS AND DEVELOPMENT: WHICH ROLE FOR THE BIO-ECONOMY, 2., 2013, Parma. Between crisis and development: which Role for the Bio-Economy. Parma: AIEAA, 2013. Available at: <https://ageconsearch.umn. edu/bitstream/149760/2/121_Gutierrez.pdf>. Acesso em: Mar. 20 2014.
HARVEY, D. I.; LEYBOURNE, S. J.; TAYLOR, A. M. R. A simple, robust and powerful test of the trend hypothesis.
Journal of Econometrics, v. 141, n. 2, p. 1302-1330, Dec. 2007. DOI: 10.1016/j.jeconom.2007.02.005.
IBGE. Sistema IBGE de Recuperação Automática - SIDRA. 2013. Available at: <https://sidra.ibge.gov.br/ home/pimpfbr/brasil>. Accessed on: Mar. 20 2014.
MACHADO, T. de A.; FREITAS, C. A. de. Dinâmica da formação de preços no mercado de trigo do Brasil.
Cadernos de Economia, v. 14, n. 26, p. 7-18, jan./jun. 2012.
PERRON, P.; YABU, T. Estimating deterministic trends with an integrated or stationary noise component. Journal of Econometrics, v. 151, n. 1, p. 56-69, July 2009a. PERRON, P.; YABU, T. Testing for shifts in trend with an integrated or stationary noise component. Journal of Business and Economic Statistics, v. 27, n. 3, p. 369-396, 2009b. DOI: 10.1198/jbes.2009.07268.
PICHETTI, P. Menor oferta mundial eleva o preço do trigo.
Folha de São Paulo, Ago. 21 2010. Available at: <http:// www1.folha.uol.com.br/fsp/mercado/me2108201023. htm>. Accessed on: Mar. 20 2014.
ROSSI, R. M.; NEVES, M. F. Estratégias para o trigo no Brasil. São Paulo: Atlas, 2004. 224 p.
SAFRAS & MERCADOS. Dados sobre trigo. 2012. Available at: <www.safras.com.br>. Accessed on: Mar. 20 2014.
THE GLOBAL food crises. In: THE GLOBAL social crisis: report on the world social situation 2011. New York: UN Department of Economic and Social Affairs, 2011. p. 62-74.
THE GLOBAL social crisis: report on the world social situation 2011. New York: United Nations, 2011.
TROESTER, B.; STARITZ, C. Fundamentals or