Effects of Acute Normovolemic Hemodilution on Blood
Coagulation: Comparison between Tests of an In Vivo
and an In Vitro Model
Marco Aurélio Beloto de Souza
1, Jyrson Guilherme Klamt, TSA
2, Luís Vicente Garcia, TSA
2Summary: Souza MAB, Klamt JG, Garcia LV – Effects of Acute Normovolemic Hemodilution on Blood Coagulation: Comparison between Tests of an In Vivo and an In Vivo Models.
Background and objectives: Normovolemic hemodilution produces conflicting results on hemostasis, since works differ according to the fluids used, degree of hemodilution, method used to evaluate hemostasis, and the way used to produce hemodilution. The effects of hemodilution on hemostasis can depend on how it is done and whether an in vivo or an in vitro model is used. The objective of this study was to evaluate and compare hemostasis in two different degrees of hemodilution in both models.
Methods: Thirteen patients underwent acute normovolemic hemodilution with a reduction in hematocrit to 30% and 20%. Volemia was maintained with Ringer’s lactate. Blood samples for evaluation of hemostasis were collected at moments M1 – before hemodilution, M2 – 20 minutes after obtaining a hematocrit of 30%, and M3 – 20 minutes after obtaining a hematocrit of 20%. Before hemodilution, blood samples were collected to perform hemodilution in a test tube. The degree of hemodilution in the test tube (in vitro) was the same as that produced in the patients (in vivo). Hemostasis was evaluated by the prothrombin time, partial activated thromboplastin time, and thrombin time, and by quantifying fibrinogen.
Results: The behavior of the tests that evaluated hemostasis was identical in both models. An increase in PT, aPTT, and TT, as well as a reduc-tion in the concentrareduc-tion of fibrinogen was observed. The higher degree of hemodilureduc-tion was associated with greater compromise of coagulareduc-tion.
Conclusions: The in vitro model can substitute the in vivo mode in the evaluation of hemostasis during acute normovolemic hemodilution.
Keywords: BLOOD: coagulation, normovolemic hemodilution.
[Rev Bras Anestesiol 2010;60(4): 363-375] ©Elsevier Editora Ltda.
INTRODUCTION
Acute normovolemic hemodilution (ANH) is used to reduce
allogeneic transfusions in the perioperative period 1. It consists
on the removal of an amount of blood into an anticoagulant-containing plastic bag and the infusion of an acellular solution
to maintain the blood volume 2. Patients undergoing
hemodilu-tion to hematocrit as low as 20% can maintain oxygen supply to
tissues due to several compensatory mechanisms 3. However,
besides erythrocytes, coagulation factors and platelets are lost to the plastic bag, which might disrupt hemostatic mechanisms
du-ring surgery 4. Controversies on hemostasis during hemodilution
are as old as hemodilution itself since the countless studies differ
according to the fluid used for volume replacement 5-7, degree of
hemodilution 8, method used to evaluate hemostasis 9,10, and the
way used to produce hemodilution 5,6.
Volume replacement with colloids or crystalloids can influence hemostasis. Using a viscoelastic method to
eva-Received from the Hospital das Clínicas da Faculdade de Medicina de Ribeirão Preto da Universidade de São Paulo (FMRP-USP).
1. Anesthesiologist; Post-graduate student at the Faculdade de Medicina de Ribeirão Preto – FMRP-USP
2. Assisting-Doctor Professor; Anesthesiology Professor of the Faculdade de Medicina de Ribeirão Preto– FMRP-USP
Submitted on February 4, 2010 Approved on March 15, 2010
Correspondence to: Dr. Luís Vicente Garcia Rua José da Silva, 624/94 14090-040 – Ribeirão Preto, SP E-mail: [email protected]
luate the formation of the clot, Konrad et al. tested the effects of different solutions on hemostasis demonstrating that hydroxyethyl starch (HES) prolonged the time of clot formation, Ringer’s lactate did not affect it, and gelatin
so-lution showed minimal effect on hemostasis 9. Similarly,
Egli et al. evaluated the effects of different solutions but the degree of hemodilution also varied, and they demons-trated that HES prolonged the time of clot formation at any degree of hemodilution, and that NS with the hematocrit at 30% reduces the time of clot formation producing a
hyper-coagulable state 11.
Hemostasis can be evaluated by several methods, from laboratorial, such as prothrombin time (PT), thromboplastin time (aPTT), thrombin time (TT), platelets, quantification of antithrombin III, and quantification of fibrinogen to functional tests such as thromboelastography. Ruttmann, James, and Aronson used laboratorial methods and thromboelastography and concluded that hemodilution has a pro-coagulating effect, possibly by accelerating thrombin formation.
Several studies evaluated hemostasis in hemodilution
pro-duced in the test tube 5.9.12.13. In the present study we tested
METHODS
This study was approved by the Ethics on Research Com-mittee of Hospital das Clínicas of Ribeirão Preto. All patients were invited to participate in the study during the pre-anes-thetic evaluation and they signed an informed consent. In pa-tients younger than 18 years, their legal guardians signed the informed consent.
Thirteen patients who fulfilled the inclusion criteria were selected: undergoing elective surgery with expected blood loss greater than 700 mL, physical status I or II (classification of the American Society of Anesthesiologists), age between 15 and 60 years, and hematocrit in the immediate preope-rative period between 36% and 50%. Patients who used the following medications up to 60 days before the surgery were not included: acetylsalicylic acid and derivatives, non-steroidal anti-inflammatories, oral anticoagulants, and heparin.
All patients underwent general anesthesia under controlled mechanical ventilation. In the pre-anesthesia room, a vein in the elbow fold or the back of the hand was punctured for
administra-tion of pre-anesthetic medicaadministra-tion (0.05 to 0.1 mg.kg-1 of
midazo-lam) and anesthetic induction. Then, each patient was transferred to the operating room. Immediately before anesthetic induction, basic monitoring was installed: electrocardiogram, pulse oxime-ter, and non-invasive blood pressure. The standard anesthetic technique used was general anesthesia with controlled mecha-nical ventilation. The following drugs were used for anesthetic
induction: sufentanil (0.3 to 0.5 mg.kg-1) or remifentanil (0.2 to
0.4 µg.kg-1.h-1), propofol (2 to 4 mg.kg-1), and atracurium (0.5 mg.
kg-1). After tracheal intubation, the patient was placed under
controlled mechanical ventilation with a tidal volume between
8 and 10 mL.kg-1 and respiratory rate adjusted to obtain an initial
PETCO2 between 30 and 40 mmHg. When the patient had to be
placed in ventral decubitus, ventilatory parameters were
adjus-ted to maintain PETCO2 between 30 and 40 mmHg.
Hypnosis was maintained with continuous infusion of
pro-pofol and opioid (sufentanil 0.5 mg.kg-1.h-1 or remifentanil
0.2 µg.kg-1.h-1). Anesthetic gases (isoflurane) were used freely
to maintain the anesthetic plane. The neuromuscular blocker was administered every 40 to 60 minutes in 5 mg increments to avoid the patient from moving during the procedure.
After anesthetic induction, an 18 or 20G catheter was in-serted in one of the radial arteries to obtain the invasive blood pressure and draw blood for hemodilution. Then, another vein was puncture to insert a large bore catheter (16 or 14G) for volume replacement. In patients who were in ventral decubi-tus for the procedure, a double-lumen catheter was inserted in the internal jugular or subclavian vein. A thermometer was introduced in the oropharynx to determine the temperature. A urinary catheter was also inserted in all patients by the surgi-cal team to control the urine output. Depending on the type of procedure, prior regional anesthesia was performed for con-trol of intra-and postoperative pain.
Once the patient was positioned for the surgery, the hemo-dilution process done in two steps was initiated. In the first step a volume of blood enough for the hematocrit to achieve 30% was removed; in the second step a complementary volume of
blood for the hematocrit to achieve 20% was removed. Twen-ty minutes after obtaining a hematocrit of 30% the second step was initiated. This volume was calculated according to the Gross
formula 14: volume of blood to be removed (milliliters) = (EBV).
(htci – htcf).(htcm)-1 in which htci is the initial hematocrit, htcf is
the hematocrit to be achieved, htcm is the mean hematocrit, i.e.,
(htci + htcf)/2, and EBV is the estimate blood volume in milliliters.
To calculate the blood volume, the proportion of 65 mL.kg-1 was
used for female patients, and 70 mL.kg-1 for male patients 15.
Blood was removed through the catheter inserted in the radial artery and stored in plastic bags containing 50 mL of ci-trate, phosphate, dextrose, and adenine (CPD-A). A maximal volume of 450 mL of blood was stored in each plastic bag. This blood was stored in the operating room, at room tempe-rature for the maximal period of six hours. During the whole hemodilution process some hemodynamic parameters (blood pressure and heart rate) were followed-up every minute.
Concomitantly to the removal of blood, Ringer’s lactate (RL) was administered for maintenance of the blood volume. This solution was warmed previously in a microwave oven for one minute (approximate temperature of 37° C). The rate of infusion of Ringer’s lactate was three times higher than the rate of blood removal, and 3 mL were infused for each millili-ter of blood removed. The time for removal of the calculated blood volume did not exceed 45 minutes and in some cases it was extended until the initial moments of the surgery (opening of the skin and dissection of planes).
The whole blood volume removed was returned to the pa-tient at the end of the anesthetic procedure or before that in case he/she needed. The following parameters were used to return the blood to the patient before planned: hemodynamic instability (hypotension with SBP < 55 mmHg, and tachycar-dia [HR > 120 bmp]) unresponsive to infusion of fluids or signs
of cellular distress (plasma lactate levels above 3.5 g.dL-1).
The following parameters were measured continuously du-ring the entire procedure and recorded every 5 minutes: invasive
blood pressure, heart rate, and oxygen saturation; PETCO2 and
esophageal temperature were recorded every 15 minutes. The urine output, fluid losses, and fluids administered were recorded every hour until the end of the procedure.
Immediately before hemodilution (called in vivo hemodilu-tion), a blood sample was drawn for the in vitro hemodilution. This hemodilution was performed in the test tube, and the target hematocrits were 30% and 20%. To obtain the target hematocrit, 10 mL of Ringer’s lactate were added, according to the formula C1V1 = C2V2, in which C1 is the initial hematocrit of the pa-tient, V1 is the volume of blood in the test tube, C2 is the target hematocrit (20% or 30%), and V2 is the final volume in the test tube (volume of Ringers lactate to be added is equal to the final volume minus the initial volume of blood). Out of the final blood volume obtained after the in vitro hemodilution for the two desi-red hematocrits, blood samples were obtained for the following exams: prothrombin time (PT) activated partial thromboplastin time (aPTT), thrombin time (TT), and fibrinogen level.
of sodium, potassium, calcium, and glucose) for control of the patient, and for evaluation of hemostasis, platelets, prothrombin time (PT), activated partial thromboplastin time (aPTT), thrombin time (TT), and fibrinogen at the following moments: M1 – after anesthetic induction and before in vivo hemodilution; M2 – 20 mi-nutes after achieving the hematocrit of 30%; and M3 – 20 minu-tes after achieving the hematocrit of 20%. Blood samples were sent to the Laboratório Central do Hospital das Clínicas soon after being drawn, and the samples for coagulation exams were stored n a plastic tube containing 3.2% citrate and maintained in a container with ice until they were sent to the Laboratório de Hemostasia do Hospital das Clínicas de Ribeirão Preto. In the Laboratório de Hemostasia, the blood samples were stored and all tests were done at the same time.
Adverse events that developed during the whole time the pa-tient was hospitalized were recorded. The following were con-sidered adverse events: cardiac arrhythmias, hypotension or hypertension, thrombocytopenia, and acute pulmonary edema.
The sample size was calculated for a test power of 80% to detect a 20% difference in the quantification of PT and aPTT. For the calculation, the standard deviation for those parameters from
similar studies was used 6,19. The data obtained was expressed
as mean, standard deviation (SD), and median. In all compari-sons, the level of critical significance was established as 5% (p < 0.05). To compare the moments of each model, Analysis of Variance for repeated measurements was used for parametric data with normal distribution, and later when indicated multiple comparisons were done using the Student-Newman-Keuls test. When the data did not show normal distribution, the Friedman test followed by the Dunn test for multiple comparisons was
used. The Student t test (data with normal distribution) or the
Mann-Whitney test data without normal distribution) were used for intergroup comparisons.
RESULTS
Table I shows the demographic data of the 13 patients who participated in this study.
As for the physical status, 10 patients were classified as ASA I, and three as ASA II. The three patients ASA II had hypertension, but their blood pressure was under control by medication in the immediate preoperative period. Seven pa-tients underwent spine arthrodesis, three oncologic prostatec-tomy, two orthognathic surgery, and one to nephrectomy.
Only one complication was observed. One of the ASA II pa-tients, 64 years old, developed arrhythmia shortly after the end of the surgery. He was medicated and remained intubated for six hours in the Intensive Care Unit, being extubated when he impro-ved. He remained in the Intensive Care Unit for 24 hours.
To obtain a hematocrit of 30%, 1,158.15 ± 425.79 mL of blood were removed (median 960 mL), and to obtain a hematocrit of 20%, 2,211.31 ± 726.22. mL (median 2,160 mL) of blood were removed. Table II shows the levels of hematocrit before hemodi-lution and after obtaining hematocrits of 30% and 20%.
A reduction in systolic pressure was observed in M2 and M3 in relation to M1 (p < 0.05) but a significant difference
be-Table I – Demographic Data
Weight (kg) Age (years)
Mean 65.62 39.85
Standard deviation 15.51 18.39
Median 64 32
Maximum 90 68
Minimum 46 16
Table II – Hematocrit (in %) on the Three Moments
M1 M2 M3
Mean 39.36 25.95 21.85
Standard deviation 3.27 4.34 5.21
Median 40 26 21
Maximum 45 33 34
Minimum 36 18 15
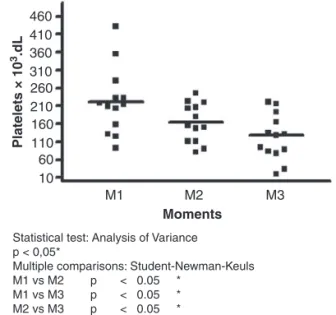
Figure 1 – Platelet Count During the Hemodilution Process. The horizontal bar represents the mean values at each moment.
460 410 360 310 260 210 160 110
M1 M2
Statistical test: Analysis of Variance p < 0,05*
Multiple comparisons: Student-Newman-Keuls M1 vs M2 p < 0.05 *
M1 vs M3 p < 0.05 * M2 vs M3 p < 0.05 *
M3
Moments
60 10
Platelets × 10
3.dL
tween M2 and M3 was not observed. The other hemodynamic parameters (diastolic blood pressure, mean arterial pressure, and heart rate) showed statistical similarities in all moments. The temperature reduced after the first phase of hemodilution (p < 0.05) but it returned to baseline levels after the end of the second phase of hemodilution (M3).
A PaO2 lower than 90 mmHg was not observed in any
of the three moments. A statistically significant difference
in pH and PaCO2 was not observed. Base excess showed
a more negative value in M3 and a statistically significant difference was observed in relation to M1, but a statistically significant difference was not observed between M1 and M2. Plasma lactate levels increased in M2 and M3 and a statistically significant difference was observed in relation to M1. A difference between M2 and M3 was not observed. Ionic calcium increased in M2 and it was different than in M1, but not than M3.
Hemodilution caused a marked reduction in the number of platelets en M2 and M3 (Figure 1).
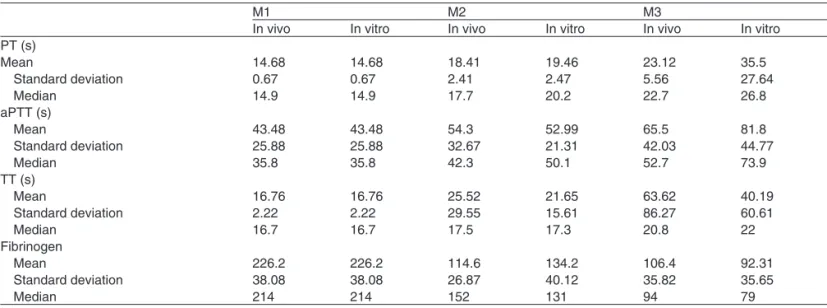
Table III – PT, aPTT, TT, and Fibrinogen Levels in the In Vivo e in Vitro Hemodilution.
M1 M2 M3
In vivo In vitro In vivo In vitro In vivo In vitro
PT (s)
Mean 14.68 14.68 18.41 19.46 23.12 35.5
Standard deviation 0.67 0.67 2.41 2.47 5.56 27.64
Median 14.9 14.9 17.7 20.2 22.7 26.8
aPTT (s)
Mean 43.48 43.48 54.3 52.99 65.5 81.8
Standard deviation 25.88 25.88 32.67 21.31 42.03 44.77
Median 35.8 35.8 42.3 50.1 52.7 73.9
TT (s)
Mean 16.76 16.76 25.52 21.65 63.62 40.19
Standard deviation 2.22 2.22 29.55 15.61 86.27 60.61
Median 16.7 16.7 17.5 17.3 20.8 22
Fibrinogen
Mean 226.2 226.2 114.6 134.2 106.4 92.31
Standard deviation 38.08 38.08 26.87 40.12 35.82 35.65
Median 214 214 152 131 94 79
Figure 2 – Comparison of the Prothrombin Time (PT) In Vivo an In Vitro. 75
50
Pr
othr
ombin time (seconds)
p > 0.05
p > 0.05
in vivo
in vitro
25
M1 M2 M3
0
Figure 3 – Comparison of the Activated Partial Thromboplastin Time (aPTT) In Vivo an In Vitro.
50
Activ
ated par
tial thr
ombopplastin
time (aPTT) (seconds)
p > 0.05
p > 0.05 in vivo
in vitro
100 150
M1 M2 M3
0
50
–50
Thr
ombin time (TT) (seconds)
p > 0.05 p > 0.05
in vivo
in vitro 100
150
M1 M2 M3
0
Figure 4 – Comparison of the Thrombin Time (TT) In Vivo an In Vitro.
Figure 5 – Comparison of Fibrinogen In Vivo an In Vitro.
Fibrinog
en (mg.dL)
p > 0.05
p > 0.05
in vivo in vitro
100 200 300
M1 M2 M3
0 In the in vivo hemodilution, PT increased and fibrinogen
reduced in M2 and M3 (Analysis of Variance – p < 0.05) and
M1 ≠ M2 ≠ M3 (p < 0.05, multiple comparisons –
Student-Newman-Keuls test). The behavior of aPTT and TT was similar. A significant increase was observed in M2 and M3 (p < 0.05 – Friedman test), but multiple comparisons (Dunn
test) indicated that M1 = M2, M1 ≠ M3, and M2 = M3.
In the in vitro hemodilution, the PT increased (p < 0.05 – Analysis of Variance), but its behavior differed from that seen in the in vivo hemodilution. Multiple comparisons
(Student-Newman-Keuls test) indicated M1 = M2, M1 ≠ M3, and M2 ≠
M3. The in vitro behavior of fibrinogen was similar to the in vivo behavior. In addition, the same was observed for the in vi-tro behavior of aPTT. Thrombin time increased in M2 and M3, and multiple comparisons (Dunn test) indicated that M1 = M2,
M1 ≠ M3, and M2 ≠ M3.
DISCUSSION
Despite several studies, both in vitro and in vivo, on the qualitative and quantitative changes in hemostasis after hemodilution some doubts remain and they are due to the conflicting results among studies. With the objective to sol-ve those doubts, in the present study each patient was used as his/her own control and the same type of fluid was used to maintain the blood volume. The calculation of the volume of blood to be removed to achieve the desired hematocrit
used the Gross formula 14, but not all patients achieved the
desired target (Ta ble II) since practically it is not easy to concatenate the rate of infusion and the rate of removal. Besides, the level of the hematocrit can vary due to
adapta-tions of the body to hemodilution 16. This should have been
minimized by adopting similar waiting times for collection of the exams and having blood drawn before additional he-modilution occurred due to intraoperative bleeding. In the in vitro hemodilution, the target-levels of hematocrit were achieved due to the lack of compensatory mechanisms and practicality of execution. As criteria of patient selection un-dergoing surgeries with a great potential of blood loss and absence of hemostasis alterations were used. Despite this, the exams done at M1 indicated a great variability of results especially concerning the aPTT. Only patients ASA I or II to tolerate deep hemodilution (20%) were selected. Age was not a limiting factor for the selection, since even patients
ol-der than 60 years could tolerate this procedure 17. Patients
with higher weight required removal of a greater volume of blood to achieve the desired hematocrit. Thus, it is easier to obtain in those patients discrepancies in relation to the volume calculated by the Gross formula.
Blood volume replacement was done with Ringer’s lactate, and colloids (starch or gelatin) were not administered before
the blood for the tests was drawn. Boldt et al. (2002) 18 on
an in vivo study, but with patients who did not undergo he-modilution, demonstrated that patients who receive hydration with NS or Ringer’s lactate did not show differences in hemos-tasis evaluated by thromboelastography. Acidosis was more frequent in patients who received NS. Ng, Lam, and Chan
19 using NS and evaluation by thromboelastography observed
a hypercoagulable state in patients who underwent hemodilu-tion to a hematocrit of 30%. They attributed this effect to the reduction of antithrombin III and maintenance of the complex thrombin-antithrombin, which might have favored thrombin generation. Note that thrombin generation is the central
bio-chemical reaction in normal hemostasis and in thrombosis 20.
Other authors 6,21-23 using thromboelastography observed the
same results both in vivo and in vitro. Egli et al. 11 also believe
that the cause of the hypercoagulable state is an imbalan-ce between natural procoagulant and anticoagulant factors, in which protein C and antithrombin III are more sensitive to dilution. It is questioned whether the hypercoagulable state is really caused by moderate hemodilution, since a similar sta-te was observed in patients during preparation for regional blocks, even before the infusion of any drug or intravenous
solution 24.
One of the critics to the work of Ng, Lam, and Chan 19 is
that blood replacement with NS produced more a state of hypovolemia than hemodilution, which might favor the hypercoagulable state. It is possible that in the present study patients did not experience a state of hypovolemia although the central venous pressure (CVP) was not moni-tored in the majority of patients. It would have been interes-ting to measure the CVP, but the puncture of a central vein would not be justifiable in some of the patients selected for this study.
The majority of the studies that evaluated hemostasis du-ring in vivo hemodilution used moderate degrees of hemodi-lution (hematocrit close to 30%), and the majority that used more profound degrees of hemodilution (hematocrit close to
20%) used in vitro models 25. Considering that only profound
hemodilution avoid allogeneic transfusions, it is interesting to evaluate this degree of hemodilution on hemostasis. Singbartl
et al. 4 using a mathematical model demonstrated that during
profound hemodilution hemostasis degenerated before the supply of oxygen to tissues, i.e., the limiting factor for hemo-dilution would not be the respiratory function of erythrocytes, but the changes in hemostasis caused by dilution of platelets and coagulation factors. Similarly, the isolated reduction of hematocrit in patients who maintain normal levels of platelets and coagulation factors should not constitute an indication for blood transfusion, which goes against those who defend maintenance of the hematocrit of at least at 30% in order not
to worsen hemostasis 26.
Maintenance of the blood volume in patients with hemodi-lution is fundamentally important to avoid metabolic derange-ments. In the present study, patients remained hemodynami-cally stable during the entire evaluation period. Base excess and plasma lactate levels showed especially in M3 a modi-fication in relation to M1 which might indicate some degree of tissue suffering. It is unlikely that this have happened and affected hemostasis, since the other parameters including he-modynamic remained stable.
Hypothermia combined with acidosis has a negative effect
on blood coagulation 27. Despite the care to avoid
hypother-mia, our patients showed a reduction in body temperature in M2, which returned to pre-dilution levels in M3. The short period of hypothermia was not enough to cause substantial changes in hemostasis. Planned hemodilution differs from
hemodilution secondary to trauma and large blood loss 28. In
planned hemodilution, the blood volume and temperature are maintained, without a large consumption of platelet and coa-gulation factors.
Moor, Woolley, and Midwinter 29 defend that
thromboe-lastography and thromboelastometry are more adequate to evaluate blood coagulation than conventional tests. They refer that the depletion of coagulation factors and fibrinoly-sis should have a significant contribution in the perception of coagulopathies. They refer that those techniques allow accurate monitoring of blood coagulation as a whole, and especially in situation in which conventional tests are not so
sensitive. However, Horlocker et al. 30 evaluated the
patients undergoing arthrodesis of the spine and concluded that both the PT and aPTT are not good for orientating the decision and indication of transfusion of blood products. In the present study, only methods routinely available at our hospital, i.e., PT, aPTT, TT, and quantification of fibrinogen were used.
Prothrombin time is specific for the evaluation of the extrin-sic coagulation pathway and it is sensitive to the reduction of factor VII, but it is also prolonged on the deficiencies of factors II, V, and X, as well as in hepatic diseases and deficiency of vitamin K. It can be expressed as the INR (International Nor-malized Ratio) obtained by the relationship between the PT of the patient and the control PT, which is specific to each rea-gent or in seconds. In the present study, the PT was expres-sed in seconds, since all tests were performed on the same day with the same reagent. The aPTT evaluates the intrinsic coagulation pathway. All procoagulant factors are measured by this test, except factors VII, and XIII. The aPTT is particu-larly useful in the therapeutic monitoring of heparin and on the determination of deficiencies of factors IX and VIII. The TT measures the time of conversion of fibrinogen in fibrin, the last phase of coagulation, and it is increased in hypofibrinoge-nemia or dysfibrinogehypofibrinoge-nemia. Fibrinogen is reduced in patients with disseminated intravascular coagulation, in patients
un-dergoing large surgeries, and in patients with disseminated
neoplasias 31.
In the present study, both moderate hemodilution and profound hemodilution produced worsening of blood coa-gulation. Thrombocytopenia was observed, and in some patients the platelet count was below 50,000 per dL. An increase in PT, aPTT, and TT and reduction in the concen-tration of fibrinogen was observed. On the clinical point of view, it is not possible to say whether the changes of those exams produced any changes in the results of the surgery regarding greater intraoperative bleeding. The behavior of laboratorial exams was similar between in vivo and in vitro hemodilution, except for prothrombin time, during profound hemodilution. This behavior was surprising, since what was expected was that hemodilution in the test tube, due to the lack of compensatory mechanisms, would present largely altered results in relation to the coagulation tests of the in vivo hemodilution.
REFERÊNCIAS / REFERENCES
01. Bryson GL, Laupacis A, Wells GA – Does acute normovolemic hemo-dilution reduce perioperative allogeneic transfusion? A meta-analysis. Anesth Analg, 1998;86:9-15.
02. Goodnough LT – Acute normovolemic hemodilution. Vox Sanguinis, 2002;83(Suppl 1):211-215.
03. Crystal GJ, Salem MR – Hemodynamic compensation during acute normovolemic hemodilution. Anesthesiology, 2004;100:1034. 04. Singbartl K, Innerhofer P, Radvan J et al. – Hemostasis and
hemodi-lution: a quantitative mathematical guide for clinical practice. Anesth Analg, 2003;96:929-935.
06. Ruttmann TG, James MFM, Aronson I – In vivo investigation into the effects haemodilution with hydroxyethyl starch (200/0.5) and normal saline on coagulation. Br J Anaesth, 1998;80:612-616.
07. Jones SB, Whitten CW, Despotis GJ et al. – The influence of crys-talloid and colloid replacement solutions in acute normovolemic he-modiluton: a preliminary survey of hemostatic markers. Anesth Analg, 2003;96:363-68.
08. McLoughlin TMJ, Fontana JL, Alving B et al. – Profound normovo-lemic hemodilution: hemostatic effects in patients and in a porcine model. Anesth Analg, 1996;83:459-465.
09. Konrad C, Markl T, Schuepfer G et al. – The effects of in vitro hemodi-lution with gelatin, hydroxietyl starch, and lactated Ringer’s sohemodi-lution on markers of coagulation: an analysis using SONOCLOT. Anesth Analg, 1999;88:483-488.
10. Roche AM, James MFM, Grocott MPW et al. – Citrate blood does not reliably reflect fresh whole blood coagulability in trials of in vitro hemodilution. Anesth Analg, 2003;96:58-61.
11. Egli GA, Zollinger A, Seifert B et al. – Effect of progressive haemodi-lution with hydroxyethyl starch, gelatin and albumin on blood coagula-tion. Br J Anaesth, 1997;78:684-689.
12. Brazil EV, Coats TJ – Sonoclot coagulation analysis of in vitro haemo-dilution with resuscitation solutions. J R Soc Med, 2000;93:507-510. 13. Fries D, Innerhofer P, Klingler A et al. – The effect of the combined
administration of colloids and lactated Ringer´s solution on the coagu-lation system: an in vitro study using thrombelastograph coagucoagu-lation analysis (ROTEG). Anesth Analg, 202;94:1280-1287.
14. Gross JB – Estimating allowable blood loss: corrected for dilution. An-esthesiology, 1983;58:277-280.
15. Nelson CL, Fontenot HJ, Flahiff C et al. – An algorithm to optimize periop-erative blood management in surgery. Clin Orthop, 1998;(357):36-42. 16. Brecher ME, Rosenfeld M – Mathematical and computer modeling of
acute normovolemic hemodilution. Transfusion, 1994;34:176-179. 17. Vara-Thorbek R, Guerrero-Fernandez Marcote JA – Hemodynamic
response of elderly patients undergoing major surgery under moder-ate normovolemic hemodilution. Eur Surg Res, 1985;17:372-376. 18. Boldt J, Haisch G, Suttner G et al. – Are lactated Ringer´s solution
and normal saline solution equal with regard to coagulation? Anesth Analg, 2002;94:378-384.
19. Ng KFJ, Lam CCK, Chan LC – In vivo effect of haemodilution with saline on coagulation: a randomized controlled trial. Br J Anaesth, 2002;88:475-480.
20. Ruttmann TG, James MF, Lombard EM – Haemodilution-induced enhancement of coagulation is attenuated in vitro by restoring anti-thrombin III to pre-dilution concentrations. Anaesth Intensive Care, 2001;29:489-493.
21. Ruttmann TG, James MF, Viljoen JF – Haemodilution induces a hy-percoagulable state. Br J Anaesth, 1996;76:412-414.
22. Ruttmann TG, James MF – Pro-coagulant effect of in vitro haemodilu-tion is not inhibited by aspirin. Br J Anaesth, 1999;83:330-332. 23. Ruttmann TG, Lemmens HJ, Mallott KA et al. – The haemodilution
enhanced onset of coagulation as measured by the tromboelastogram is transient. Eur J Anaesthesiol, 2006;23:574-579.
24. Gorton H, Lyons G, Manraj P – Preparation for regional anaes-thesia induces changes in thrombelastography – Br J Anaesth, 2000;84:403-404.
25. Roche AM, James MFM, Grocott MPW et al. – Citrate blood does not reliably reflect fresh whole blood coagulability in trials of in vitro hemodilution. Anesth Analg, 2003;96:58-61.
26. Iselin MB, Willimann PFX, Seifert B et al – Isolated reduction of hae-matocrit does not com promise in vitro blood coagulation. Br J Anaes-th, 2001;87:246-249.
27. Dirkmann D, Hanke AA, Görlinger K et al. – Hipothermia and acidosis synergistically impair coagulation in human whole blood. Anesth An-alg, 2008;106:1627-1632.
28. Shaz BH, Dente CJ, Harris RS et al. – Transfusion management of trauma patients. Anesth Analg, 2009;108:1760-1768.
29. Moor P, Woolley T, Midwinter M – Coagulation tests in future studies: what to use? Br J Anaesth, 2009;102:716.
30. Horlocker TT, Nuttall GA, Dekutoski MB et al. – The accuracy of coag-ulation tests during spinal fusion and instrumentation. Anesth Analg, 2001;93:33-38.
31. Lourenço DM – Avaliação Laboratorial da Hemostasia. em: Zago MA, Falcão RP, Pasquini R – Hematologia: Fundamentos e Prática. São Paulo, Atheneu, 2001;752-754.
Resumen: Souza MAB, Klamt JG, Garcia LV – Efecto de la Hemo-dilución Normovolémica Aguda en la Coagulación Sanguínea:
Com-paración entre los Tests Recolectados en un Modelo In Vivo y en un
Modelo In Vitro.
Justificativa y objetivos: La Hemodilución normovolémica produ-ce resultados conflictivos en la hemostasia, porque los trabajos se diferencian en cuanto al tipo de líquido utilizado, profundidad de la hemodilución, método utilizado para evaluar la hemostasia y forma de producir la hemodilución. El efecto de la hemodilución en la he-mostasia puede depender de la forma como ella se realiza, si es en
el modelo in vivo o en el modelo in vitro. El objetivo de este estudio
fue evaluar y comparar la hemostasia en los dos modelos, en dos diferentes grados de profundidad.
Método: Trece pacientes se sometieron a la hemodilución normolémica aguda y el hematocrito fue reducido para 30% y 20%. La vo-lemia se mantuvo con Ringer con lactato. Se recogieron muestras de sangre para evaluación de la hemostasia en los momentos M1 (an-tes de la Hemodilución, M2 20 minutos después de la obtención del hematocrito de 30%) y M3 (20 minutos después de la obtención del hematocrito de 20%). Antes de la Hemodilución, muestras de sangre se recogieron para la realización de la Hemodilución en un tubo de
ensayo. Los grados de Hemodilución en el tubo de ensayo (in vitro)
fueron los mismos que los producidos en los pacientes (in vivo). La
hemostasia fue evaluada por medio de los tiempos de protrombina, tromboplastina parcial activado, trombina y de la cuantificación del fibrinógeno.
Resultados: El comportamiento de los tests que evaluaron la hemos-tasia fue idéntico en los dos modelos utilizados. Hubo un aumento del TP, del TTPA y del TT y una reducción de la concentración de fibrinógeno. Mientras mayor el grado de hemodilución, mayor el com-prometimiento de la coagulación.