DOI: http://dx.doi.org/10.5007/1980-0037.2016v18n2p166
Medicine ball throw test predicts arm power in
rugby sevens players
Arremesso de medicine ball prediz potência de membro
superior em jogadores de rugby sevens
Marco Aurélio Ferreira de Jesus Leite1
Jeffer Eidi Sasaki1
Camilo Luis Monteiro Lourenço1
Hugo Ribeiro Zanetti1
Lucas Gonsalves Cruz1
Gustavo Ribeiro da Mota1
Edmar Lacerda Mendes1
Abstract – he aim of this study was to develop an upper limb muscle power (PUL) prediction model using the Medicine Ball hrow Test (MBT) in rugby players. Eighteen amateur rugby players underwent the MBT test and the guided bench press exercise at 30, 40, 50 and 60% of 1. Myotest® accelerometer was positioned on the bench press bar to estimate muscle power. Linear regression was used to derive the upper limb muscle power prediction equation from the MBT distance. he residue analysis estimated the residual error of the predicted values using values obtained by Myotest®. Bland-Altman plots were used to verify agreement between actual and predicted upper limb muscle power, both in absolute Watts (W) and relative terms (W/kg of fat-free mass). here were signiicant correlations between actual and predicted upper limb muscle power (r = 0.834, 0.854, and 0.872) for intensities of 30%, 40% and 50%, respectively. Absolute bias of predicted values was -1.87 W (p <0.05). For muscle power predicted relative to fat-free mass, bias was 0.782 W/kg (p <0.05). Conclusion: he MBT test has high correlation with actual PUL values and it was found that the equation developed in this study has high accuracy to predict PUL in rugby players of both sexes.
Key words: Athletic performance; Muscle strength; Sports.
Resumo – Objetivou-se veriicar a concordância e predição da potência muscular de membros
superiores (PMS) a partir da distância do teste de Arremesso de Medicine Ball (AMB) em jo-gadores de rugby. Participaram do estudo18 jogadores amadores de rugby (11 homens) os quais realizaram o teste AMB e o exercício de supino reto na barra guiada com acelerômetro Myotest® nas intensidades de 30%, 40%, 50% e 60% de 1RM. A regressão linear foi utilizada para derivar a equação de predição da potência a partir da distância no AMB. A análise de resíduo estimou o erro residual dos valores preditos, utilizando os valores obtidos pelo Myotest® como referência. O método leave-one-out foi adotado para aferir o erro da equação em subconjuntos da amostra. O modelo de Bland-Altman veriicou a concordância entre potência predita pelo AMBe valores obtidos do Myotest® de forma absoluta Watts (W) e relativa à massa isenta de gordura (W/kg). Foram encontradas correlações signiicativas entre os métodos (r=0,834, 0872 e 0,854) para as intensidades de 30%, 40% e 50% de 1RM, respectivamente. O viés de medida na análise absoluta foi de -1,87 W (p<0,05). Na análise relativa, foi veriicado o viés de 0,782 W/kg (p<0,05). Pode-se concluir que o teste de AMB possui alta concordância com os valores reais da PMS e também veriicou-se que a equação elaborada no estudo possui alta acurácia
1 Federal University of Triangulo Mineiro. Uberaba, MG. Brazil
INTRODUCTION
Rugby is a sport practice on the rise and constitutes the third most practiced sport worldwide1, and in Brazil, rugby has gained progressive adhesion of participants of both sexes as a result of good results obtained by male and female Brazilian teams in world championships in the last2 years.
Similarly to other team sports of invasion, rugby requires wide variabil-ity of high-intensvariabil-ity motor actions3. In addition, the sport requires agility, speed, strength and muscle power, regardless of the position played in the ield4. Among physical abilities, muscular power stands out as decisive in the performance of motor gestures during a match5,6, especially in the upper limbs, as 50% of passes are of long distance7.
In general, the improvement in muscle power is subject to sports training planning, taking into account the individual strength capacity8. hus, the knowledge of training load is a necessary requirement for the development of muscle power 9,11. Given the luctuations in the capacity of individual power generation during a rugby championship, it is essential to carry out assessments of muscle power so that the best adjustments of speciic training loads are applied12.
Medicine ball throw (MBT) is the most widely known and indirect test used to evaluate the power of the upper limbs (PUL) in team sports13,14. However, the validity of the results provided by MBT to measure PUL in rugby players is unknown. herefore, the aims of this study were: a) to compare anthropometry, body composition and performance on PUL tests between sexes; b) verify the correlation of MBT testing and the bench press bar with coupled accelerometer (ABS) in obtaining PUL; c) to elaborate equation to predict the power from the MBT test distance of amateur rugby sevens players of both sexes, and d) to verify the correlation between power predicted by the equation generated and power of the accelerometer.
METHODOLOGICAL PROCEDURES
Sample selection
hirty-four amateur rugby sevens players were invited to participate in this study. Inclusion criteria were: time of practice more than eight months; absence of musculoskeletal injuries; do not use ergogenic resources and / or thermogenic foods. he non-participation in all evaluations and tests was considered an exclusion criterion. Eighteen players participated in the study (11 men and 7 women). Participants were informed of the methodological procedures and signed the free and informed consent form to participate. he study was approved by the Ethics Research Committee of the Federal University of Triangulo Mineiro (protocol No. 2382/2012).
Measurements
MBT, 1RM and ABS. Tests and evaluations were performed at the same time on day each, respecting 48-hour interval between them. Participants were instructed to keep feeding habits and avoid alcohol intake.
Anthropometry
Height was measured by stadiometer with accuracy of 1 mm (Estadiometer Personal Caprice ES2060 Sanny®, São Paulo, Brazil) and body weight was recorded with calibrated digital scale with accuracy of 0.1 kg (Wiso W939®, Florianopolis, Brazil). A caliper (Lange®, São Paulo, Brazil) was used to measure the skinfold thickness of triceps, suprailiac and thigh for women and triceps, abdomen and thigh for men, according to measurement protocol suggested by the International Society for the Advancement of Kinanthropometry. Body density was calculated using standard equation for men15 and women16, and these results were used to calculate body fat percentage using the equation of Siri17. Fat-free mass (FFM) was obtained by the diference between total body mass and fat body mass. Participants used the least amount of clothing possible during collections.
1 Repetition Maximum Test (1RM)
To evaluate the maximum strength of the upper limbs of participants and prescribe the external resistance for the ABS test, 1 MR test was performed on bench press guided bar in accordance with standardized protocol18. In addition, 2-3 series of warm-up exercises with 5-10 repetitions with ap-proximately 40-60% of the load to be tested in the 1RM test were also performed. hen, all were instructed to perform one maximum repetition. he load was adjusted to ~ 10% for subsequent attempts until participant makes one movement with proper exercise technique. Maximum muscle strength was determined with maximum number of ive attempts and intervals of 3-5 minutes of recovery between them.
Medicine Ball Throw Test (MBT)
he procedures adopted for the MBT test followed protocol proposed by Vossen et al.19. For the test, the participant remained sat on a bench (with adjustable height) stabilized on the ground with the back supported against the vertical back support with thighs horizontally supported, knees lexed at an angle of 90° and ankles ixed the ground. Participants were aixed to the seat with elastic straps placed around the trunk at the level of the mid chest under the armpit. his position was standardized in all throws to ensure greater stability and minimize movements of the trunk during performance.
performed three throws, with ive-minute break between them and, for analysis, the best result among attempts was considered.
Throw of the bench press bar with coupled accelerometer (ABS)
PUL was measured by the Myotest® triaxial accelerometer (model S4P, Sion, Switzerland) in the bench press exercise with guided bar according to assessment procedures proposed by Comstock et al.20. he device was placed on the bar between the shoulder and thumb of the right hand, and held upright. Myostest measures power through estimated speed variation applied force and torque (concentric phase), considering the movement runtime.
Using 30%, 40%, 50% and 60% of 1RM test, participants performed three consecutive repetitions for each intensity, with passive break of ive minutes between each intensity. Participants were instructed to hold the bar about 2-3 cm above the chest level (starting position of the movement) and, after audible signal emitted by the accelerometer, they pushed the bar upward at full speed up to full extension of the elbow.
he largest power value recorded in each of three attempts of each intensity percentage was used to calculate the average power of each par-ticipant. he mean power of each participant was calculated considering the absolute power in Watts (W) of the highest peak intensities tested (30% + 40% + 50% + 60% 1RM / 4).
Data analysis
the GraphPadPrism Software® 6.0 Inc. (California, USA). Signiicance level of 5% was adopted for all analyses.
RESULTS
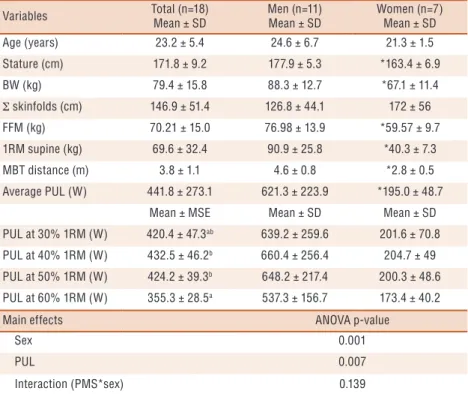
Anthropometric characteristics, body composition and performance on PUL tests are shown in Table 1. Women had lower (p <0.05) stature, BW, FFM, 1RM, MBT distance and average PUL compared to men. ANOVA revealed signiicant main efect of gender [F(1,17) = 29.83; p <0.001, efect size = 0.637] and power [F(1,17) = 5.981; p = 0.007, efect size = 0.260]. PUL at 60% of 1RM was lower compared to 40% and 50% of 1RM, but not in relation to 30% of 1RM. here was no signiicant diference among PUL at 30%, 40% and 50% of 1RM. here was no interaction efect [F(1,17) = 2.112; p <0.139, efect size = 0.111].
Table 1. Anthropometry, body composition and performance on PUL tests in rugby sevens players
according to sex
Variables Total (n=18)
Mean ± SD
Men (n=11) Mean ± SD
Women (n=7) Mean ± SD
Age (years) 23.2 ± 5.4 24.6 ± 6.7 21.3 ± 1.5
Stature (cm) 171.8 ± 9.2 177.9 ± 5.3 *163.4 ± 6.9
BW (kg) 79.4 ± 15.8 88.3 ± 12.7 *67.1 ± 11.4
Σ skinfolds (cm) 146.9 ± 51.4 126.8 ± 44.1 172 ± 56
FFM (kg) 70.21 ± 15.0 76.98 ± 13.9 *59.57 ± 9.7
1RM supine (kg) 69.6 ± 32.4 90.9 ± 25.8 *40.3 ± 7.3
MBT distance (m) 3.8 ± 1.1 4.6 ± 0.8 *2.8 ± 0.5
Average PUL (W) 441.8 ± 273.1 621.3 ± 223.9 *195.0 ± 48.7
Mean ± MSE Mean ± SD Mean ± SD
PUL at 30% 1RM (W) 420.4 ± 47.3ab 639.2 ± 259.6 201.6 ± 70.8
PUL at 40% 1RM (W) 432.5 ± 46.2b 660.4 ± 256.4 204.7 ± 49
PUL at 50% 1RM (W) 424.2 ± 39.3b 648.2 ± 217.4 200.3 ± 48.6
PUL at 60% 1RM (W) 355.3 ± 28.5a 537.3 ± 156.7 173.4 ± 40.2
Main effects ANOVA p-value
Sex 0.001
PUL 0.007
Interaction (PMS*sex) 0.139
* significant difference (p <0.05) between sexes by Student t test; BW = body weight; FFM = fat free mass; Σ SF = sum of skin folds; MBT = medicine ball throw; PUL = power of the upper limbs; SD = standard deviation; SEM = standard error of the mean; ab significant difference after Bonferroni
adjustment for multiple comparisons.
here was a positive and strong correlation between PUL at intensities of 30%, 40% and 50% of 1RM and the distance from the MBT (Table 2).
Table 2. Correlation between distance of the medicine ball throw and power in the bench press bar with coupled accelerometer with different intensities of 1RM
Variables Power at 30%
1RM
Power at 40% 1RM
Power at 50% 1RM
Throw distance MB 0.834* 0.872* 0.854*
Power at 30% 1RM 0.970* 0.982*
Power at 40% 1RM 0.972*
Pearson correlation test: RM = repetition maximum; MB = medicine ball; * (P <0.01).
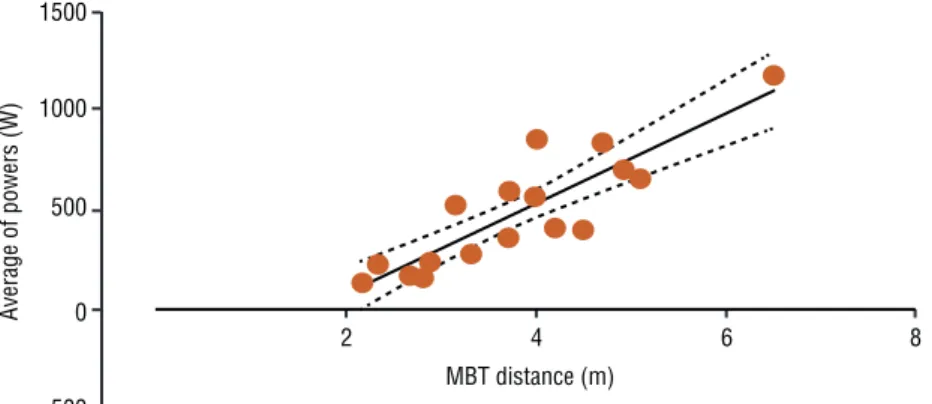
Figure 1. Linear regression of the average of powers and medicine ball throw.
Linear regression test: MBT = medicine ball throw; r = 0.881; r² = 0.776 (p <0.01).
he following equation proposes predicting PUL based on the MBT distance and sex:
PUL (watts) = -17,897 + (182,025 * AMD) + (1134,563 * sex)
Where: PUL = power of the upper limbs; AMD = medicine ball throw distance in meters; Sex, male = 1; female = 2
here was no diference between averages of powers obtained by the Myostest® accelerometer and power predicted by the equation (p <0.05).
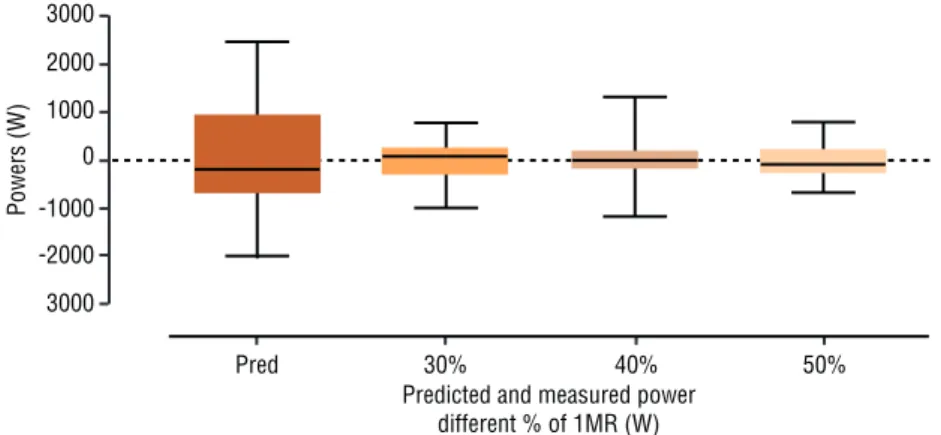
he residue analysis was applied among values of powers at 30%, 40% and 50% of 1RM and the average value predicted by the equation. he results demonstrate that the average distance of various points analyzed and it line based on the residual error are low (p <0.01) (Figure 2).
Figure 2. Residue analysis of power values obtained by equation (Pred) and measured at Myostest® in different percentages of 1RM. Pred (r² = 0.796); 30% of 1RM (r² = 0.983); 40% of 1RM (r² = 0.976); 50% of 1RM (r² = 0.984); MB = medicine ball; All variables were significant (p <0.01); The predictive model obtained correlations of r = 0.868, r = 0.902, r = 0.885 respectively at intensities of 30%, 40% and 50% of 1RM. The residual error was ± 99.5 W.
Figure 3. A. Bland-Altman analysis between power predicted by the equation and power of the
accelerometer in absolute terms to body weight; B. Bland-Altman test between power predicted by the equation and power of the accelerometer in relative terms to the fat-free mass (W / kg); Ppred: Power predicted by the equation; Pmed: Power measured by the accelerometer; The axis of ordinates denotes overestimated and underestimated values of the prediction and the axis of abscissa refers to the average between Ppred and Pmed values.
In the ICC analysis, it was found that power predicted by equation exhibited high reliability among individuals (ICC: 0.861; p <0.01), calcu-lated based on powers developed at diferent percentages of 1RM.
DISCUSSION
with PUL obtained by accelerometry. In addition, the equation proposed from the distance (m) of the MBT test proved to be useful to quantify absolute and relative power to fat-free mass (W / kg) for both sexes. he MBT test is an eicient tool for coaches of rugby sevens players due to its easy application, accessibility and low cost.
he equation was developed taking into account only the mean PUL value at 30%, 40% and 50% of 1RM, the distance reached in the MBT test and sex. he higher the concentric muscle action speed, the lower the resistance that counteracts the movement and the greater the resistance to be overcome, the lower the speed achieved 23. hus, strong players de-velop more power at higher loads, while faster ones dede-velop more power at lower loads24. In this study, the peak power was tested at intensities of 30%, 40%, 50% and 60% of 1RM in order to meet individual diferences. Intensity of 60% of 1RM was not used in the development of the equation because it showed the lowest PUL compared to 40 and 50% of 1RM, but not over 30% of 1RM. On the other hand, there was no diference for PUL at intensities of 30%, 40% and 50% of 1RM, which possibly present value closer to the actual maximum power to be used in further analysis. he diference of PUL between sexes justiies the consideration of sex proposal by the equation.
In the study of Cormie et al.10 conducted with trained athletes, it was observed that loads ranging from 27% to 42% of 1RM produced major powers in squat jump and squat exercises. he wide range of 1RM intensity reported to obtain the peak power can induce the development of train-ing sessions that do not meet the principle of speciicity and thus result in failure to achieve the expected explosive force result. In this sense, we adopted the value of the average of powers of the variable load protocol in order to identify the most accurate corresponding intensity in predicting the highest peak power in rugby sevens players.
he power values estimated by the equation were strongly correlated with powers measures at 30%, 40%, 50% of 1RM measured by Myotest® accelerometer, r = 0.868, r = 0.902, r = 0.885, respectively. Furthermore, there was no diference between power predicted by the equation and the average of measured powers, i.e., the equation seems to be valid for quan-tifying the power from the MBT distance, regardless of intensity (load) applied in the test (30 %, 40% and / or 50% of 1RM). he residual error obtained by the root mean square error (RMSE) was only ± 99.5 watts compared the average value of measured powers, namely the elaborate equation has low estimates of underestimating or overestimating the real PUL values of rugby sevens players.
However, both the prediction of power in absolute terms to body mass as the equation adjusted for fat-free mass (W / kg), it was possible to identify good agreement to the direct test and also low errors in the estimation of PUL using accelerometer (absolute bias: -0.001 W; relative bias: 0.06 W). here was no signiicant diference between absolute and relative prediction because sex diferences were considered in the equation itself.
Previous studies have described equations for power prediction29,30, especially for lower limbs. Harman et al.29 developed lower limb predic-tion equapredic-tion (MMII) from the height reached by vertical jump vs. values obtained by the jump test on the force platform as a reference. Lara et al.30 developed the equation for predicting power of the lower limbs using the same methodology, comparing with results with other equations and concluded that the developed equation was more eicient for predicting power of lower limbs in the research sample. Although this study has adopted similar methodology for power prediction, the comparability of results is limited, since both studies mentioned above used MMII as target muscles, while this study used upper limbs.
To our knowledge, this is the irst study to propose predictive equation of PUL for rugby sevens players. herefore, the leave-one-out method (cross-validation) was use to verify the accuracy and precision of the model developed. Adopting this cross validation method, the equation proposed is less likely to show discrepant actual power values.
his study has some limitations. First, the lack of standardization of the angle of evaluated limbs during indirect MBT test may have inluenced the distance achieved by the medicine-ball; however, although MBT test does not adopt a standard regarding the angle of elbows, we adopted the throw of the medicine ball in front of the sternum, and in the case of non-compliance, the attempt was rejected. Second, sample size is relatively low, which can reduce the statistical power of results; however, the number of participants of each sex in this sample is the reality a rugby sevens team. Moreover, this study adds to rugby a simple and inexpensive tool which uses the MBT distance test for accurate prediction of PUL. Using this equation will enable monitoring the PUL development throughout the season in order to allow adjustments of the team or individual training. Although the MBT test is widely used to predict PUL, future studies should be focused on the validation of equations from tests that simulate speciic motor actions of the sport, for example, a medicine-ball throw test in simulation to lateral pass.
CONCLUSION
REFERENCES
1. Freitag A, Kirkwood G, Scharer S, Ofori-Asenso R, Pollock AM. Systematic review of rugby injuries in children and adolescents under 21 years. Br J Sports Med 2015;49(8):511-9.
2. Confederação Brasileira de Rugby. Página Oicial da Confederação Brasileira de Rugby 2015. Available from: <http://www.sharklion.com/proyectos/cbru/main/ content.php?page=8> [2015 jan 15].
3. Johnston RD, Gabbett TJ, Jenkins DG. Applied sport science of rugby league. Sports Med Auckl NZ 2014;44(8):1087-100.
4. Alves LM, Soares RP, Liebano RE. Incidência de lesões na prática do rúgbi amador no Brasil. Fisioter Pesqui 2008;15(2):131-5.
5. Biscombe T, Drewett P. Rugby. New Zealand: Human Kinetics; 2010.
6. Bevan HR, Cunningham DJ, Tooley EP, Owen NJ, Cook CJ, Kilduf LP. Inlu-ence of postactivation potentiation on sprinting performance in professional rugby players. J Strength Cond Res Natl Strength Cond Assoc 2010;24(3):701-5.
7. Vaz L, Rooyen MV, Sampaio J. Rugby Game-Related Statistics that Discriminate Between Winning and Losing Teams in Irb and Super Twelve Close Games. J Sports Sci Med 2010;9(1):51-5.
8. Dantas EHM. A Prática da preparação física. Rio de Janeiro: Shape; 2003.
9. Aşçi A, Açikada C. Power production among diferent sports with similar maxi-mum strength. J Strength Cond Res Natl Strength Cond Assoc 2007;21(1):10-6.
10. Cormie P, McBride JM, McCaulley GO. Validation of power measurement tech-niques in dynamic lower body resistance exercises. J Appl Biomech 2007;23(2):103-18.
11. Santos EJAM, Janeira MAAS. Efects of complex training on explosive strength in adolescent male basketball players. J Strength Cond Res Natl Strength Cond Assoc 2008;22(3):903-9.
12. Hoble LD, Avram C. Strength, power and opto-acoustic reaction during of-season period in professional rugby players. J Phys Educ Sport 2012;12(1):9.
13. Leite GS, Prestes J, Urtado CB, Marchetti PH, Padovani CR, Padovani CRP, et al. Objective and subjective variables for monitoring of diferent season cycles in basketball players. Rev Bras Med Esporte 2012;18(4):229-33.
14. Manske R, Reiman M. Functional Performance Testing for Power and Return to Sports. Sports Health 2013;5(3):244-50.
15. Jackson AS, Pollock ML, Ward A. Generalized equations for predicting body density of men. Br J Nutr 1978;40(3):497-504.
16. Jackson AS, Pollock ML, Ward LC. Generalized equation for predicting body density of women. Med Sci Sports Exerc 1980;12(3):175-81.
17. Siri WE. Body composition from luid spaces and density: analysis of methods. Brozek J, Henschel, editor. Techniques for measuring body composition. Wash-ington National Academy of Science, 1961;223-244.
18. Brown LE, Weir JP. ASEP Procedures recommendation I: accurate assessment of muscular strength and power. J Exerc Physiol online 2001;4(11):1-21.
19. Vossen JF, Kramer JE, Burke DG, Vossen DP. Comparison of dynamic push-up training and plyometric push-up training on upper-body power and strength. J Strength Cond Res 2000;14(3):248-53.
20. Comstock BA, Solomon-Hill G, Flanagan SD, Earp JE, Luk H-Y, Dobbins KA, et al. Validity of the Myotest® in measuring force and power production in the squat and bench press. J Strength Cond Res Natl Strength Cond Assoc 2011;25(8):2293-7.
21. Dancey CP RJ. Estatística sem matemática para psicologia: usando SPSS para Windows. Porto Alegre: Artmed; 2006.
22. Cawley GC, Talbot NL. Eicient leave-one-out cross-validation of kernel Fisher discriminant classiiers. Pattern Recognit 2003;36(11):2585-92.
CORRESPONDING AUTHOR
Edmar Lacerda Mendes Departamento de Ciências do Esporte.
Av. Getúlio Guaritá, 159. Centro Educacional, Sala 333, Abadia.
CEP 38025-440 - Uberaba, MG. Brasil
E-mail: [email protected]
24. Fleck SJ, Kraemer WJ. Fundamentos do treinamento de força muscular. Porto Alegre: ArtMed; 2006.
25. Gabbett T. Incidence, site, and nature of injuries in amateur rugby league over three consecutive seasons. Br J Sports Med 2000;34(2):98-103.
26. Gabbett T. A comparison of physiological and anthropometric characteristics among playing positions in junior rugby league players. Br J Sports Med 2005; 39(9):675-80.
27. Gabbett TJ. Science of rugby league football: a review. J Sports Sci 2005;23(9):961-76.
28. Nikolaidis PT. Association between body mass index, body fat per cent and muscle power output in soccer players. Cent Eur J Med 2012;7(6):783-9.
29. Harman EA, Rosenstein MT, Frykman PN, Rosenstein RM, Kraemer WJ. Estimation of human power output from vertical jump. J Strength Cond Res 1991;5(3):116-20.