1
Universidade Estadual de Campinas, Faculdade de Ciências Médicas, Departamento de Saúde Coletiva. R. Tessália Vieira de Camargo, 126, Cidade Universitária Zeferino Vaz, 13083-887, Campinas, SP, Brasil. Correspondência para/Correspondence to: D ASSUMPÇÃO. E-mail: <[email protected]>.
2
Universidade Federal de São Paulo, Curso de Nutrição, Departamento de Saúde, Clínica e Instituições. Santos, SP, Brasil. 3
Universidade de São Paulo, Faculdade de Saúde Pública, Departamento de Nutrição. São Paulo, SP, Brasil.
Support: Conselho Nacional de Desenvolvimento Científico e Tecnológico (Process nº 409747/2006-8); Secretaria Municipal de Saúde de Campinas; Secretaria de Vigilância em Saúde do Ministério da Saúde; Coordenação de Aperfeiçoamento de Pessoal de Nível Superior.
Social and demographic inequalities in
diet quality in a population-based study
Desigualdades sociais e demográficas na qualidade
da dieta em estudo de base populacional
Daniela de ASSUMPÇÃO1
Semíramis Martins Álvares DOMENE2
Regina Mara FISBERG3
Marilisa Berti de Azevedo BARROS1
A B S T R A C T
Objective
To evaluate sociodemographic inequalities in the diet quality of the urban population of the city of Campinas,
São Paulo, Brazil.
Methods
A population-based, cross-sectional study was performed using data from a health survey conducted in the city of Campinas in 2008-2009. Diet quality was evaluated using the Brazilian Healthy Eating Index Revised. A total of 3,382 individuals aged 10 years old and older were analyzed.
Results
Brazilian Healthy Eating Index Revised scores increased with age and education level. Women consumed more vegetables, fruits, and milk, and less sodium, meat and eggs, oils, saturated and solid fats, alcohol, and added sugars than men. Scores for whole grains, vegetables, and fruits also increased with age and education level.
Conclusion
These findings point to sociodemographic segments that are more vulnerable to an inappropriate diet and identify the need of strategies to increase the consumption of whole grains, dark green vegetables, fruits, and milk, and decrease the consumption of sodium, solid fats, alcohol, and added sugar.
R E S U M O
Objetivo
Avaliar as desigualdades sociodemográficas na qualidade da alimentação da população urbana do município de Campinas, São Paulo.
Métodos
Trata-se de estudo transversal de base populacional que utilizou dados de inquérito de saúde realizado em Campinas entre os anos de 2008 e 2009. A qualidade da alimentação de 3.382 indivíduos com 10 anos de idade ou mais foi avaliada pelo Índice de Qualidade da Dieta Revisado. Foram estimadas as médias do Índice de Qualidade da Dieta Revisado global e de cada componente segundo as variáveis independentes.
Resultados
O escore total do Índice de Qualidade da Dieta Revisado aumentou com o crescimento da idade e do nível de escolaridade. As mulheres consumiram mais vegetais, frutas e leite, e ingeriram menos sódio, carnes e ovos, óleos, gorduras saturada e sólida, álcool e açúcar de adição, quando comparadas aos homens. Com o avanço da idade e da escolaridade observou-se pontuações mais elevadas de cereais integrais, vegetais e frutas.
Conclusão
Os achados apontam os segmentos sociodemográficos mais vulneráveis à alimentação inadequada e identificam a necessidade de estratégias para aumentar o consumo de cereais integrais, vegetais verdes escuros e alaranjados, frutas e leite, e diminuir o consumo de sódio e de gorduras sólidas, álcool e açúcar de adição.
Palavras-chave: Comportamento alimentar. Consumo de Alimentos. Desigualdades em Saúde. Inquéritos epidemiológicos.
I N T R O D U C T I O N
An unhealthy diet is one of the four main behavioral risk factors related to the epidemic of Non-Communicable Chronic Diseases (NCD)1. In
Brazil NCD accounted for 70% of the total mortality in 20122. Facing these diseases is a public
health priority, recognized by the definition of a national action plan that aims, among others, to reduce average salt intake and increase fruit and vegetable intakes1.
In the context of NCD prevention, healthy eating promotion represents a fundamental necessary strategy involving actions that cover different life stages3. A review study has shown
that over 90% of type 2 diabetes, 80% of heart disease, and 70% of stroke and colon cancer cases could be prevented by a healthy diet combined with other healthy behaviors, such as not smoking, not abusing alcohol, as well as being physically active and maintaining a normal body weight4.
Brazilian studies have pointed out some differences in the dietary patterns of different
demographic and social subgroups of the population. As age increases, the participation of fruits, vegetables, skim milk, and whole wheat bread in the diet is likely to increase, while the intake of sugary drinks, snacks, and sandwich cookies tends to decrease5. High sodium intake and inadequate
calcium and vitamin A, C, and E intakes affect all demographic segments above 10 years of age. In addition the sodium intake of over 70% of the urban population exceeds the tolerable upper intake level6-8. A study with adolescents
demonstrates higher consumption of candy, processed meat, and cookies in girls, and milk and soft drinks in boys9. Adult women eat more
fruits and vegetables and less soft drinks and fatty meats than men10. Higher education levels and
income lead to both a higher intake of healthy foods, such as fruits, vegetables, and milk, and a higher intake of unhealthy foods, such as soft drinks, pre-packaged meals, cookies, and processed meats9-11.
to unhealthy eating and to direct appropriate actions to vulnerable groups. The Brazilian Healthy Eating Index - Revised (BHEI-R)12 is an adapted
tool of the Healthy Eating Index - 2005 (HEI-2005)13
that permits the diagnosis and monitoring of the overall quality of the diet according to nutritional recommendations. The BHEI-R is represented by a set of component-based foods, nutrients, and cooking ingredients with proven health implications, such as whole grains, unsaturated fats, fruits, and sodium14. The BHEI-R was
considered a valid and reliable instrument to asses and monitor the diet quality of the Brazilian population15.
Recognizing the importance of food quality in health promotion and disease prevention, the need to identify the dietary patterns in population subgroups from different country regions, and in view of the diversity of food habits, the objective of this study was to evaluate the sociodemographic inequalities in the quality of the diet of the urban population from the city of
Campinas (SP), Brazil.
M E T H O D S
This is a cross-sectional, population-based study based on data from the Inquérito de Saúde
de Campinas (ISACamp, Health Survey of
Cam-pinas), which collected information from
non-institutionalized individuals living in the urban area of the city of Campinas between February 2008 and April 2009.
The survey sample was determined by probabilistic sampling procedures via two-stage clustering. In the first stage, 50 census sectors were drawn with probability proportional to size (number of households). Considering the time elapsed since the Population Census of 2000, the addresses of the selected sectors were updated. The second stage involved a random selection of households.
The population was divided into three age groups, constituting the age domains: adolescents (10-19 years), adults (20-59 years) and older adults
(60 and over). Independent samples of 1,000 people in each domain were selected considering the maximum variability to the frequency of events studied (p=0.50), 95% confidence interval, sampling error between 4 and 5 percentage points, and a design effect of 2. To achieve the desired sample size considering 20% of non-response, 2,150, 700, and 3,900 households were drawn for interviews with adolescents, adults and older adults, respectively. Thereby, the 2,150 households sampled for interviews with adolescents would guarantee the minimum number of people in this age group. The calculation of the number of households was based on the people/household ratio for each age domain.
The sample is representative of the population
of Campinas regarding its demographic and
socioeconomic characteristics, and its design was based on the age domains for which the minimum numbers were drawn. Further details on the sample design are found in Alves16.
Information was collected in the household through a questionnaire structured in 14 thematic blocks, tested in a pilot study, and administered by trained and supervised interviewers. The thematic group on food habits included the 24-Hour Dietary Recall (24HR) in which respondents reported all foods and beverages consumed the day before the interview. The 24HR was conducted on different days of the week and months of the year17.
Depending on the component scores can range from zero (minimum) to 5, 10, or 20 (maximum) as assigned (Chart 1). The minimum score is represented by zero consumption of components 1-9 or consumption above the recommendations for components 10 through 12, while the maximum score for each component is established when it reaches or exceeds the recommended intake. Intakes between the minimum and maximum standards are scored proportionately. The Total BHEI-R is the sum of the scores of the components and can reach up to 100 points.
The Brazilian Healthy Eating Index Revised was calculated based on information obtained by the 24HR recall. During the field work, the content of the recalls was thoroughly checked by a dietician to identify and correct any administration mistakes. The 24HR were quantified to convert household measures of the food preparations into grams or milliliters. For this purpose, information available from household measurement tables18,19,
food labels, and customer services were used.
The dietary food intake information was calculated by the software Nutrition Data System for Research version 2007 (NCC Food and Nutrient Database, Minneapolis Minnesota, United States).
Data consistency analysis consisted of verifying the 24HRs that had a total energy value below 800 kcal or above 3,500 kcal.
Like the Healthy Eating Index - 2005, the BHEI-R uses energy from legumes to complete the total score component of meat and eggs if the consumption of these foods is inadequate. When the score of meat and eggs is met and there is still energy remaining from the legumes, the surplus is transferred to the total vegetables and dark green and orange vegetable components, respectively. For these reasons, the legumes were excluded from the BHEI-R calculation in this study.
The sociodemographic variables analyzed in this study were gender, age, and education level of the household head (years of formal education).
The means of total BHEI-R and of each component were estimated and the differences between the means of sociodemographic subgroups were obtained by linear regression at a level of 5% significance for associations with the variables analyzed. The mean values of total BHEI-R were adjusted for sex and/or age, as well as total energy in the diet (kcal). The mean BHEI-R component scores were adjusted by kcal. The relative percentage of the maximum score for each BHEI-R component was calculated to present the results in a picture format.
Chart 1.Scoring criteria of Brazilian Healthy Eating Index Revised (BHEI-R) components.
01. Total fruit*
02. Whole fruit
03. Total vegetables
04. Dark green and orange vegetables
05. Total grains
06. Whole grains
07. Milk and dairy products
08. Meat and eggs#
09. Oils** 10. Saturated fat 11. Sodium 12. Gord_AA BHEI-R Total
0 to 5 0 to 5 0 to 5 0 to 5 0 to 5 0 to 5 0 to 10 0 to 10 0 to 10 0 to 10 0 to 10 0 to 20 0 to 100
No consumption No consumption No consumption No consumption No consumption No consumption No consumption No consumption No consumption ≥15% of TEV ≥2.0 g/1,000 kcal
≥35% of TEV
1.0 serving/1,000 kcal 0.5 serving/1,000 kcal 1.0 serving/1,000 kcal 0.5 serving/1,000 kcal 2.0 servings/1,000 kcal 1.0 serving/1,000 kcal 1.5 serving/1,000 kcal 1.0 serving/1,000 kcal 0.5 serving/1,000 kcal ≤7% of TEV ≤0.75 g/1,000 kcal
≤10% of TEV
Note: *Represent the consumption of fruits as natural juice; **Include nuts and fish; #Legumes were excluded from this component. Source:
Previdelli et al.12.
TEV: Total Energy Value; Gord_AA: Gordura Sólida, Alcool e Açúcar de Adição.
The interviews were entered into the database using EpiData 3.1 (EpiData Association, Odense, Denmark) and statistical analyses were made in the svy module of Stata 11.0 (Stata Corporation, College Station, Texas, United States), which allows the analysis of data from a complex sample.
The study design was approved by the Research Ethics Committee of the Universidade
Estadual de Campinas in addendum to the Opinion
nº 079/2007.
R E S U L T S
From the total of 3,405 interviews, 23 were excluded due to non-completion of the 24HR. Thus, 3,382 subjects were evaluated, with a mean age of 14.1 years (95% Confidence Interval-95%CI=13.8-14.4) for adolescents, 37.4 years (95%CI=36.6-38.3) for adults, and 70.0 years (95%CI=69.3-70.6) for older adults.
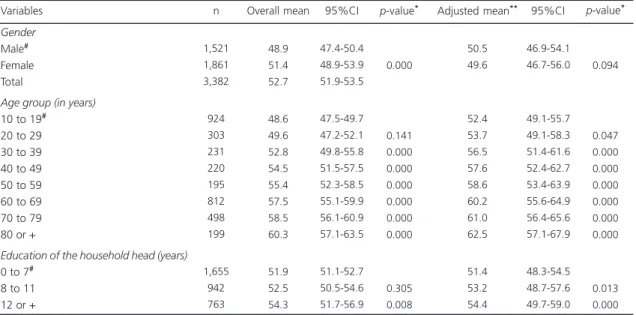
Analyses of total BHEI-R revealed gradual increase in diet quality scores with advancing age
and education level of the household head (Table 1).
The Brazilian Healthy Eating Index Revised components with the worst scores were whole grains, sodium, dark green and orange vegetables, total fruit, whole fruit, and milk and dairy products, as well as the one that assesses the energy percentage from Gord_AA. The best scores were found in the groups total grains, meat and eggs, and oils (Figure 1).
Women had higher scores than men for total vegetables, dark green and orange vegetables, total fruit, whole fruit, dairy products, and sodium components, while for meat and eggs, oils, saturated fats, and Gord_AA the opposite happened (Table 2).
With increasing age, there was a gradient of score improvement for whole grains, total vegetables, dark green and orange vegetables, total fruit, whole fruit, oils, Gord_AA, and worsening scores for sodium. Compared with adolescents, adults had lower scores for dairy products and higher scores for meats and eggs (Table 2).
Table 1. Crude and adjusted mean total Brazilian Healthy Eating Index Revised (BHEI-R) by social and demographic variables. Health Survey of Campinas (SP), Brazil, 2008.
Gender
Male# Female Total
Age group (in years)
10 to 19# 20 to 29 30 to 39 40 to 49 50 to 59 60 to 69 70 to 79 80 or +
Education of the household head (years)
0 to 7# 8 to 11 12 or + Variables
1,521 1,861 3,382
924 303 231 220 195 812 498 199
1,655 942 763
48.9 51.4 52.7
48.6 49.6 52.8 54.5 55.4 57.5 58.5 60.3
51.9 52.5 54.3
47.4-50.4 48.9-53.9 51.9-53.5
47.5-49.7 47.2-52.1 49.8-55.8 51.5-57.5 52.3-58.5 55.1-59.9 56.1-60.9 57.1-63.5
51.1-52.7 50.5-54.6 51.7-56.9
0.000
0.141 0.000 0.000 0.000 0.000 0.000 0.000
0.305 0.008
50.5 49.6
52.4 53.7 56.5 57.6 58.6 60.2 61.0 62.5
51.4 53.2 54.4
46.9-54.1 46.7-56.0
49.1-55.7 49.1-58.3 51.4-61.6 52.4-62.7 53.4-63.9 55.6-64.9 56.4-65.6 57.1-67.9
48.3-54.5 48.7-57.6 49.7-59.0
0.094
0.047 0.000 0.000 0.000 0.000 0.000 0.000
0.013 0.000
n Overall mean 95%CI p-value* Adjusted mean** 95%CI p-value*
Segments with higher education levels had a higher mean score for whole grains, total vegetables, dark green and orange vegetables, total fruit, whole fruit, and dairy products, but lower mean for saturated fat. Regarding the reference category, the stratum with 12 or more years of formal education had significantly lower scores for total grains, oils, and Gord_AA, and higher scores for sodium (Table 2).
D I S C U S S I O N
In the present study, diet quality did not differ by gender after adjusting for energy. North American studies have found higher diet quality among women20,21. In Brazil studies that evaluated
diet quality using the HEI or BHEI-R have found worse eating habits in adolescents22,23 and adult
females24. The fact that females have better diet
quality could be the result of several factors, such as increased attention to health and signs of disease, increased concern with body image, the role of being the family caregiver and generally having the responsibility of selecting and preparing meals, as well as the lower consumption of food away from home25,26; women also have
more careful attitude towards their health than men27,28.
Figure 1. Percentage of the mean score of each component of Brazilian Healthy Eating Index Revised (BHEI-R) in regards to its maximum value. Health Survey of Cam-pinas (SP), Brazil, 2008.
Note: Gord-AA: Gordura Sólida, Alcool e Açúcar de Adição.
The increase in diet quality scores with advancing age has also been observed by other authors20,21. A North American study found a
difference of 9.6 points in the HEI-2005 score among individuals aged between 20 and 39 years and 60 years or more20, similar to the 11.3 points
found in the present study. The positive influence of age on food quality may result from the occurrence of chronic diseases and comorbidities that increase greatly throughout life25. The impact
of disease on health status tends to increase the number of visits to health services and better expose patients to health care guidelines, which encourages and pushes the individual to adhere to a treatment where healthy eating is a fundamental component29. The association between aging and
better diet quality can also result from effects of the birth cohort. The eating habits of today’s older adults was formed at a time when meals were often prepared at home, where there was not a wide availability of pre-packaged meals, nor a high variety of restaurants and diners with a delivery service, in addition to the industry’s appeal with advertisement so people incorporate the idea of convenience and time saving when preparing their food. Nowadays, exposure to poor food quality happens quite early in life. The National Demographic and Health Research (2006-2007) detected a high percentage of children aged 6-59 months who were already eating cookies (46.3%), soft drinks (22.1%), and sweets (21.4%) on a daily basis30. Therefore, the best current
quality attributed to the diet of older adults can partly stem from a difference in generation.
Individuals with the highest education levels also had the highest Brazilian Healthy Eating Index Revised scores. Ervin20 and Hiza et al.21
reported higher overall diet quality scores in adults with college degrees. Even if still inadequate, individuals with higher education levels ate more fruits, vegetables, milk, and whole grains, leading to better diet quality. However, this segment also presented greater intake of saturated fats. BHBS 2008-2009 data has shown that household purchases of fruits and vegetables increase with
93,4
4,4 58,2
27,6
36,8 39,2 43,4 82,4 86,3
23,4 62,8
49,7 100
90 80 70 60 50 40 30 20 10 0
Tota l gra
ins
Who le g
rain s
Tota l veg
etab les
Dar k gr
een and
oran ge...
Tota l fru
it
Who le fr
uit
Milk and
dai ry p
rodu cts
Mee ts a
nd e ggs Oils
Sodí um
Satu rate
d fa t
Gor d_A
A
Component s of BHEI-R
income per capita, along with soft drinks, pre-packaged meals, condiments, and animal fats11. These results reveal social inequality in
eating habits, analyzed both by income usage as
a marker for socioeconomic level and access to purchases, as well as by education level, which is an indicator of acquired knowledge that would facilitate adherence to a healthier lifestyle. Table 2. Mean score of each Brazilian Healthy Eating Index Revised (BHEI-R) component according to sex, age group, and education
level of the household head. Health Survey of Campinas (SP), Brazil, 2008.
Total grains Whole grains Total vegetables
Dark green and orange vegetables Total fruit
Whole fruit
Milk and dairy products Meats and eggs Oils Sodium Saturated fat Gord_AA Total grains Whole grains Total vegetables
Dark green and orange vegetables Total fruit
Whole fruit
Milk and dairy products Meats and eggs Oils Sodium Saturated fat Gord_AA Total grains Whole grains Total vegetables
Dark green and orange vegetables Total fruit
Whole fruit
Milk and dairy products Meats and eggs Oils Sodium Saturated fat Gord_AA 4.67 0.22 2.90 1.38 1.84 1.96 4.34 8.24 8.63 2.34 6.28 9.94 04.97 00.22 03.06 01.17 01.51 01.37 02.96 08.47 09.95 00.37 08.41 14.90 07.90 00.27 03.33 01.48 02.00 01.91 03.76 08.09 09.55 00.94 07.87 14.17
BHEI-R Components Total
Overall mean
Gender
Male (1) Female (2)
0.083 0.065 0.005 0.005 0.000 0.000 0.000 0.003 0.046 0.000 0.000 0.015
p-value* (2)-(1)
Age group (in years)
10 to 19 (1) 4.96 0.16 2.97 1.11 1.91 1.74 4.85 7.58 8.73 1.82 7.20 11.55
20 to 59 (2)
4.82 0.30 3.57 1.76 2.28 2.18 4.16 7.92 9.32 1.36 7.44 13.27
60 or + (3)
4.84 0.43 3.80 1.98 3.01 3.10 4.92 7.47 9.21 1.36 7.49 15.23
p-value* (2)-(1)
0.002 0.000 0.000 0.000 0.008 0.004 0.000 0.002 0.000 0.001 0.249 0.000
p-value* (3)-(1)
0.000 0.000 0.000 0.000 0.000 0.000 0.701 0.434 0.004 0.000 0.145 0.000
Education of the household head(in years)
0 to 7 (1)
04.89 00.19 03.13 01.38 02.11 02.09 03.79 07.92 09.37 01.18 07.93 14.12
8 to 11 (2)
04.88 00.28 03.86 01.88 02.43 02.42 04.34 07.82 09.41 01.37 07.23 13.33
12 or + (3)
4.69 0.58 4.12 2.26 3.04 2.89 5.71 7.55 8.77 1.87 6.63 12.76
p-value* (2)-(1)
0.895 0.011 0.000 0.000 0.015 0.019 0.018 0.535 0.820 0.159 0.006 0.076
p-value* (3)-(1)
0.002 0.000 0.000 0.000 0.000 0.001 0.000 0.076 0.020 0.003 0.000 0.005
Note: *Value of p<0.05. Adjusted mean by diet calories. (1) Category used as reference; (2)-(1) Category 2 in relation to 1; (3)-(1) Category 3 in
relation to 1.
The growth of the Brazilian economy allowed the socially excluded segments to purchase processed products, whereas before, only groups with high socioeconomic levels were able to purchase them. In European countries, the highest socioeconomic segment, defined by education level, income, and occupation, eats more fruits and vegetables, whole grains, lean meats, fish, and dairy products with low fat content, while the stratum with the lowest socioeconomic status eats more fatty meats, refined grains, and fats31. Researchers estimated
that the adoption of an aggressive political scenario regarding food legislation could prevent 29,920 deaths annually from cardiovascular disease with the intake of 500 g of fruits and vegetables (7,420), elimination of trans fats (4,700), reduction in salt intake by 3 g (6,600), and a 3% reduction in saturated fats in the total energy (11,200)32.
The Brazilian Healthy Eating Index Revised components with significant inequalities between sociodemographic strata were analyzed, especially whole grains, vegetables, fruits, and milk and dairy products.
The scores for whole grains increased with age and education level. Ervin had similar findings20. High intake of whole grains reduces
constipation and is associated with lower risk of developing cardiovascular disease, diabetes and diverticulitis33. Munter et al.34 reported an inverse
association between consumption of whole grains and the risk of type 2 diabetes, and found that the increment of two servings/day decreased the risk of the disease by 21%. Evidence of the health benefits of whole grains is well established in the literature, which indicates the need to disseminate information on the subject for the population and develop actions that encourage consumption and reduce the cost of whole grain products. The Brazilian dietary guidelines advise people to prefer less processed grains, such as whole wheat flour and brown rice, in view of their greater nutrient content35.
Higher scores for fruits and vegetables were found in women, as well as a gradual
increase in scores with increasing age and years of formal education. A researcher who analyzed a sample of National Health and Nutrition Examination Survey (NHANES) 2003-2004 obtained similar results, except for education level, which showed oscillating values in these components20. The Vigilancia de Fatores de Risco
e Proteção para Doenças Crônicas por Inqueritos
Telefonico (Vigitel) survey points to higher intake
of fruits and vegetables in women and a trend to increase with age and education level10. It is
estimated that inadequate fruit and vegetable intakes account for 2.8% of all deaths worldwide36.
Higher intake of fruits and vegetables is one of the goals set by the Brazilian government to stop the spread of chronic diseases, involving actions such as lower prices, and higher production and supply of these foods37.
The mean values for the milk and dairy component scores were highest in both women and the most educated subgroups, and lowest in adults. Other studies also found a declining milk score in adulthood, higher scores in high school categories, but no differences by gender20,21. Milk
and dairy products are the main sources of dietary calcium and their intakes are recommended for proper bone metabolism14. The target age groups
for calcium are the 9-18-year-olds and 70-year-olds and older for males and 9-18-year-70-year-olds and 51-year-olds or older for females. In these groups the EAR (Estimated Average Requirements) levels range from 1,000 to 1,100 mg38. The reference
values for adequate calcium intake have been discussed because of the need for more evidence on the role of this nutrient, not only on bone health, but especially on body weight and cardiovascular health39. Data from the Brazilian
National Dietary Survey draws attention to the inadequate calcium intake of adolescents6, adults7
and older adults8. Among adults, the average per
capita intake of dairy products did not exceed
100 g or mL per day7. A survey of adult participants
higher diet quality, assessed by the Dietary Guidelines Adherence Index, higher intakes of vitamins and minerals, as well as lower levels of triglycerides, glucose, systolic blood pressure, and insulin40.
Women and more educated individuals had higher scores for sodium, but they decreased with age. In the study by Ervin20, mean sodium
score decreased with increasing education level, but no difference was detected regarding gender and age. Excessive sodium intake is one of the determinants for the development of arterial hypertension, which according to the World Health Organization (WHO), kills 7.5 million people/year36. The WHO recommends a maximum
daily salt intake of 5 g (equivalent to 2 g of sodium) for the prevention of cardiovascular diseases. In Brazil household sodium availability adjusted for an intake of 2,000 kcal reaches as much as 4.7 g per person per day, exceeding more than twice the maximum recommendation for this nutrient41. Reducing sodium intake stands out as
a priority in the Brazilian health agenda. The Ministry of Health established a cooperation agreement with the Associação Brasileira das
Industrias da Alimentação (ABIA, Brazilian
Association of Food Industry) in 2010 to decrease the sodium content of processed foods. For this purpose, working groups were created to act in the “agreement on the levels of sodium reduction targets in processed food”, in “conducting education and information campaigns for the population”, and in “developing a guideline for good nutritional practices” (p.289)42.
The mean score of the composite component Gord_AA increased with age and decreased in the highest education level. Ervin20 and Hiza et
al.21 observed higher scores with age, in women,
and in education level extremes. According to a study using data from the Brazilian National Dietary Survey, 66.6% of 1,793 tested foods had high contents of solid fat (saturated and trans) and sugar. The mean contribution of these foods to total energy was higher in women (52.0%),
adolescents (54.0%), and those with higher education levels (55.0%) and family income (57.0%)43. A study using BHBS 2008-2009 data
has shown that the participation of meats, milk, cheese, animal fats, soft drinks, and pre-packaged meals in the diet increases with household income, and these foods contain sugar and saturated and trans fats11.
Unprocessed or minimally processed foods are valued by the 2014 Dietary Guidelines for the Brazilian Population (DGBP)35 as the basis of a
healthy diet and are contemplated in the components fruits, vegetables, grains, milk, and meat and eggs, which integrate the BHEI-R. However, some components include foods like cookies, ice cream, cakes, and milk drinks, identified as ultra-processed foods by DGBP; these foods affect the score of the BHEI-R and partly integrate the components saturated fats, Gord_AA, and sodium.
This study has some limitations. One refers to the administration of a single 24HR, which does not represent the usual intake of an individual due to food intake variability. However, the ISACamp 2008 collected 24HR in a population-based sample and in different days of the week and months of the year, allowing for a proper estimate of the average intake of the target population44. Also, the possibility of reverse
above. Furthermore, the composition and use of bean and meat proteins are not equivalent.
In addition the study data do not come from a specific nutrition survey, which reduces the detailing of the questions about diet, but on the other hand, it expands health dimensions that can be assessed with the diet.
Among the strengths of the study, the evaluation of diet quality in different life stages with a population-based sample can be highlighted.
This paper presents population-level information on the diet quality of adolescents, adults, and older adults from the city of Campinas, evaluated by a set of dietary components. The pattern of global food intake and specific components was identified according to the socio-demographic stratum of the population, bringing subsidies for the design of policies to promote healthy eating, prevention, and control of NCDs.
C O N C L U S I O N
A distinct dietary intake pattern was observed among the study sociodemographic subgroups. The score of the BHEI-R was low for the whole population, but the adolescents, young adults, and the individuals with less education were shown to be more vulnerable to poor diet quality.
The components with the worst scores, indicating inappropriate intake, were whole grains, sodium, dark green and orange vegetables, total fruit, whole fruit, milk and Gord_AA. Women scored higher for vegetables, fruits, milk, and sodium, and lower for meat and eggs, oils, saturated fats, and Gord_AA. Adults and older adults had better scores for whole grains, vegetables, oils and Gord_AA than adolescents. Adults had lower score for milk and dairy products than adolescents. The segments with higher education levels presented higher scores for whole grains, fruits, vegetables, milk, and sodium, as well as lower scores for saturated fats.
The results of this study reveal the need to promote strategies for a healthier diet directed
to stimulate the intake of fruits, vegetables, and whole grains, as well as to reduce the intake of sodium in the study population. Adults must be oriented to include more milk and dairy products in their diet, and individuals with higher education levels need orientation to decrease saturated fat intake.
A C K N O W L E D G E M E N T S
The study was sponsored by the Conselho Nacional de Desenvolvimento Científico e Tecnológico
and the Coordenação de Aperfeiçoamento de Pessoal de Nível Superior.
C O L A B O R A T O R S
D ASSUMPÇÃO analyzed and interpreted the data and wrote the article. SMA DOMENE and RM FISBERG analyzed and interpreted the data and collaborated in the discussion of the manuscript. MBA BARROS drafted the article, supervised the study and outlined the article.
R E F E R E N C E S
1. Malta DC, Silva Jr JB. Plano de ações estratégicas para o enfrentamento das doenças crônicas não transmissíveis no Brasil após três anos de implan-tação, 2011-2013. Epidemiol Serv Saúde. 2014; 23(3):389-95.
2. Brasil. Ministério da Saúde. Secretaria de Vigilância em Saúde. Perfil da mortalidade da população bra-sileira em 2012. In: Saúde Brasil 2013: uma análise da situação de saúde e das doenças transmissíveis relacionadas à pobreza. Brasília: Ministério da Saúde; 2014 [acesso 2015 nov 5]. Disponível em: http://bvsms.saude.gov.br/bvs/publicacoes/saude_ brasil_2013_analise_situacao_saude.pdf
3. Barker DJP. Developmental origins of chronic disease. Public Health. 2012; 126(3):185-9. 4. Willett WC. Overview and perspective in human
6. Veiga GV, Costa RS, Araújo MC, Souza AM, Bezerra IN, Barbosa FS, et al. Inadequação do consumo de nutrientes entre adolescentes brasileiros. Rev Saúde Pública. 2013; 47(Supl. 1):212-21.
7. Araújo MC, Bezerra IN, Barbosa FS, Junger WL, Yokoo EM, Pereira RA, et al. Consumo de macronu-trientes e ingestão inadequada de micronumacronu-trientes em adultos. Rev Saúde Pública. 2013; 47(Supl. 1):177-89.
8. Fisberg RM, Marchioni DML, Castro MA, Verly Junior E, Araújo MC, Bezerra IN, et al. Ingestão inadequada de nutrientes na população de idosos do Brasil: Inquérito Nacional de Alimentação 2008-2009. Rev Saúde Pública. 2013; 47(Supl. 1):222-30. 9. Levy RB, Castro IRR, Cardoso LO, Tavares LF, Sardinha LMV, Gomes FS, et al. Consumo e com-portamento alimentar entre adolescentes brasi-leiros: Pesquisa Nacional de Saúde do Escolar (PeNSE), 2009. Ciên Saúde Colet. 2010; 15(Supl. 2):3085-97.
10. Iser BPM, Yokota RTC, Sá NNB, Moura L, Malta DC. Prevalência de fatores de risco e proteção para doenças crônicas nas capitais do Brasil: principais resultados do Vigitel 2010. Ciên Saúde Colet. 2012; 17(9):2343-56.
11. Levy RB, Claro RM, Mondini L, Sichieri R, Monteiro CA. Distribuição regional e socioeconômica da disponibilidade domiciliar de alimentos no Brasil em 2008-2009. Rev Saúde Pública. 2012; 46(1):6-15. 12. Previdelli AN, Andrade SC, Pires MM, Ferreira SRG, Fisberg RM, Marchioni DM. Índice de Qualidade da Dieta Revisado para população brasileira. Rev Saúde Pública. 2011; 45(4):794-8.
13. Guenther PM, Reedy J, Krebs-Smith SM, Reeve BB, Basiotis PP. Development and evaluation of the Healthy Eating Index-2005: Technical report. Alexandria (VA): Center for Nutrition Policy and Promotion; 2007 [cited 2015 Jan 10]. Available from: http://www.cnpp.usda.gov/Healthy EatingIndex. htm
14. US Department of Agriculture. US Department of Health and Human Services. Dietary Guidelines for Americans, 2005. Washington (DC): Office of Disease Prevention and Health Promotion; 2005 [cited 2015 Jan 10]. Available from: http://www. health.gov/dietaryguidelines/pubs.asp
15. Andrade SC, Previdelli NA, Marchioni DML, Fisberg RM. Avaliação da confiabilidade e validade do Índice de Qualidade da Dieta Revisado. Rev Saúde Pública. 2013; 47(4):675-83.
16. Alves MCGP. ISA-Campinas 2008/09: plano de amostragem. Campinas: Unicamp; 2009 [acesso 2015 Mar 8]. Disponível em: http://www.fcm. unicamp.br/fcm/sites/default/files/plano_de_ amostragem.pdf
17. Domene SMA. Avaliação do consumo alimentar. In: Taddei JAAC, Lang RMF, Longo-Silva G, Toloni MHA. Nutrição em saúde pública. Rio de Janeiro: Rubio; 2011. p.41-54.
18. Fisberg RM, Villar BS. Manual de receitas e medidas caseiras para cálculo de inquéritos alimentares. São Paulo: Signus; 2002.
19. Pinheiro ABV, Lacerda EMA, Benzecry EH, Gomes MCS, Costa VM. Tabela para avaliação de consumo alimentar em medidas caseiras. 5ª ed. São Paulo: Atheneu; 2004.
20. Ervin RB. Healthy Eating Index-2005 total and component scores for adults aged 20 and over: National Health and Nutrition Examination Survey, 2003-2004. Natl Health Stat Report. 2011; 44(13):1-9.
21. Hiza HAB, Casavale KO, Guenther PM, Davis CA. Diet quality of Americans differs by age, sex, race/ ethnicity, income, and education level. J Acad Nutr Diet. 2012; 113(2):297-306.
22. Godoy FC, Andrade SC, Morimoto JM, Carandina L, Goldbaum M, Barros MBA, et al. Índice de quali-dade da dieta de adolescentes residentes no distrito do Butantã, município de São Paulo, Brasil. Rev Nutr. 2006; 19(6):663-71. http://dx.doi.org/10.15 90/S1415-52732006000600003
23. Andrade SC, Barros MBA, Carandina L, Goldbaum M, Cesar CLG, Fisberg RM. Dietary Quality Index and associated factors among adolescents of the State of Sao Paulo, Brazil. J Pediatr. 2010; 156(3):456-60.
24. Morimoto JM, Latorre MRDO, Cesar CLG, Carandina L, Barros MBA, Goldbaum M, et al. Fatores associados à qualidade da dieta de adultos residentes na Região Metropolitana de São Paulo, Brasil, 2002. Cad Saúde Pública. 2008; 24(1):169-78. 25. Barros MBA, Francisco PMSB, Zanchetta LM, César CLG. Tendências das desigualdades sociais e demo-gráficas na prevalência de doenças crônicas no Brasil, PNAD: 2003-2008. Ciên Saúde Colet. 2011; 16(9):3755-68.
26. Bezerra IN, Souza AM, Pereira RA, Sichieri R. Con-sumo de alimentos fora do domicílio no Brasil. Rev Saúde Pública. 2013; 47(Supl. 1):200-11. 27. Deeks A, Lombard C, Michelmore J, Teede H. The
effects of gender and age on health related behaviors. BMC Public Health. 2009; 9:213. 28. Endevelt R, Baron-Epel O, Viner A, Heymann AD.
Socioeconomic status and gender affects utilization of medical nutrition therapy. Diab Res Clin Pract. 2013; 101(1):20-7.
a cross-sectional survey. Central Eur J Med. 2013; 125(9-10):261-9.
30. Bortolini GA, Gubert MB, Santos LMP. Consumo alimentar entre crianças brasileiras com idade de 6 a 59 meses. Cad Saúde Pública. 2012; 28(9):1759-71.
31. Darmon N, Drewnowski A. Does social class predict diet quality? Am J Clin Nutr. 2008; 87(5):1107-17. 32. O’Flaherty M, Flores-Mateo G, Nnoaham K, Lloyd-Williams F, Capewell S. Potential cardiovascular mortality reductions with stricter food policies in the United Kingdom of Great Britain and Northern Ireland. Bull World Health Organ. 2012; 90(7):522-31. 33. Willett WC, Stampfer MJ. Current evidence on healthy eating. Annu Rev Public Health. 2013; 34:77-95.
34. Munter JSL, Hu FB, Spiegelman D, Franz M, van Dam RM. Whole grains, bran, and germ intake and risk of type 2 diabetes: A prospective cohort study and systematic review. PLoS Med. 2007; 4(8):1385-95. 35. Brasil. Ministério da Saúde. Secretaria de Atenção à Saúde. Guia alimentar para a população brasileira. Brasília: Ministério da Saúde; 2014.
36. World Health Organization. Global status report on noncommunicable diseases. Geneva: WHO; 2010.
37. Brasil. Ministério da Saúde. Secretaria de Vigilância em Saúde. Plano de ações estratégicas para o Enfrentamento das Doenças Crônicas Não Trans-missíveis (DCNT) no Brasil 2011-2022. Brasília: Mi-nistério da Saúde; 2011.
38. Institute of Medicine. Dietary Reference Intakes for calcium and vitamin D. Washington (DC): National Academy Press; 2011.
39. Rodríguez-Rodríguez E, Lombán BN, Sobaler AML, Anta RMO. Review and future perspectives on recommended calcium intake. Nutr Hop. 2010; 25(3):366-74.
40. Wang H, Livingston KA, Fox CS, Meigs JB, Jacques PF. Yogurt consumption is associated with better diet quality and metabolic profile in American men and women. Nutr Res. 2013; 33(1):18-26. 41. Sarno F, Claro RM, Levy RB, Bandoni DH, Ferreira
SRG, Monteiro CA. Estimativa de consumo de sódio pela população brasileira, 2002-2003. Rev Saúde Pública. 2009; 43(2):219-25.
42. Nilson EAF, Jaime PC, Resende DO. Iniciativas desenvolvidas no Brasil para a redução do teor de sódio em alimentos processados. Rev Panam Salud Pública. 2012; 32(4):287-92.
43. Pereira RA, Duffey KJ, Sichieri R, Popkin BM. Sources of excessive saturated fat, trans fat and sugar consumption in Brazil: An analysis of the first Brazilian nationwide individual dietary survey. Public Health Nutr. 2014; 17(1):113-21.
44. Breslow RA, Guenther PM, Juan W, Graubard BI. Alcoholic beverage consumption, nutrient intakes, and diet quality in the US adult population, 1999-2006. J Am Diet Assoc. 2010; 110(4):551-62.