Molecular evolution of the
ent
-kaurenoic acid oxidase gene in Oryzeae
Yanhua Yang
1,2and Keping Chen
11
Institute of Life Sciences, Jiangsu University, Zhenjiang, Jiangsu Province, China.
2State Key Laboratory of Systematic and Evolutionary Botany, Institute of Botany,
Chinese Academy of Sciences, Beijing, China.
Abstract
We surveyed the substitution patterns in theent-kaurenoic acid oxidase (KAO) gene in 11 species of Oryzeae with an outgroup in the Ehrhartoidaea. The synonymous and non-synonymous substitution rates showed a high positive correlation with each other, but were negatively correlated with codon usage bias and GC content at third codon posi-tions. The substitution rate was heterogenous among lineages. Likelihood-ratio tests showed that the non-synonymous/synonymous rate ratio changed significantly among lineages. Site-specific models provided no evi-dence for positive selection of particular amino acid sites in any codon of theKAO gene. This finding suggested that the significant rate heterogeneity among some lineages may have been caused by variability in the relaxation of the selective constraint among lineages or by neutral processes.
Key words:codon usage bias,ent-kaurenoic acid oxidase (KAO), positive selection, rate heterogeneity, substitution rate.
Received: July 21, 2011; Accepted: November 9, 2011.
Introduction
Gibberellins (GAs) are an important class of plant hormones involved in the regulation of various growth and developmental processes in higher plants (Applefordet al., 2006). The absence of GAs results in dwarfism in some plant species.ent-kaurenoic acid oxidase (KAO), a member of the CYP88A subfamily of cytochrome P450 enzymes, catalyzes a three-step reaction in the gibberellin biosyn-thetic pathway froment-kaurenoic acid to GA12 (Helliwell et al., 2001). A primary goal of molecular evolutionary studies is to estimate the rate of DNA mutation and eluci-date the mechanisms of molecular evolution. Such studies frequently involve a comparison of orthologous DNA frag-ments among species to determine evolutionary rates and an assessment of the evolutionary processes involved,e.g., natural selection, rate heterogeneity of lineages and muta-tional biases. Analysis of the molecular evolutionary pat-terns of different genes provides understanding of the evo-lutionary processes and pressures experienced by particular lineages.
The tribe Oryzeae (Poaceae) includes approximately 12 genera and more than 70 species distributed throughout tropical and temperate regions of the world (Clayton and Renvoize, 1986; Vaughan, 1994). In the genusOryza, the Asian cultivated rice (Oryza sativaL.) is one of the world’s most important crops and a primary food source for more
than one-half of the world’s population (Chandler and Wessler, 2001). This species has become a model monocot-yledon in scientific research and its entire genome has been sequenced. Other members of the Oryzeae are also of eco-nomic importance, including wild species ofOryzathat can be used in the genetic improvement of rice.
Analysis of the substitution patterns in theKAOgene can provide insights into the driving forces that have led to evolutionary change in this gene in Oryzeae. In addition, the identification of patterns of molecular evolution in the KAOgene can improve our understanding of the evolution-ary history of some Oryzeae species. In this work, we ex-amined the heterogeneity of the substitution rate in the KAOgene among various genera and species of Oryzeae and sought to identify the possible causes of such heteroge-neity. We also sought for evidence of natural selection in the exon regions of theKAOgene.
Materials and Methods
Plant materialA portion of the KAO gene was isolated and se-quenced from members of the rice tribe (Oryzeae) (Ta-ble 1). Eleven diploid species were selected to represent the major phylogenetic lineages of Oryzeae (Figure S1, Sup-plementary Material) (Guo and Ge, 2005). These consisted of sevenOryza species representing six diploid genome types, namely,Oryza sativa(AA),O. meridionalis(AA), O. punctata (BB), O. officinalis (CC), O. australiensis (EE),O. brachyantha (FF), O. granulata (GG), and one
Genetics and Molecular Biology, 35, 2, 448-454 (2012)
Copyright © 2012, Sociedade Brasileira de Genética. Printed in Brazil www.sbg.org.br
Send correspondence to Yanhua Yang. Institute of Life Sciences, Jiangsu University, 301 Xuefu Road, 212013 Zhenjiang, Jiangsu Province, P.R. China. E-mail: [email protected].
species from each of four other genera in the tribe Oryzeae (Leersia tisserantti, Chikusichloa aquatica, Luziola leiocarpa, andRhynchoryza subulata) (Table 1).Ehrharta erecta, a species in the tribe Ehrhartoideae, which is a sister tribe to the Oryzeae, was used as an outgroup (GPWG, 2001; Guo and Ge, 2005). Plastid, mitochondrial and nu-clear gene sequences have been used to establish the phy-logeny of the Oryzeae (Geet al., 1999; Guo and Ge, 2005; Tanget al., 2010) and have provided an important frame-work for the study of molecular evolution in this group (Figure S1, Supplementary Material).
DNA extraction, amplification and sequencing
Total DNA was isolated from silica-gel dried or fresh leaves as described by Geet al.(1999). A 1-2 kb fragment of theKAOgene containing several exons and introns was obtained by using the polymerase chain reaction (PCR) in conjunction with the forward primer KAOF (5’-CAGGA CGTTCATGTTCAGCAG-3’) and the reverse primers
KAOR1 (5’-TCGTCGCCAAGCAGTTGTC-3’) and
KAOR2 (5’-GCCAAGCAGTTGTCCAC-3’) (Figure 1). The PCR was done in a total volume of 25mL that con-tained 5-50 ng of template DNA, 0.2mM of each primer, 200mM of each dNTP, 10 mM Tris-HCl (pH 8.3), 50 mM KCl, 1.5 mM MgCl2and 0.75 U of ExTaqDNA
polymer-ase (TaKaRa, Shiga, Japan). Amplifications were done in a T gradient 96 U thermocycler (Biometra, Göttingen, Ger-many) as follows: 3 min at 94 °C, followed by 33 cycles of 30 s at 94 °C, 30 s at 56 °C, 2.5 min at 72 °C and a final ex-tension at 72 °C for 10 min. Further internal primers used for sequencing were: KAO707F 5’-ACCGTCTTCCTCC
AGGAGAAC-3’ (Tm = 61.9 °C), KAO931F
5’-GATGCACTTCCTCTCACAG-3’ (Tm = 57.6 °C) and
KAO1478F 5’-CGTCAACATCTCCTTCGTGTC-3’
(Tm = 60 °C) (Yanget al., 2009). All of the sequences were deposited in GenBank under accession numbers EF577665-EF577670 and EU179429-EU179435 (Ta-ble 2).
Sequence analysis
Sequences were aligned using ClustalX v.1.81 (Thompsonet al., 1997) and refined by manual adjustment based on the predicted amino acid sequence. The amino acid sequences (excluding introns) were sufficiently con-served across the 12 species to provide unambiguous align-ments. We examined the possibility of sequence saturation using DAMBE v.4.5.45 (Xia and Xie, 2001). Pairwise syn-onymous and non-synsyn-onymous substitutions per site (dS anddN) among the 11 species were estimated for the coding regions of theKAOgene.
The extent of codon usage bias often reflects the de-gree of selective constraint in a gene (Sharp, 1991; Sharpet al., 1986). To measure the extent of codon usage bias, we estimated the effective number of codons (ENC) and codon bias index (CBI) using DnaSP v.4.10.9 (Rozas and Rozas, 1999). The ENC values range from 20 (only one codon is used for each amino acid,i.e., the codon bias is maximal) to 61 (all synonymous codons for each amino acid are equally used,i.e., there is no codon bias) (Wright, 1990). The CBI values range from 0 (uniform use of synonymous codons) to 1 (maximum codon bias) (Morton, 1993). Variation in the rate of synonymous substitution among genes may be related to codon use (Sharp, 1991). Therefore, several pa-rameters related to codon usage bias, such as the GC con-tent at the first and second codon positions (GC1, 2), as well as third codon positions (GC3), were also estimated using DnaSP v.4.10.9 (Rozas and Rozas, 1999).
Detecting rate heterogeneity among lineages
The relative-rate test based on the method of Muse and Gaut (1994), as implemented in Hyphy (Pondet al., 2005), was used to detect variation in the synonymous and non-synonymous substitution rates along different lineages, withEhrharta erectaas the reference sequence. This method examines substitution rates between two lin-eages with reference to a third outgroup lineage. In the first model, the two related taxa from the most recent common ancestor are constrained to have the same substitution rate. In the second model, the two lineages may have different substitution rates. A likelihood ratio test is used to test
Yanget al. 449
Table 1- Species used in this study.
Species Genome Accessiona Country
Oryza sativa A japonica GenBank
O. meridionalis A 105282 Australia
O. punctata B 103903 Tanzania
O. officinalis C 104972 China
O. australiensis E 105263 Australia-PNAS
O. brachyantha F 105151 Sierra Leone-PNAS
O. granulata G M8-15 Ledong, Hainan
Leersia tisserantti — 105610 Cameroon
Chikusichloa aquatica — 106186 Japan
Rhynchoryza subulata — 100913 Argentina
Luziola leiocarpa — 82043 Argentina
Ehrharta erecta — 218290 South Africa
aAll accessions were obtained from the International Rice Research Insti-tute at Los Banos, Philippines.
which of the models best explains the data (Muse and Gaut, 1994).
Detection of positive selection
The ratiow(dN/dS) provides an effective means of de-tecting selection or selective pressure on a gene or gene re-gion, withw< 1, = 1 and > 1 indicating negative selection, neutral evolution and positive selection, respectively (Yang, 2006). We ran likelihood-based analyses using the CODEML program of PAML 4 (Yang, 2007) to explore the selective processes acting on theKAOgene. First, we used the branch models to examine whether the evolutionary rates differed among lineages within the gene tree. The one ratio model (M0) assumes a singlewfor all branches and all sites. However, the free ratio model (Mf) postulates an in-dependentwratio for each branch of the tree. A likelihood ratio test (LRT) was used to decide whether there was a sig-nificant difference between M0 and Mf. The model with the higher likelihood value was assumed to be the better model (Bielawski and Yang, 2003; Yang and Nielsen, 1998).
We next used site-specific models to detect whether particular amino acid residues were subject to positive se-lection (Yang, 2006). The neutral model (M1a) classifies all of the sites into two categories, i.e., strict constraint (0 <w< 1) (purifying selection) and neutral (w= 1). Based on M1a, the positive selection model (M2a) assumes a third category under positive selection (w> 1). The beta model (M7) assumes a beta distribution for thewratios over sites, and the beta andwmodel (M8) increases the independent ratio estimated by the data. M8 and M2a assume positive selection and are compared with M7 and M1a, respectively. If the LRT is significant and there is a site withw> 1 then positive selection is invoked for the gene (Bielawski and Yang, 2003; Yang, 2006).
Results and Discussion
Previous studies showed that theKAOgene was a sin-gle-copy gene (Helliwell et al., 2001; Sakamoto et al., 2004; Yamaguchi, 2008) and the loss-of-function mutant exhibits a typical phenotype, indicating the functional im-portance of this enzyme in GA biosynthesis (Sakamotoet al., 2004). In view of the importance of comparing ortho-logous rather than paraortho-logous genes when estimating sub-stitution rates, we initially examined this issue and found that theKAOgene was orthologous in all of the species ana-lyzed. The similarity of the aligned coding regions ranged from 87.5% to 99.5% (Figure S2, Supplementary Mate-rial). Sequences of theKAOgene were isolated from all of the Oryzeae species and from the outgroup, Ehrharta erecta. The sequenced regions ranged in size from 1772 bp to 2626 bp and their aligned coding regions varied from 1047 bp to 1053 bp (Table 2). The total GC content and the GC content of the third position of the codons (GC3) were
450 Molecular evolution of theKAOgene
similar across species. Table 2 summarizes the sequence data for this gene.
Codon usage bias and its correlation with GC3 and substitution rates
Codon usage bias has been important in studies of molecular evolution because it provides examples of weak selection at the molecular level. CBI and ENC were calcu-lated to measure the degree of codon usage bias. CBI showed a marked negative correlation with ENC (r2= 0.958, p < 0.0001) (Figure 2A) such that both CBI and ENC could be used to measure the degree of codon usage bias. In this study, ENC was used to measure the degree of codon usage bias.
To determine the relative effects of mutation pressure versus natural selection on codon composition, we exam-ined the relationship between the GC content at third codon positions (GC3) and the GC content at the first and second codon positions (GC1,2). The GC content of GC1,2 ranged from 48.9% to 50.3%, which there was a tendency of posi-tive correlation with GC3 (r2= 0.227) but this was not sig-nificant (p = 0.139) (Figure 2F). This pattern of base com-position suggests that the GC content is most likely the result of mutation pressure since natural selection acts dif-ferently on different codon positions (Shackelton et al., 2006). Interestingly, after excludingL. tisserantti, GC1,2 showed a significant positive correlation with GC3 (r2= 0.604, p < 0.05) (data not shown), which further con-firmed that these changes were most likely the result of mu-tation pressure. dS was positively correlated with dN (r2= 0.498, p < 0.05) (Figure 2D), as also observed in other organisms (Bielawskiet al., 2000; Dunnet al., 2001; Hurst and Williams, 2000; Kusumiet al., 2002), and negatively correlated with codon bias (r2 = 0.713, p < 0.05) (Figu-re 2B) and GC3 (r2= 0.796, p < 0.001) (Figure 2E). The negative correlation betweendSand codon usage bias may be explained by natural selection (Bielawskiet al., 2000; Smith and Eyre-Walker, 2001; Urrutia and Hurst, 2001) since codon usage bias is a primary factor indSvariation among genes and is thought to be under natural selection, perhaps because of the need to maintain accuracy or speed in translation (Yang and Gaut, 2011). There was also a ten-dency fordNbeing negatively correlated with codon usage bias (r2= 0.348) but this was not significant (p = 0.056) (Figure 2C). The latter would be consistent with sites that are functionally constrained and consequently conserved at the amino acid level. Such sites are also likely to experience stronger selection for translation accuracy and hence have a higher codon bias (Akashi, 2003). This might explain the negative correlation betweendNand codon bias observed here (though not significant), and by others in enteric bacte-ria (Rocha, 2004; Sharp, 1991), Drosophila (Betancourt and Presgraves, 2002), yeast (Drummondet al., 2005), and viruses (Duffyet al., 2008). The fact thatdNis correlated to codon bias suggests that codon bias might be used as a
mea-sure of the level of constraint upon a site or gene (Plotkinet al., 2004, 2006; Stoletzki and Eyre-Walker, 2007).
The driving forces governing evolution of theKAO
gene in Oryzeae
A codon-based approach showed that the free ratio model (Mf) had significantly higher likelihood scores (ln4103.38) than the one ratio model (M0) (ln4124.44) (p < 0.001) (Table 3). Although the dN/dS ratios varied across lineages from 0.0001 to 0.358 (with one of the 21 lineages showing no predicted synonymous substitutions, i.e., thedN/dS ratio was equal to 999.000), the estimated dN/dSratio for each lineage was less than 1. Thewvalues were estimated to be 0.079 under the M0 model, suggesting that purifying selection or selection constraint best ex-plained the molecular evolution of theKAOgene, in agree-ment with the studies on anthocyanin pathway genes (Lu and Rausher, 2003; Rausheret al., 2008).
The branch model test is a very conservative test of positive selection because it averages the ratio across all sites. We therefore used site-specific codon models to ex-amine whether there was positive selection on codon sites. The M2a and M8 models, which assume positive selection, were not significantly better than the null models M1a and
Yanget al. 451
M7 (for M1avs.M2a, 2DL = 0, p = 1.0; for M7vs.M8, 2D= 0, p = 1.0) (Table 3). These results indicate that the KAOgene is under strong selective constraint, thus ruling out the possibility of past episodes of positive selection on this gene. Previous studies have shown that variation in the evolutionary rate among nucleotide sites may be attributed to differences in the frequency of positive selection (Yang et al., 2000; Gautet al., 2011) or in the magnitude of selec-tive constraints (Li, 1997; Rausheret al., 1999, 2008).
In this study, the branch and codon models failed to detect any sign of positive selection for any lineage and codon of theKAOgene, suggesting that the significant het-erogeneity of some lineages was attributable mainly to the relaxed constraint among lineages or neutral processes rather than positive selection. However, the power to detect positive selection using the methods mentioned above may be low, especially when adaptive substitutions are spread across many amino acid sites (Pondet al., 2005; Rausheret al., 2008). Further investigations with alternative tests on intraspecific changes (Olsenet al., 2002; Whittet al., 2002;
Flowerset al., 2007; Rausheret al., 2008) would be neces-sary to detect evidence of positive selection.
Rate variation among lineages
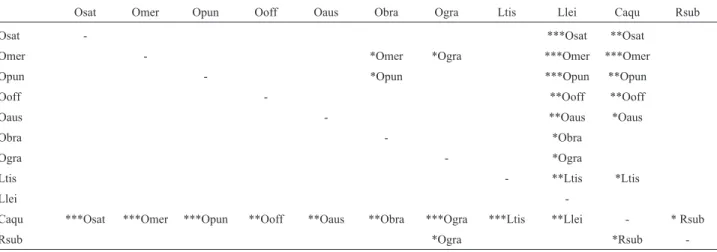
There was significant heterogeneity in the synony-mous and non-synonysynony-mous substitution rates of theKAO gene among lineages of the rice tribe (Table 4), especially inC. aquatica andL. leiocarpa. Among 55 relative-rate tests for synonymous substitutions, 11 comparisons were significant at the 5% or 1% level. At the same time, among 55 relative-rate tests for non-synonymous substitutions, the null hypothesis of rate homogeneity was rejected for 18 comparisons. InC. aquaticaandL. leiocarpa dNappeared to be decelerated, and diddSinC. aquatica. The significant slowdown in the rate of synonymous and non-synonymous substitutions inC. aquaticaandL. leiocarpalineages may reflect differences in the intensity of selection,i.e., theKAO gene may be under different functional constraints in dif-ferent lineages.
Several mechanisms could explain the observed rate heterogeneity, including life history traits such as
genera-452 Molecular evolution of theKAOgene
Table 4- Results of 110 relative-rate tests fordS(lower triangle) anddN(upper triangle). Rejection of rate equality is indicated by * at the 0.05 level, ** at the 0.01 level, or *** at the 0.001 level.Ehrharta erectawas used as the outgroup in all comparisons. Species names that were inferred to have evolved more quickly in each pairwise comparison are indicated in the table by the first letter of the genus name and the first three letters of the species name.
Osat Omer Opun Ooff Oaus Obra Ogra Ltis Llei Caqu Rsub
Osat - ***Osat **Osat
Omer - *Omer *Ogra ***Omer ***Omer
Opun - *Opun ***Opun **Opun
Ooff - **Ooff **Ooff
Oaus - **Oaus *Oaus
Obra - *Obra
Ogra - *Ogra
Ltis - **Ltis *Ltis
Llei
-Caqu ***Osat ***Omer ***Opun **Ooff **Oaus **Obra ***Ogra ***Ltis **Llei - * Rsub
Rsub *Ogra *Rsub
-Caqu –Chikusichloa aquatica, Llei –Luziola leiocarpa, Ltis –Leersia tisserantti, Oaus –O. australiensis, Obra –O. brachyantha, Ogra –O. granulata, Omer –O. meridionalis, Ooff –O. officinalis, Opun –O. punctata, Osat –O. sativaand Rsub –Rhynchoryza subulata.
Table 3- Log likelihood values,wratios and parameter estimates for theKAOgene in models with variablewratios among codon sites.
Model pa ln Parameter estimatesb Models compared
2DL p-value
Mf 31 -4103.38 w= 0.0001 ~ 999.000, tree lengthc= 2.140, kappa(ts/tv) = 1.103 M0-Mf 42.12 < 0.001 M0 23 -4124.44 w= 0.079, tree length = 2.181, kappa (ts/tv) = 1.082
M1a 24 -4067.60 w0= 0.049, p0= 0.921;w1= 1.000, p1= 0.079 M1a-M2a 0 1 M2a 26 -4067.60 p0= 0.921, p1= 0.053, p2= 0.026,w2= 1.000
M7 24 -4061.19 p = 0.282, q = 2.548 M7-M8 0 1
M8 26 -4061.19 p0= 1.000, p = 0.282, q = 2.548; p1= 0.000,w= 8.931
ap – number of parameters, ln – log-likelihood values of the data in each model.bParameter estimates in different models. c
tion time, biochemical features such as efficiency of DNA repair machinery, and environmental variables such as en-ergy and temperature (Eyre-Walker and Gaut, 1997; Li, 1997; Brownet al., 2005; Soria-Hernanzet al., 2008). Rate heterogeneity may also result from differences in popula-tion size since variapopula-tion in populapopula-tion size can alter evolu-tionary rates within a lineage (Eyre-Walker and Gaut, 1997; Lynch and Conery, 2003) and vice versa. Variation in the nucleotide substitution rates of theKAOgene signifi-cantly changed the w ratios of the respective lineages. These features of theKAOgene in Oryzeae resulted from the influence of various factors that affected the evolution of these species and their ancestors. A detailed knowledge of these factors will help us to understand the evolutionary history of Oryzeae species.
Conclusions
The results of this study showed that codon usage bias was negatively correlated with synonymous and non-synonymous substitution rates, a finding consistent with the importance of codon usage. CBI was positively corre-lated with ENC, thus confirming the similarity of CBI and ENC as parameters for measuring the degree of codon us-age bias. There was considerable heterogeneity in the nu-cleotide substitution rates of the KAO gene and this significantly affected thewratios of the respective lineages. There was no positive selection and no positively selected codons in this gene, a finding indicative of substantial se-lective constraint. These features of nucleotide substitu-tions in theKAO gene reflected the influence of various factors on the evolution of many Oryzeae species and their ancestors.
Acknowledgments
YYH thanks his instructor, Prof. Song Ge, for help with the design and execution of this work. We thank Fu-Min Zhang, Hong-Zheng Sun and other members of Dr. Ge’s group for their help during the experimental work and data analysis. We thank the International Rice Research In-stitute (Los Banos, Philippines) for providing the seed sam-ples. This work was supported by the National Basic Re-search Program of China (2007CB815704), the Ministry of Agriculture Transgenic Major Project (2009ZX08012-018B) and the Scientific Research Promotion Fund for the Talents of Jiangsu University (11JDG049).
References
Akashi H (2003) Translational selection and yeast proteome evo-lution. Genetics 164:1291-1303.
Appleford N, Evans D, Lenton J, Gaskin P, Croker S, Devos K, Phillips A and Hedden P (2006) Function and transcript analysis of gibberellin-biosynthetic enzymes in wheat. Plan-ta 223:568-582.
Betancourt AJ and Presgraves DC (2002) Linkage limits the power of natural selection inDrosophila. Proc Natl Acad Sci USA 99:13616-13620.
Bielawski JP and Yang Z (2003) Maximum likelihood methods for detecting adaptive evolution after gene duplication. J Struct Funct Genomics 3:201-212.
Bielawski JP, Dunn KA and Yang Z (2000) Rates of nucleotide substitution and mammalian nuclear gene evolution. Ap-proximate and maximum-likelihood methods lead to differ-ent conclusions. Genetics 156:1299-1308.
Brown JM, Pauly GB and May G (2005) Increased rates of molec-ular evolution in an equatorial plant clade: An effect of envi-ronment or phylogenetic nonindependence? Evolution 59:238-242.
Chandler VL and Wessler S (2001) Grasses. A collective model genetic system. Plant Physiol 25:1155-1156.
Clayton WD and Renvoize SA (1986) Genera Graminum. Kew Bulletin Additional Series XIII:1-389.
Drummond DA, Bloom JD, Adami C, Wilke CO and Arnold FH (2005) Why highly expressed proteins evolve slowly. Proc Natl Acad Sci USA 102:14338-14343.
Duffy S, Shackelton LA and Holmes EC (2008) Rates of evolu-tionary change in viruses: Patterns and determinants. Nat Rev Genet 9:267-276.
Dunn KA, Bielawski JP and Yang Z (2001) Substitution rates in
Drosophilanuclear genes: Implications for translational
se-lection. Genetics 157:295-305.
Eyre-Walker A and Gaut BS (1997) Correlated rates of synony-mous site evolution across plant genomes. Mol Biol Evol 14:455-460.
Flowers JM, Sezgin E, Kumagai S, Duvernell DD, Matzkin LM, Schmidt PS and Eanes WF (2007) Adaptive evolution of metabolic pathways inDrosophila. Mol Biol Evol 24:1347-1354.
Gaut B, Yang L, Takuno S and Eguiarte LE (2011) The patterns and causes of variation in plant nucleotide substitution rates. Annu Rev Ecol Evol Syst 42:245-266.
Ge S, Sang T, Lu BR and Hong DY (1999) Phylogeny of rice genomes with emphasis on origins of allotetraploid species. Proc Natl Acad Sci USA 96:14400-14405.
GPWG (2001) Phylogeny and subfamilial classification of the grasses (Poaceae). Ann MO Bot Gard 88:373-457. Guo YL and Ge S (2005) Molecular phylogeny of Oryzeae
(Poaceae) based on DNA sequences from chloroplast, mito-chondrial, and nuclear genomes. Am J Bot 92:1548-1558. Helliwell CA, Chandler PM, Poole A, Dennis ES and Peacock WJ
(2001) The CYP88A cytochrome P450,ent-kaurenoic acid oxidase, catalyzes three steps of the gibberellin biosynthesis pathway. Proc Natl Acad Sci USA 98:2065-2070.
Hurst LD and Williams EJ (2000) Covariation of GC content and the silent site substitution rate in rodents: Implications for methodology and for the evolution of isochores. Gene 261:107-114.
Kusumi J, Tsumura Y, Yoshimaru H and Tachida H (2002) Mo-lecular evolution of nuclear genes in Cupressacea, a group of conifer trees. Mol Biol Evol 19:736-747.
Li WH (1997) Molecular Evolution. Sinauer Associates, Sun-derland, 487 pp.
Lu Y and Rausher MD (2003) Evolutionary rate variation in anthocyanin pathway genes. Mol Biol Evol 20:1844-1853.
Lynch M and Conery JS (2003) The origins of genome complex-ity. Science 302:1401-1404.
Morton BR (1993) Chloroplast DNA codon use: Evidence for se-lection at thepsb Alocus based on tRNA availability. J Mol Evol 37:273-280.
Muse SV and Gaut BS (1994) A likelihood approach for compar-ing synonymous and nonsynonymous nucleotide substitu-tion rates, with applicasubstitu-tion to the chloroplast genome. Mol Biol Evol 11:715-724.
Olsen KM, Womack A, Garrett AR, Suddith JI and Purugganan MD (2002) Contrasting evolutionary forces in the
Arabidopsis thalianafloral developmental pathway.
Genet-ics 160:1641-1650.
Plotkin JB, Dushoff J and Fraser HB (2004) Detecting selection using a single genome sequence ofM. tuberculosisandP.
falciparum. Nature 428:942-945.
Plotkin JB, Dushoff J, Desai MM and Fraser HB (2006) Codon us-age and selection on proteins. J Mol Evol 63:635-653. Pond SL, Frost SD and Muse SV (2005) HyPhy: Hypothesis
test-ing ustest-ing phylogenies. Bioinformatics 21:676-679. Rausher M, Lu Y and Meyer K (2008) Variation in constraint
ver-sus positive selection as an explanation for evolutionary rate variation among anthocyanin genes. J Mol Evol 67:137-144. Rausher MD, Miller RE and Tiffin P (1999) Patterns of evolution-ary rate variation among genes of the anthocyanin biosyn-thetic pathway. Mol Biol Evol 16:266-274.
Rocha EPC (2004) Codon usage bias from tRNA’s point of view: Redundancy, specialization, and efficient decoding for translation optimization. Genome Res 14:2279-2286. Rozas J and Rozas R (1999) DnaSP ver. 3: An integrated program
for molecular population genetics and molecular evolution analysis. Bioinformatics 15:174-175.
Sakamoto T, Miura K, Itoh H, Tatsumi T, Ueguchi-Tanaka M, Ishiyama K, Kobayashi M, Agrawal GK, Takeda S, Abe K,
et al.(2004) An overview of gibberellin metabolism enzyme
genes and their related mutants in rice. Plant Physiol 134:1642-1653.
Shackelton LA, Parrish CR and Holmes EC (2006) Evolutionary basis of codon usage and nucleotide composition bias in ver-tebrate DNA viruses. J Mol Evol 62:551-563.
Sharp PM (1991) Determinants of DNA sequence divergence be-tweenEscherichia coliandSalmonella typhimurium: Codon usage, map position, and concerted evolution. J Mol Evol 33:23-33.
Sharp PM, Tuohy TM and Mosurski KR (1986) Codon usage in yeast: Cluster analysis clearly differentiates highly and lowly expressed genes. Nucleic Acids Res 14:5125-5143. Smith NG and Eyre-Walker A (2001) Synonymous codon bias is
not caused by mutation bias in G+C-rich genes in humans. Mol Biol Evol 18:982-986.
Soria-Hernanz DF, Braverman JM and Hamilton MB (2008) Par-allel rate heterogeneity in chloroplast and mitochondrial genomes of Brazil nut trees (Lecythidaceae) is consistent with lineage effects. Mol Biol Evol 25:1282-1296. Stoletzki N and Eyre-Walker A (2007) Synonymous codon usage
in Escherichia coli: Selection for translational accuracy.
Mol Biol Evol 24:374-381.
Tang L, Zou XH, Achoundong G, Potgieter C, Second G, Zhang DY and Ge S (2010) Phylogeny and biogeography of the rice tribe (Oryzeae): Evidence from combined analysis of 20 chloroplast fragments. Mol Phylogenet Evol 54:266-277. Thompson JD, Gibson TJ, Plewniak F, Jeanmougin F and Higgins
DG (1997) The CLUSTAL_X windows interface: Flexible strategies for multiple sequence alignment aided by quality analysis tools. Nucleic Acids Res 25:4876-4882.
Urrutia AO and Hurst LD (2001) Codon usage bias covaries with expression breadth and the rate of synonymous evolution in humans, but this is not evidence for selection. Genetics 159:1191-1199.
Vaughan DA (1994) The Wild Relative of Rice: A Genetic Re-sources Handbook. International Rice Research Institute, Manila, 137 pp.
Whitt SR, Wilson LM, Tenaillon MI, Gaut BS and Buckler ES (2002) Genetic diversity and selection in the maize starch pathway. Proc Natl Acad Sci USA 99:12959-12962. Wright F (1990) The “effective number of codons” used in a gene.
Gene 87:23-29.
Xia X and Xie Z (2001) DAMBE: Software package for data anal-ysis in molecular biology and evolution. J Hered 92:371-373.
Yamaguchi S (2008) Gibberellin metabolism and its regulation. Annu Rev Plant Biol 59:225-251.
Yang L and Gaut BS (2011) Factors that contribute to variation in evolutionary rate amongArabidopsisgenes. Mol Biol Evol 28:2359-2369.
Yang YH, Zhang FM and Ge S (2009) Evolutionary rate patterns of the gibberellin pathway genes. BMC Evol Biol 9:206. Yang Z (2006) Computational Molecular Evolution. Oxford
Uni-versity Press, Oxford, 357 pp.
Yang Z (2007) PAML 4: Phylogenetic analysis by maximum like-lihood. Mol Biol Evol 24:1586-1591.
Yang Z and Bielawski JP (2000) Statistical methods for detecting molecular adaptation. Trends Ecol Evol 15:496-503. Yang Z and Nielsen R (1998) Synonymous and nonsynonymous
rate variation in nuclear genes of mammals. J Mol Evol 46:409-418.
Supplementary Material
The following online material is available for this ar-ticle:
Figure S1 - Phylogeny of the rice tribe (Oryzeae) ob-tained from the combinedAdh2andGPA1sequences by Bayesian inference using the TrN+G model (Guo and Ge, 2005).
Figure S2 - Alignment of coding sequences of the KAOgene in 12 species.
This material is available as part of the online article from http://www.scielo.br/gmb.
Associate Editor: Adriana S. Hemerly
License information: This is an open-access article distributed under the terms of the Creative Commons Attribution License, which permits unrestricted use, distribution, and reproduction in any medium, provided the original work is properly cited.
10 20 30 40 50 60 ....|....|....|....|....|....|....|....|....|....|....|....|
O.sativa_kao
GGCTGGCCCAAGGCCACCGTCACCCTCATCGGCCCCAAATCCTTCGTCAACATGTCCT
AC
O.meridionalis_kao
GGCTGGCCCAAGGCCACCGTCACCCTCATCGGCCCCAAATCCTTCGTCAACATGTCCT
AC
O.punctata_kao
GGCTGGCCCAAGGCCACCGTCACCCTCATCGGCCCCAAATCCTTCGTCAACATGTCCT
AC
O.officinalis_kao
GGCTGGCCCAAGGCCACCGTCACCCTCATCGGCCCCAAATCCTTCGTCAACATGTCCT
AC
O.australiensis_kao
GGCTGGCCCAAGGCCACCGTCACCCTCATCGGCCCCAAATCCTTCGTCAACATGCCCT
AC
O.brachyantha_kao
GGCTGGCCCAAGGCGACCATCACTCTCATCGGCCCCAAGTCCTTCGTCAACATGCCCT
AC
O.granulata_kao
GGATGGCCCAAGGCCACCGTCACCCTCATCGGCCCCAAGTCCTTCGTCAGCATGCCCT
AC
L.tisserantti_kao
GGATGGCCGAAAGCGACGGTGACACTGATCGGGCCAAAATCGTTCGTGAGCATGCCGT
AC
C.aquatica_kao
GGCTGGCCCAAGGCAACGGTCACGCTCATCGGCCGCAAGTCGTTCGTGAGCATGCCG
TAC
R.subulata_kao
GGCTGGCCCAAGGCCACCGTCAATCTCATCGGCCGCAAGTCGTTCGTGAGCATGCCAT
AC
L.leiocarpa_kao
GGCTGGCCCAAGGCCACCGTCACACTCATCGGCCCCAAGTCCTTCGTCAGCATGCCGC
AC
E.erecta_kao
GGCTGGCCCAAGTCGACGGTGACGCTCCTCGGCAACAACTCATTCATAAGCTTGCCCC
AC
Clustal Consensus
********* *** ** ** **** ************* **70 80 90 100 110 120 ....|....|....|....|....|....|....|....|....|....|....|....|
O.sativa_kao
GACGACCACCGCCGCATCCGCAAGCTCACCGCCGCCCCCATCAACGGCTTCGACGCC
CTC
GACGACCACCGCCGCATCCGCAAGCTCACCGCCGCCCCCATCAACGGCTTCGACGCC
CTC
O.punctata_kao
GACGACCACCGCCGCATCCGCAAGCTCACCGCCGCCCCCATCAACGGCTTCGACGCC
CTC
O.officinalis_kao
GACGACCACCGCCGCATCCGCAAGCTCACCGCCGCCCCCATCAACGGCTTCGACGCG
CTC
O.australiensis_kao
GACGACCACCGCCGCATCCGCAAGCTCACGGCGGCGCCCATCAACGGCTTCGACGCC
CTC
O.brachyantha_kao
GACGACCACCGCCGCCTGCGCAAGCTCACGGCCGCGCCCATCAACGGCTTCGACGCG
CTC
O.granulata_kao
GACGACCACCGCCGCCTCCGCAAGCTCACCGCCGCGCCCATCAACGGCTTCGACGCG
CTC
L.tisserantti_kao
GACGATCACCGGCGAATCCGCAAGCTGACGGCGGCGCCGATCAACGGCTTCGACGCA
CTC
C.aquatica_kao
GAGGAACACCGGCGCTTGCGCAAGCTCACGGCGGCGCCCATCAACGGCTTCGAGGCG
CTC
R.subulata_kao
GAGGATCACCGGCGGCTGCGCAAGCTCACGGCGGCTCCCATCAACGGCTTCGAGGCG
CTC
L.leiocarpa_kao
GACGACCACCGCCGGCTCCGCAAGCTCACGGCGGCGCCCATCAACGGCTTCGACGCG
CTC
E.erecta_kao
GACGACCACCGGCGTCTGCGCAAGCTGACCGCGGCGCCAATCAACGGCTTTGATTCAC
TG
Clustal Consensus
*********** ****************************** ***130 140 150 160 170 180 ....|....|....|....|....|....|....|....|....|....|....|....|
O.sativa_kao
ACCACCTACCTCTCCTTCATCGACCAGACCGTCGTCGCCTCCCTCCGCCGCTGGTCCT
CG
O.meridionalis_kao
ACCACCTACCTCTCCTTCATCGACCAGACCGTCGTCGCCTCCCTCCGCCGCTGGTCCT
CG
O.punctata_kao
ACCACCTACCTCTCCTTCATCGACCACACCGTCGTCTCCACGCTCCGCCGCTGGTCCT
CC
AACACCTACCTCGCCTTCATCGACCAAACCGTCGTCGCCACTCTCCGCCGCTGGTCCT
CG
O.australiensis_kao
ACCACCTACCTCGCCTTCATCGACCAGACCGTCGTCGCTACGCTCCGCCGCTGGTCGT
CG
O.brachyantha_kao
ACCACCTACCTCGGCTTCATCGACCGCACCGTCGTCGACACGCTCCGCCGCTGGTCGT
CG
O.granulata_kao
ACCACCTACCTCGGCTTCATCGACCACACCGTCGTCGCCTCGCTCCGCCGCTGGTCGG
AG
L.tisserantti_kao
ACAACCTACCTCTCCTTCATCGACCAAACCGTCGTCGCCACGCTCCGCCGCTGGTCGG AA
C.aquatica_kao
ACCACCTACCTGGGCTTCATCGACCAGACCGTTGTGTCCACGCTGCGCCGCTGGTCGG
AG
R.subulata_kao
ACCACCTACCTGGGCTTCATCGACCAGACCGTCGTGGCCACGCTGCGCCGCTGGTCG
GAG
L.leiocarpa_kao
ACCACCTACCTCGCCTTCATCGACCAGACCGTCGTCTCCACGCTCCGCCGCTGGTCCG AC
E.erecta_kao
ACCACGTACCTCGGATTCATCGACAAGACCGTCGTGTCGACGCTGAGTCGGTGGTCGG
AC
Clustal Consensus
* ******* ********* ******* *** ********190 200 210 220 230 240 ....|....|....|....|....|....|....|....|....|....|....|....|
O.sativa_kao
CCGGAGTCCGGCCAGGTCGAGTTCCTCACCGAGCTCAGGCGCATGACCTTCAAGATCA
TC
O.meridionalis_kao
CCGGAGTCCGGCCAGGTCGAGTTCCTCACCGAGCTCAGGCGCATGACCTTCAAGATCA
TC
O.punctata_kao
CCGGACTCCGGCGAGTTCGAGTTCCTCACCGAGCTCCGACGTATGACCTTCAAGATCA
TC
O.officinalis_kao
CCGGACTCCGGCCAGGTGGAGTTCCTCACCGAGCTGCGACGGATGACGTTCAAGATCA
TC
O.australiensis_kao
CCGGAGTCCGGCGAGGTGGAGTTCCTCACCGAGCTCCGACGGATGACGTTCAAGATC
ATC
GAGCCAGCCGCCGAGGTCGAGTTCCTCACCGAGCTGCGCCGGATGACCTTCAAGATC
ATC
O.granulata_kao
CCCGGCGCAGGCGAGGTCGAGTTCCTCACCGAGCTCCGCCGCATGACGTTCAAGATC
ATC
L.tisserantti_kao T
CC---TCCGGCGAGATCAAATTCCTCACCGAGCTCCGCCGCATGACGTTCAAGATCATC
C.aquatica_kao
---GCCGGCGAGGTGGAGTTCCTCACGGAGCTGCGGCGGATGACCTTCAAGATCATT
R.subulata_kao
---GCCGGCGAGGTGGAGTTCCTCACCGAGCTGCGGCGGATGACGTTCAAGATCATC
L.leiocarpa_kao
---GGCGCCGGCGAGGTCGAGTTCCTCACCGAGCTCCGCCGCATGACCTTCAAGATCATC
E.erecta_kao
GGGGGGAAGGAGATGGAGTTGATCCTCACGGAGATGCGGCGGATGAACTTCAAGGTC
ATC
Clustal Consensus
* * *********** ******* **********250 260 270 280 290 300 ....|....|....|....|....|....|....|....|....|....|....|....|
O.sativa_kao
GTCCAGATCTTCATGAGCGGCGCCGACGACGCCACCATGGAGGCCCTGGAGCGGAGC
TAC
O.meridionalis_kao
GTCCAGATCTTCATGAGCGGCGCCGACGACGCCACCATGGAGGCCCTGGAGCGGAGC
TAC
O.punctata_kao
GTCCAGATCTTCATGAGCGGCGCCGACGACGCCACCATGGAGGCCCTCGAGCGGAGC
TAC
O.officinalis_kao
GTCCAGATCTTCATGAGCGGCGCCGACGACGCCACCATGGAGGCCCTGGAGCGGAGC
TAC
O.australiensis_kao
GTCCAGATCTTCATGAGCGGCGCCGACGATGCCACCATGGAGGCGCTGGAGCGGAGC
TAC
O.brachyantha_kao
GTCCAGATCTTCATGAGCGGCGCCGACGACCGCACCATGGAGGCCCTCGAGCGGAGC
TAC
O.granulata_kao
GTCCAGATCTTCATGAGCGGCGCCGACGACCGCACCATGGAGGCGCTGGAGCGGAGC
TAC
L.tisserantti_kao
GTCCAGATCTTCATGAGCGGCGCCGACGATCGAACAATGGAGGCATTGGAGAGGAGCT
AC
C.aquatica_kao
TAC
R.subulata_kao
GTCCAGATCTTCATGAGCGGCGCCGACGACCGTACCATGGAGGCGCTGGAGAGGAGC
TAC
L.leiocarpa_kao
GTCCAGATCTTCATGAGCGGCGCCGACGACCGCACCATGGAGGCGCTGGAGCGGAGC
TAC
E.erecta_kao
GTCGAGATCTTCATGGGCGGCGCCGACGACAAAATCATGGATGACCTAGAAGGAAGCT
AC
Clustal Consensus
*************************** * ****** *** *******310 320 330 340 350 360 ....|....|....|....|....|....|....|....|....|....|....|....|
O.sativa_kao
ACCGACCTCAACTACGGCATGCGCGCCATGGCCATCAACCTCCCCGGCTTCGCCTACT AC
O.meridionalis_kao
ACCGACCTCAACTACGGCATGCGCGCCATGGCCATCAACCTCCCCGGCTTCGCCTACT AC
O.punctata_kao
ACCGACCTCAACTACGGCATGCGCGCCATGGCCATCAACCTCCCGGGCTTCGCCTACC
AC
O.officinalis_kao
ACCGACCTCAACTACGGGATGCGCGCCATGGCCATCAACCTCCCAGGGTTCGCCTACC
AC
O.australiensis_kao
ACCGACCTCAACTACGGGATGCGCGCCATGGCCATCAACCTCCCCGGGTTCGCCTACC
AC
O.brachyantha_kao
ACCGACCTCAACTACGGCATGCGCGCCATGGCCATCAACCTCCCCGGCTTCGCCTACC
AC
O.granulata_kao
ACCGACCTCAACTACGGCATGCGCGCCATGGCCATCAACCTCCCGGGCTTCGCCTACC
AC
L.tisserantti_kao
ACCGATCTCAACTATGGGATGCGAGCCATGGCGATCAACATCCCCGGATTCGCCTACC
AT
C.aquatica_kao
ACCGACCTCAACTACGGCATGCGCGCCATGGCCATCAACCTCCCCGGCTTCGCCTACC
AC
R.subulata_kao
ACAGACCTCAACTACGGCATGCGCGCCATGGCCATCAACCTCCCCGGCTTCGCCTACC
AC
L.leiocarpa_kao
AC
E.erecta_kao
ACCGAGCTCAACTATGGCCTGCGCGCCATGGCTATCAACCTCCCCGGGTTCGCCTACC
AC
Clustal Consensus
************** **********************************370 380 390 400 410 420 ....|....|....|....|....|....|....|....|....|....|....|....|
O.sativa_kao
CGCGCGCTCAGGGCTCGCCGGAAGCTCGTGTCCGTGCTGCAGGGTGTGCTCGACGGC
CGG
O.meridionalis_kao
CGCGCGCTCAGGGCTCGCCGGAAGCTCGTGTCCGTGCTGCAGGGTGTGCTCGACGGT
CGG
O.punctata_kao
CGCGCCCTCAGGGCTCGCCGGAAGCTCGTCTCCGTCCTGCAGGGGGTGCTCCACGCC
AGG
O.officinalis_kao
CGCGCGCTCAGGGCTCGCCGGAAGCTGGTGTCCGTGCTGCAGGGGGTGCTCGACGG
CAGG
O.australiensis_kao
CGCGCGCTCAGAGCTCGCCGGAAGCTGGTGTCCGTGCTGCAGGGGGTGCTCGACGG
CAGG
O.brachyantha_kao
AGGGCGCTCCGGGCTCGCCGGAAGCTGGTGTCCGTGCTGCAGGGCGTGCTCGACGG
CAGG
O.granulata_kao
AGGGCGCTCAGGGCTCGCCGGCGGCTGGTGTCCGTGCTGCAGGGCGTGCTCGACAG
CAGG
L.tisserantti_kao
CGCGCTCTCAGGGCTCGCCGGAAGCTCGTCGCCGTTCTGCAGGGAGTTCTCGACGGC
AGG
C.aquatica_kao
AGGGCCCTCAAGGCTCGCCGGAAGCTGGTGTCCGTGCTGCAGGGCGTGCTGGACAGC
AGG
R.subulata_kao
AGGGCCCTCAAGGCTCGCCGGAAGCTGGTGTCCGTGCTGCAGGGTGTGCTGGACAGC
AGG
L.leiocarpa_kao
CGGGCGCTCAGGGCTCGCCGGAGGCTGGTCGCCGTGCTGCAGGCGGTGCTCAACGG
CCGG
E.erecta_kao
CGAGCTCTGAAATCTCGCAAGAAGCTAGTGTCTGCCATGCAGGCAATGCTGGACGGGA
GG
430 440 450 460 470 480 ....|....|....|....|....|....|....|....|....|....|....|....|
O.sativa_kao
AGGGCCGCCGCCGCC---AAGGGCTTCAAACGCTCCGGGGCCATGGACATGATGGACCGC
O.meridionalis_kao
AGGGCCGCCGCCGCC---AAGGGCTTCAAACGCTCCGGGGCCATGGACATGATGGACCGT
O.punctata_kao
AGGGCCGCCGCCGCC---AAGGGCTTCACACGCTCCACCGCCATGGACATGATGGACCGC
O.officinalis_kao
AGGGCGGCCGCCGCC---AATGGCTTCACACGCTCGGGCGCCATGGACATGATGGACCGC
O.australiensis_kao
AGGGCGGCCGCCGCC---AAGGGCTTCACCCGCTCGGGCGTCATGGACATGATGGACCGC
O.brachyantha_kao
AGGGCCGCCACGGCC---AAAGGCTTCACCCGGCCGACCACCATGGACATGATGGACCGC
O.granulata_kao
AGGGCGGCCACCACC---AAGGGCTTCACCCGCTCCAGCGCCATGGACATGATGGACCGC
L.tisserantti_kao
AGGGCGGCGGCGGCGGCGAAAGGGTTTAGAAGATCCGGCGCCATGGACATGATGGAT
AGG
C.aquatica_kao
AGGGCGGCGACGGGG---AAAGGGTTCACCCGGTCTAGCAGCATGGACATGATGGACCGG
R.subulata_kao
AGGGCCGCGACGGCC---AAAGGGTTCACCCGGTCGAGCAGCAGGGACATGATGGACCGG
L.leiocarpa_kao
AGGGCGGCGACGGCC---AAGGGCTTCACCCGGTCCAGCAGGATGGACATGATGGACCGG
E.erecta_kao
AGGACGGCGACGGCG---AAAGGATTCACCAGGTCGTCGGCCATGGACATGATGGACAGG
Clustal Consensus
****** * ******* * * ************* *490 500 510 520 530 540 ....|....|....|....|....|....|....|....|....|....|....|....|
O.sativa_kao
CTCATCGAGGCCGAGGACGAACGCGGCCGCCGCCTCGCCGACGACGAGATCGTCGAC
GTC
O.meridionalis_kao
CTCATCGAGGCCGAGGACGAACGCGGCCGCCGCCTCGCCGACGACGAGATCGTCGAC
GTC
O.punctata_kao
CTCATCGAAGCCGAGGACGACCGCGGCCGCCACCTCGCCGACGACGAGATCATCGAC
GTC
O.officinalis_kao
CTCATCGACGCCGAGGACGAGCGCGGCCGCCGCCTCGCCGACGACGAGATCATCGAC
GTC
O.australiensis_kao
CTCATCGAGGCCGAGGACGAGCGCGGCCGCCGCCTCGCCGACGACGAGATCATCGAC
O.brachyantha_kao
CTCATCGAGGCCCAGGACGAGCGCGGCCGCCGGCTCGCCGACGACGAGATCATCGAC
GTC
O.granulata_kao
CTCATCGAGGCCGAGGACGACCGCGGCCGCCGCCTCGCCGACGACGAGATCATCGAC
GTC
L.tisserantti_kao
CTTATCGAGGCTGAGGATGAGCGTGGACGGCGGCTCGCCGACGACGAGATCATCGAT
GTG
C.aquatica_kao
CTGATCGAGGCGGAGGACGAGCGCGGCCGGCGGCTGGCCGACGACGAGATCATCGA
CGTC
R.subulata_kao
CTGATCGAGGCCGAGGACGAGCGCGGCCGGCGGCTCGGCGACGACGAGATCATCGA
CGTC
L.leiocarpa_kao
CTGATCGAGGCGGAGGACGAGCGCGGCCGCCGCCTCGCCGACGACGAGATCATCGA
CGTC
E.erecta_kao
TTGATCGAGGTGGAGGATGAGCATGGGCGGCGGCTTAGAGACGATGAGATCATCGACA
TC
Clustal Consensus
******* ******* ***** ** *************** *550 560 570 580 590 600 ....|....|....|....|....|....|....|....|....|....|....|....|
O.sativa_kao
CTCATCATGTACCTCAACGCCGGCCACGAGTCCTCCGGCCACATCACCATGTGGGCCA
CC
O.meridionalis_kao
CTCATCATGTACCTCAACGCCGGCCACGAGTCCTCCGGCCACATCACCATGTGGGCCA
CC
O.punctata_kao
CTCATCATGTACCTCAACGCCGGCCACGAGTCCTCCGGCCACATCACCATGTGGGCCA
CC
O.officinalis_kao
CTCATCATGTACCTCAACGCCGGCCACGAGTCCTCCGGCCACATCACCATGTGGGCCA
CC
O.australiensis_kao
CTCATCATGTACCTCAACGCCGGCCACGAGTCCTCCGGCCACATCACCATGTGGGCCA
CC
O.brachyantha_kao
CTCATCATGTACCTCAACGCCGGCCACGAGTCCTCCGGCCACATCACCATGTGGGCCA
CC
O.granulata_kao
CTCATCATGTACCTCAACGCCGGCCACGAGTCCTCCGGCCACATCACCATGTGGGCCA
L.tisserantti_kao
CTCATCATGTACCTCAACGCCGGCCATGAATCTTCCGGCCATATCACCATGTGGGCCAC
C
C.aquatica_kao
CTCATCATGTACCTCAACGCCGGCCACGAGTCCTCCGGCCACATCACCATGTGGGCCA
CC
R.subulata_kao
CTCGTCATGTACCTCAACGCCGGCCATGAGTCCTCCGGCCACATCACCATGTGGGCCA
CC
L.leiocarpa_kao
CTCATCATGTACCTCAACGCCGGCCACGAGTCCTCCGGCCACATCACCATGTGGGCCA
CC
E.erecta_kao
CTCAACATGTACATCAACGCCGGCCACGAGTCCTCCATACACATCACCATGTGGGCTAC
T
Clustal Consensus
*** *************************** ******************610 620 630 640 650 660 ....|....|....|....|....|....|....|....|....|....|....|....|
O.sativa_kao
GTCTTCCTCCAGGAGAACCCCGACATCTTCGCAAGAGCAAAGGCTGAGCAAGAGGAGA
TC
O.meridionalis_kao
GTCTTCCTCCAGGAGAACCCCGACATCTTCGCAAGAGCAAAGGCTGAGCAAGAGGAGA
TC
O.punctata_kao
GTCTTCCTCCAAGAGAACCCCGACATCTTCGCAAGAGCAAAGGCGGAGCAAGAGGAGA
TC
O.officinalis_kao
GTCTTCCTCCAGGAGAACCCCGACATCTTCGCAAGAGCAAAGGCCGAACAAGAGGAGA
TC
O.australiensis_kao
GTCTTCCTCCAGGAGAACCCCGACATCTTCGCAACAGCAAAAGCGGAGCAAGAGGAGA
TC
O.brachyantha_kao
GTCTTCCTCCAGGAGAACCCCGACATCTTCGCAAGGGCAAAGGCTGAGCAAGAGGAGA
TC
O.granulata_kao
GTCTTCCTCCAGGAGAACCCCGACATCTTCGCAAGGGCCAAGGCGGAGCAAGAGGAG
ATC
L.tisserantti_kao
GTCTTCCTCCAGGAGAATCCCGACATCTTAGCAAGGGCAAAGGCTGAGCAAGAGGAGA
TC
C.aquatica_kao
GTCTTCCTGCAGGAGAACCCCGAAATCTTTGCAAGGGCAAAGGCCGAGCAAGAGGAGA
R.subulata_kao
GTCTTCCTCCAGGAGAACCCCGAAATCTTCGCAAGGGCAAAGGCCGAGCAAGAGGAAA
TC
L.leiocarpa_kao
GTCTTCCTGCAGGAGAACCCCGACATCTTCGCGAGGGCAAAGGCCGAGCAAGAAGAG
ATC
E.erecta_kao
TTTTTCCTGCAAGAGAACCCGGACGTATTAGCAAGGGCAAAGGCCGGGCAAGAGGAGA
TC
Clustal Consensus
***************** ****** ******* **********670 680 690 700 710 720 ....|....|....|....|....|....|....|....|....|....|....|....|
O.sativa_kao
ATGAGAAGCATTCCAGCAACGCAGAACGGATTAACCCTCAGGGACTTCAAGAAGATGC
AC
O.meridionalis_kao
ATGAGAAGCATTCCAGCAACGCAGAACGGATTAACCCTCAGGGACTTCAAGAAGATGC
AC
O.punctata_kao
ATGAGAAGCATACCAGCAACGCAGAAGGGATTAACGCTCAGGGACTTCAAGAAGATGC
AT
O.officinalis_kao
ATGAGAAGCATACCAGCAACGCAGAAGGGATTAACGCTCAGGGACTTCAAGAAGATGC
AC
O.australiensis_kao
ATGAGAAGCATACCAGCAACGCAGAAGGGATTAACCCTCAGGGACTTCAAGAAGATGC
GC
O.brachyantha_kao
ATGAGAAGCATACCCGCAACGCAGAAGGGACTGACACTCAGGGACTTCAAGAAGATGC
AG
O.granulata_kao
ATGAGAAGCATACCACCAACGCAGAAGGGACTCAACCTCAGGGACTTCAAGAAGATGC
AG
L.tisserantti_kao
ATGAGAAGCATACCACCAACGCAGAAGGGACTTACCCTTAGGGACTTCAAGAAGATGC
AC
C.aquatica_kao
ATGAGAAGCATACCACCAACACAGAAGGGACTGAACCTCAGGGACTTCAAGAAGATGC
AG
R.subulata_kao
ATGAGAAACATACCATCAACACAGAAGGGACTGAACCTCAGGGACTTCAAGAAGATGCA T
L.leiocarpa_kao
ATGAGAAGCATACCACCAACACAGAAGGGGCTGAGCCTCAGGGACTTCAAGAAGATGC
E.erecta_kao
ATGAGAAGC---CTGAGGGATTTCAGGAAGATGGAGClustal Consensus
******** ******************730 740 750 760 770 780 ....|....|....|....|....|....|....|....|....|....|....|....|
O.sativa_kao
TTCCTCTCACAGGTTGTCGACGAGACACTTCGCTGCGTCAACATCTCCTTCGTGTCCTT
C
O.meridionalis_kao
TTCCTCTCACAGGTTGTCGACGAGACACTTCGCTGCGTCAACATCTCCTTCGTGTCCTT
C
O.punctata_kao
TTCCTCTCACAGGTTGTCGACGAGACACTTCGCTGCGTCAACATCTCCTTCGTGTCCTT
C
O.officinalis_kao
TTCCTCTCACAGGTTGTCGACGAGACACTTCGCTGCGTCAACATCTCCTTCGTGTCCTT
C
O.australiensis_kao
TTCCTCTCACAGGTTATCGACGAGACACTTCGCTGCGTCAACATCTCCTTCGTGTCCTT
C
O.brachyantha_kao
TTCCTCTCCCAGGTTATCGATGAGACACTTCGCTGCGTCAACATCTCGTTCGTGTCATT
C
O.granulata_kao
TTCCTCTCGCAGGTTATCGACGAGACGCTTCGCTGCGTCAACATCTCGTTTGTGTCCTT
C
L.tisserantti_kao
TTCCTCCAGCAGGTTGTCGACGAGACACTTCGCTGCGTCAACATCTCCTTCGTGTCCTT
C
C.aquatica_kao
TACCTCTCACAGGTTATCGACGAGACACTTCGCTGCGTCAACATCTCCTTTGTGTCCTT
C
R.subulata_kao
TACCTCTCACAGGTTGTCGACGAGACACTTCGCTGCGTCAACATCTCGTTTGTGTCCTT
C
L.leiocarpa_kao
TACCTCTCACAGGTTATCGACGAGACGCTTCGCTTTGTCAACATCTCGTTTGTGTCCTTC
E.erecta_kao
TACCTCTCACATGTTATCGACGAGACACTTCGCTTCGTCAACATGTCCTTTTTGTCGTTC
Clustal Consensus
***** ********************* ************ *******790 800 810 820 830 840 ....|....|....|....|....|....|....|....|....|....|....|....|
O.sativa_kao
CGTCAGGCCACAAGAGACATCTTTGTGAACGGTTATCTTATCCCCAAGGGGTGGAAGG
O.meridionalis_kao
CGTCAGGCCACAAGAGACATCTATGTGAACGGTTATCTGATCCCCAAGGGGTGGAAGG
TT
O.punctata_kao
CGTCAGGCCACAAGAGACATCTATGTGAACGGCTATCTGATCCCCAAGGGGTGGAAGG
TC
O.officinalis_kao
CGTCAGGCCACAAGAGACATCTATGTGAACGGCTATCTGATCCCCAAGGGGTGGAAGG
TT
O.australiensis_kao
CGCCAGGCCACAAGAGACATCTATGTGAACGGCTATCTGATACCCAAGGGCTGGAAGG
TT
O.brachyantha_kao
CGTCAGGCGACCAGAGACGTCTATGTGAACGGCTATCTGATACCCAAGGGCTGGAAGG
TT
O.granulata_kao
CGTCGGGCGACAAGAGACGTCTATGTGAACGGTTATCTGATACCCAAGGGTTGGAAGG
TT
L.tisserantti_kao
CGTCAGGCGACAAAAGACGTCTATGTGAACGGCTATCTGATACCCAAGGGCTGGAAGG
TT
C.aquatica_kao
CGCCAAGCGACACGAGACGTCTTTGTGAACGGCTATCTGATACCAAAGGGCTGGAAGG
TT
R.subulata_kao
CGTCAGGCGACCCGAGACGCCTTCGTGAACGGCTATCTGATACCAAAGGGCTGGAAG
GTT
L.leiocarpa_kao
CGTCAGGCAACACGCGACGTCTATGTGAACGGTTATCTGATACCAAAGGGCTGGAAGG
TT
E.erecta_kao
CGCCAGGCAACAAAAGACGTCTTTGTGAATGGCTATCTGATACCAAAGGGTTGGAAGGT
G
Clustal Consensus
*** **** *** ** *****************************850 860 870 880 890 900 ....|....|....|....|....|....|....|....|....|....|....|....|
O.sativa_kao
CAGCTGTGGTACAGAAGTGTGCACATGGATGACCAAGTTTATCCTGACCCCAAAATGTT
C
O.meridionalis_kao
CAGCTGTGGTACAGAAGTGTGCACATGGATGACCAAGTTTATCCTGACCCAAAAATGTT
C
O.punctata_kao
CAGCTGTGGTACAGAAGTGTGCACATGGATGACCAAGTTTATCCTGACCCCAAAATGTT
O.officinalis_kao
CAGCTGTGGTACAGAAGTGTGCACATGGATGACCAAGTTTATCCTGACCCCAAAATGTT
C
O.australiensis_kao
CAGCTGTGGTATAGAAGTGTTCACATGGATGACCAAGTTTATCCTGACCCCAAAATGTT
C
O.brachyantha_kao
CAGCTGTGGTACAGAAGTGTACACATGGATGACCAAGTTTATCCTGACCCCAAAATGTT
C
O.granulata_kao
CAGCTGTGGTACAGAAGCGTGCACATGGATGACCAAGTTTATCCTGACCCCAAAGTATT
C
L.tisserantti_kao
CAGTTGTGGTACAGAAGTGTGCACATGGATGACCAAGTTTATCCTGACCCCAAAACGTT
C
C.aquatica_kao
CAGCTGTGGTACAGAAGTGTGCACATGGATCCTCAAGTTTACCCTGACCCCAACAAGTT
C
R.subulata_kao
CAGCTGTGGTACAGAAGCGTGCACATGGATTCTCAAGTTTACCCTGATCCCAAAAAGTT
C
L.leiocarpa_kao
CAGCTGTGGTACAGAAGTGTGCACATGGATCCTCAAGTTTATCCTGACCCCTACAAGTT
C
E.erecta_kao
CAGCTGTGGTTCAGAAATGTGCATATGGATCCTCAGGTTTATTCAGATCCCAGCAAGTT
C
Clustal Consensus
********* **** ********** ******* ***** **910 920 930 940 950 960 ....|....|....|....|....|....|....|....|....|....|....|....|
O.sativa_kao
AACCCTTCAAGATGGGAGGGACCCCCTCCGAAAGCCGGAACATTCCTTCCATTTGGAC
TG
O.meridionalis_kao
AACCCTTCAAGATGGGAGGGACCCCCTCCGAAAGCCGGAACATTCCTTCCATTTGGAC
TG
O.punctata_kao
AACCCTTCAAGATGGGAGGGCCCCCCTCCGAAAGCCGGAACATTCCTTCCATTTGGAC
TG
O.officinalis_kao
AACCCTTCAAGATGGGAGGGGCCCCCTCCGAAAGCCGGAACATTCCTTCCATTTGGAC
TG
O.australiensis_kao
AACCCTTCAAGATGGGAGGGTCCCCCTCCGAAAGCCGGAACATTCCTTCCATTTGGACT
O.brachyantha_kao
AATCCATCAAGATGGGAGGGTCCCCCGCCGAGAGCCGGAACATTCCTTCCATTTGGAC
TG
O.granulata_kao
AACCCATCAAGATGGGAGGGTCCCCCGCCGAGAGCTGGAACATTCCTTCCATTTGGAC
TG
L.tisserantti_kao
AACCCATCAAGATGGGAGGGTCCTCCGCCGAGAGCCGGAACATTCCTTCCATTTGGAC
TG
C.aquatica_kao
AACCCTTCAAGATGGGAGGGTCCCCCGCCGAGAGCCGGAACATTCCTTCCATTTGGAC
TG
R.subulata_kao
AACCCTTCAAGATGGGAGGGTCCCCCGCCGAGAGCCGGAACATTCCTTCCATTTGGAC
TG
L.leiocarpa_kao
AACCCTTCAAGATGGGAGGGTCCCCCGCCAAGAGCCGGAACATTCCTCCCATTTGGAC
TG
E.erecta_kao
AAGCCTTCAAGATGGGATGGTTCTTCACCGAGAGCCGGAACGTTCCTTCCATTCGGACT
G
Clustal Consensus
***************** * ****************************970 980 990 1000 1010 1020 ....|....|....|....|....|....|....|....|....|....|....|....|
O.sativa_kao
GGAGCAAGACTGTGCCCTGGAAATGATCTTGCAAAGCTGGAGATCTCTGTCTTCCTCCA
T
O.meridionalis_kao
GGAGCAAGACTGTGCCCTGGAAATGATCTTGCAAAGCTGGAGATCTCTGTCTTCCTCCA
T
O.punctata_kao
GGATCGAGACTGTGCCCTGGAAATGATCTTGCAAAGCTGGAGATCTCTGTCTTCCTCCA
T
O.officinalis_kao
GGAGCAAGACTGTGCCCTGGAAATGATCTTGCAAAGCTGGAGATCTCTGTCTTCCTCCA
T
O.australiensis_kao
GGAGCGAGGCTGTGCCCTGGAAATGATCTTGCAAAGCTGGAGATCTCTGTCTTCCTCC
AT
O.brachyantha_kao
GGAGCGAGACTGTGCCCTGGAAATGATCTTGCAAAGCTGGAGATCTCTGTCTTTCTCCA
T
O.granulata_kao
GGAGCGAGACTATGCCCTGGAAATGATCTTGCAAAGCTGGAGATCTCTGTCTTCCTCCA
L.tisserantti_kao
GGATCGAGACTGTGCCCTGGAAATGATCTTGCAAAGCTCGAGATCTCTGTCTTCCTCCA
T
C.aquatica_kao
GGAGCGAGACTCTGCCCTGGAAATGATCTTGCAAAGCTGGAGATCTCTGTCTTCCTCCA
T
R.subulata_kao
GGATCGAGACTCTGCCCTGGAAATGATCTTGCAAAGTTGGAGATCTCTGTCTTCCTCCA
T
L.leiocarpa_kao
GGAGCAAGGCTCTGCCCTGGAAATGATCTTGCAAAGCTGGAGATCTCTGTCTTCCTCCA
T
E.erecta_kao
GGTGCAAGACTGTGCCCTGGAAATGATCTTGCAAAGCTGGAGATCTCTGTCTTCCTCCA
C
Clustal Consensus
** *************************************************1030 1040 1050 ....|....|....|....|....|....|....|.