ANNONACEAE SUBSTITUTION RATES –
A CODON MODEL PERSPECTIVE
1LARS WILLEM CHATROU2, MICHAEL DAVID PIRIE3,4,
ROBIN VAN VELZEN5, FREEK THEODOOR BAKKER2
ABSTRACT - The Annonaceae includes cultivated species of economic interest and represents an important source of information for better understanding the evolution of tropical rainforests. In phylogenetic analyses of DNA sequence data that are used to address evolutionary questions, it is imperative to use appropriate
statistical models. Annonaceae are cases in point: Two sister clades, the subfamilies Annonoideae and
Malmeoideae, contain the majority of Annonaceae species diversity. The Annonoideae generally show a greater degree of sequence divergence compared to the Malmeoideae, resulting in stark differences in branch lengths in phylogenetic trees. Uncertainty in how to interpret and analyse these differences has led to inconsistent results when estimating the ages of clades in Annonaceae using molecular dating techniques. We ask whether these differences may be attributed to inappropriate modelling assumptions in the phylogenetic
analyses. Specifically, we test for (clade-specific) differences in rates of non-synonymous and synonymous
substitutions. A high ratio of nonsynonymous to synonymous substitutions may lead to similarity of DNA sequences due to convergence instead of common ancestry, and as a result confound phylogenetic analyses. We use a dataset of three chloroplast genes (rbcL, matK, ndhF) for 129 species representative of the family.
We find that differences in branch lengths between major clades are not attributable to different rates of
non-synonymous and non-synonymous substitutions. The differences in evolutionary rate between the major clades of Annonaceae pose a challenge for current molecular dating techniques that should be seen as a warning for the interpretation of such results in other organisms.
Index terms: Annonaceae, Branch lengths, Codon models, Non-synonymous substitution rate, Phylogenetics, Synonymous substitution rate.
1Palestra Anonáceas - V Congresso Internacional & Encontro Brasileiro sobre Annonaceae: do gene à exportação (19 a 23 de Agosto
de 2013). Botucatu-SP.
2Wageningen University, Biosystematics Group, Droevendaalsesteeg 1, 6708 PB. Wageningen, the Netherlands. E-mails:
lars.chatrou@wur.nl; freek.bakker@wur.nl
3Institut für Allgemeine Botanik, Johannes Gutenberg Universität Mainz, 55099 Mainz, Germany. E-mail: pirie@uni-mainz.de 4Department of Biochemistry, University of Stellenbosch, Private Bag X1, MATIELAND 7602, Stellenbosch, Western Cape, South
Africa.
5Wageningen University, Laboratory of Molecular Biology, Droevendaalsesteeg 1, 6708 PB Wageningen, the Netherlands. E-mail:
robin.vanvelzen@wur.nl
TAXAS DE SUBSTITUIÇÕES DAS ANNONACEAS –
UMA PERSPECTIVA DO MODELO CÓDON
RESUMO – A Família Annonaceae inclui espécies cultivadas de interesse econômico e representa uma importante fonte de informação para uma melhor compreensão da evolução das florestas tropicais. Em análises filogenéticas de dados de sequências de DNA que são utilizados para tratar de questões evolutivas, é imperativo usar modelos estatísticos apropriados. As Anonáceas são casos em questão: Dois clados irmãos, as subfamílias Annonoideae e Malmeoideae, contêm a maioria da diversidade da espécie anonáceas. As
Annonoideae geralmente apresentam um maior grau de divergência de seqüência em relação às Malmeoideae,
resultando em diferenças acentuadas nos comprimentos dos ramos em árvores filogenéticas. Incerteza sobre
como interpretar e analisar essas diferenças levou a resultados inconsistentes ao estimar as idades de clados
em Anonáceas utilizando-se técnicas de datação molecular. Foi perguntado se estas diferenças podem ser atribuídas a hipóteses de modelagem inadequadas nas análises filogenéticas. Especificamente, foi testado para (clado específico) diferenças nas taxas de substituições não sinônimas e sinônimas. Uma elevada proporção de substituições não-sinônimas para sinônimas pode levar à semelhança das seqüências de DNA, devido à convergência em vez de um ancestral comum, e, como resultado confundir a análise filogenética. Foi utilizado
um conjunto de dados de três genes de cloroplasto (rbcL, matK, ndhF) para 129 espécies representantes
da família. Verificou-se que as diferenças em comprimentos dos ramos entre os principais clados não são atribuíveis a diferentes taxas de substituições não-sinônimas e sinônimas. As diferenças na taxa evolutiva entre os principais clados de anonáceas representam um desafio para as atuais técnicas de datação molecular
que deve ser visto como um alerta para a interpretação de tais resultados em outros organismos.
INTRODUCTION
A variety of properties of Annonaceae that are useful to humans have been acknowledged for centuries. Edible fruits, such as cherimoya (Annona cherimola Mill.) have been transported in pre-Columbian times across tropical America
(POZORSKI and POZORSKI, 1997). Later, in colonial times tropical fruits were carried all
across the globe. By the 17th century, guanabana (Annonamuricata L.) was already well established as a crop in the Old World tropics(e.g. ALGRA and
ALGRA, 1978). In the 19th an 20th century, an era of many natural history explorations in the tropics, scientist documented the use of Annonaceae and showed the large extent to which species of this family are used on a local scale as food, medicine, construction material (e.g. BAILLON, 1868; FRIES, 1959).
These properties are still employed today, and research to document the way people exploit plant species is still advancing (e.g. VAN ANDEL, MYREN and VAN ONSELEN, 2012). Likewise, in the best tradition of the naturalists of the 19th and 20th century, the numerous observations on edible, medicinal and utilitarian Annonaceae continue to be reported on labels of herbarium sheets or in revisions and monographs (e.g. COUVREUR, 2009; MAAS and WESTRA, 1992). Many applied studies have focused on the cultivation of Annonas species and hybrids (e.g. GEORGE and NISSEN, 1987), providing a wealth of observations on patterns of variation, crossability of species, and selection of traits .
Insofar as these studies dealt with historical aspects, time spans involved were not that long, i.e. centuries. The history of cultivated Annonaceae over evolutionary timescales could nevertheless provide valuable and practical information. With the availability of DNA sequence data and the analytical toolbox offered by phylogenetics and population genetics, it has become feasible to explicitly test hypotheses on the evolutionary origin of the cultivated species of Annonaceae, on the origin of phenotypic traits, on phylogenetic relatedness of congeneric species, and on centres
of diversity and areas of origin of specific clades.
The early 21st century saw the first phylogenetic analyses of DNA sequence data, providing a test of previous classifications of the Annonaceae (DOYLE, BYGRAVE and LE THOMAS, 2000).
Recently, the classification of the Annonaceae has
been revised based on phylogenetic analyses of chloroplast DNA sequence data representing almost
all genera (CHATROU et al., 2012). This provides a general framework that allows us to zoom in on any clade of choice, such as those including cultivated species. Phylogenetic analyses have focused on species relationships and the geographic origin of ylang-ylang (Cananga odorata (Lam.) Hook.f. &
Thomson) and close relatives (SURVESWARAN et al., 2010). The phylogenetic tree of the Annona muricata L. and 21 congeners (including species of the former genus Rollinia; RAINER, 2007) has
been inferred based on cpDNA and SSR flanking
region sequences (CHATROU et al., 2009). Annona cherimola was not included in the latter analyses, which due to their limited sampling provide at best a coarse outline of the phylogenetic relationships in Annona.
The genus Annona belongs to the subfamily Annonoideae, which has also been referred to as the ‘long branch clade’ (PIRIE et al., 2005; RICHARDSON et al., 2004). The Annonoideae represents ca 60 % of the species diversity of the family, and are sister to subfamily Malmeoideae (the ‘short branch clade’) that contains ca 35% of the species diversity. Monophyly of both clades is well supported by maximum parsimony, maximum likelihood and Bayesian analyses (CHATROU et al., 2012). A curious phenomenon apparent from these results is that the average branch length, representing the degree of chloroplast DNA divergence, from the long branch crown node to tips is longer than that of the short branch clade (hence the informal names for these clades). There is no clear explanation for the differences in branch lengths. If they are interpreted at face value as representing real differences in molecular evolutionary rate, it is unclear in what manner (gradual or abrupt) and at what point subsequent to the divergence of their last common ancestor (immediately or more recently) such rate shift might have taken place (PIRIE and DOYLE, 2012). Uncertainty on this point has led to inconsistent age estimates derived from dating analyses using methods that make different assumptions about patterns of rate variation
(COUVREUR et al., 2011; PIRIE and DOYLE, 2012; RICHARDSON et al., 2004). Molecular dating analyses assuming autocorrelation of rates among lineages resulted in roughly equal ages for the crown nodes of short and long branch clades (66
how the pan-tropical distribution of Annonaceae originated, as well as representing a potential problem with this important tool – the time-calibrated phylogenetic tree – for evolutionary inference in general.
One aspect of the skewed branch length distribution that needs further scrutiny is whether the differences between the two subfamilies may be attributed to inappropriate modelling assumptions in the phylogenetic analyses. The differences in branch lengths, combined with the differences in clade sizes, might suggest a higher chloroplast DNA nucleotide substitution rate for the long branch clade. This phenomenon would be of particular interest as it has been demonstrated to be correlated to species richness in Proteaceae (DUCHENE and BROMHAM, 2013). Differences in substitution rate could be the result of overall increased rate, such as resulting from shorter generation time or
inherited differences in fidelity of DNA replication
(DRUMMOND et al., 2006), both of which are not obviously the case in Annonaceae. Alternatively, the occurrence of biparental inheritance of plastids would result in a doubled effective population size
Ne(as compared with uniparental transmission) and hence could affect substitution rates (CROSBY
and SMITH, 2012; DUCHENE and BROMHAM,
2013). Such an explanation would however be highly
speculative: biparental inheritance of plastidsis not
common in angiosperms and we have no evidence for the phenomenon in Annonaceae.
It is important to understand how branch lengths are modelled in our phylogenetic trees. In contrast with nucleotide models, codon models can be used for the detection of positive selection, or the assessment of silent and non-silent substitution rate shifts (e.g. YANG and NIELSEN, 2000). Where such phenomena are apparent, they can provide more accurate branch length estimation, expressed as substitutions per codon. For instance, extensive variation in silent substitution rates in plant mitochondrial DNA was inferred using codon models (BAKKER, BREMAN and MERCKX,
2006; MOWER et al., 2007), and in some cases it was found that the rate-variation was due entirely to silent substitutions. When inferring correlations between molecular evolutionary parameters and gross morphological trends, Lartillot and Poujol, (2011) made extensive use of codon models, as nucleotide models would have obscured several of the patterns the authors describe. Estimation of branch lengths on a phylogenetic tree becomes critical when using the estimates for subsequent dating analysis, for instance involving some fossil
calibration. Especially when dealing with large branch length differences on a phylogenetic tree, obtaining a good posterior distribution on rates can become flawed (DORNBURG et al., 2012; WERTHEIM, FOURMENT and KOSAKOVSKY POND, 2012), and are difficult to handle using current clock models.
Here we present new explorative analyses of chloroplast sequences of Annonaceae using codon models. We revisit published data and assessed whether that way more even branch length distributions between long and short branch clades can be obtained.
MATERIALS AND METHODS
A 129 sequence matrix comprising the
rbcL, matK and ndhF genes, representing all main Annonaceae clades, was compiled from CHATROU et al.,(2012), with some additional sequences that have been published in PIRIE et al., (2005), PIRIE et al., (2006), and WANG et al., (2012). The dataset included 66 species from the long branch clade (subfamily Annonoideae), 55 species from
the short branch clade (Malmeoideae), 7 species
from the basal grade of Annonaceae (subfamilies Ambavioideae and Anaxagoreoideae). Eupomatia bennetti F.Muell. (Eupomatiaceae) was assigned as outgroup. Sequences for all species were complete, i.e. there were no missing data. The dataset was subjected to RAxML (STAMATAKIS, 2006) analysis
using the GTR-Γ/CAT model at the CIPRES Science
Gateway (MILLER, PFEIFFER and SCHWARTZ, 2010), with a total of 100 bootstrap replicates performed. The dataset was not partitioned. The resulting ‘most likely’ phylogenetic tree was then used as input for subsequent codon modelling in PAML v. 4.5 (YANG, 2007), which was also used to produce dN and dS trees. The APE library (PARADIS, CLAUDE and STRIMMER, 2004) was applied in order to tabulate and compare branch lengths in this tree, in order to quantify overall branch length differences.
RESULTS AND DISCUSSION
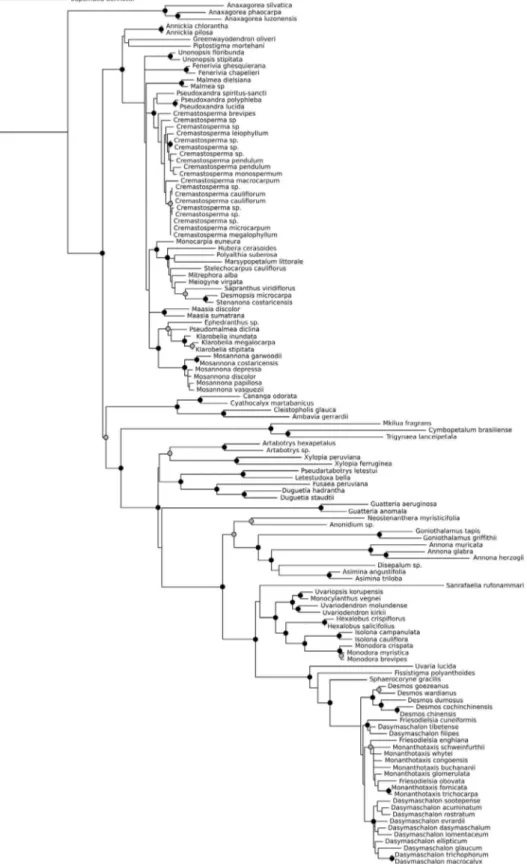
RAxML analysis of the 129 species data matrix resulted in the tree that is given in Fig. 1. The Malmeoideae (mean branch length = 0.00241) and
Annonoideae (mean branch length = 0.00724) clades appear to have a significantly different distribution of branch lengths (p < 0.0001; based on Student’s t-test; data not shown). The phylogenetic matrix
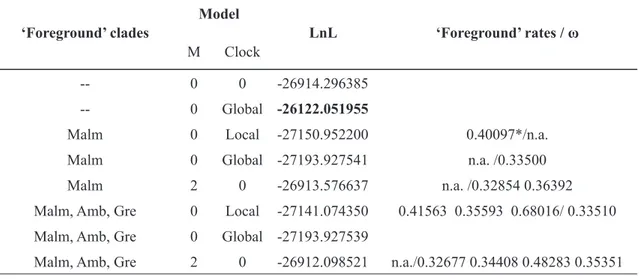
F3x4 codon frequency model was applied in PAML under various branch and site model combinations (Table 1). First we assessed whether clock differences across our tree can be inferred using branch lengths from codon models. Using M=0 (all branches assumed to have the same dn/ds ratio ω) the LnL of observing the codon data was calculated both with and without incorporating a (strict) global clock parameter. Perhaps surprisingly, ‘switching
on’ a global clock improved the LnL significantly,
indicating that under a codon model, no substantial rate differences can be observed across the tree used. Subsequently, the analysis was repeated with the Malmeoideae clade being allowed to have its own rate (‘foreground rate’). This resulted in worse model
fit, indicating that, given a codon model, a separate
model for Malmeoideae is unsupported by the data. With regards silent versus non-silent substitution rate differences we then set-up an analysis allowing
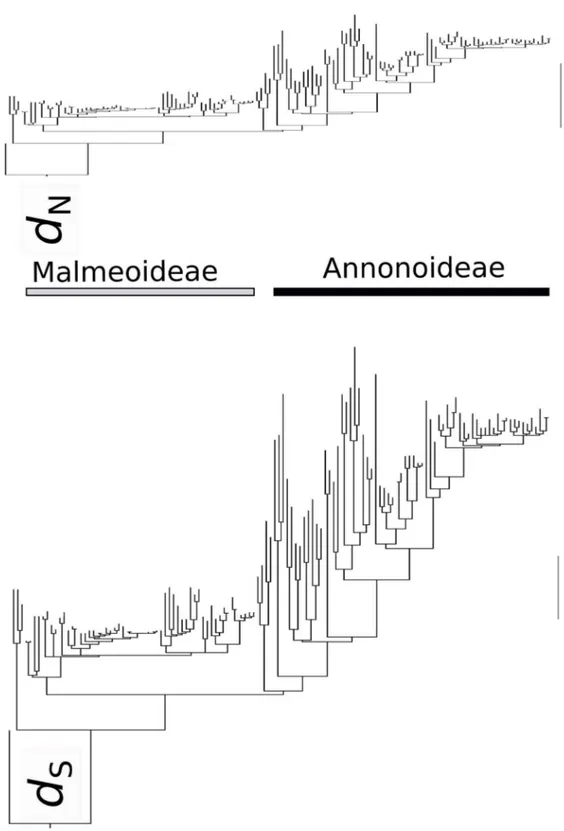
ω to vary between foreground and background clades (M=2). This resulted in slightly improved LnLs, indicating that there could be a difference in dn/ds ratio between Malmeoideae and the other main clades. However, upon visual inspection of the separate dn and ds trees (Fig. 2) there does not appear
to be such a difference: the disparity in branch lengths
is still apparent. It appears that the dn and ds change approximately in parallel across the tree. We note that PAML does not allow modelling both a clock and
different ω per branch simultaneously. Therefore, we
cannot conclude whether this would have improved the fit to the data further. Extending the PAML analyses to include additional foreground branches (i.e. Ambavioideae, Greenwayodendron) did not alter this pattern, indicating that the Malmeoideae
can be considered not to differ significantly from the
other clades, from the perspective of codon modelled branch lengths.
The dn and ds trees that we found mirror the branch length patterns that have been found in Annonaceae phylogenetics thus far, regardless of the phylogenetic inference method (CHATROU et al.,
2012; COUVREUR et al., 2011; RICHARDSON
et al., 2004). It allows eliminating a possible source of error in molecular dating analyses of the family. There are no underlying differences in synonymous and non-synonymous rates between the two major clades of the Annonaceae that could have caused the erroneous modelling of substitution rates in previous analyses. Strong convergence of chloroplast DNA sequences due to positive selection (as found in
reptile mitochondrial DNA, for example; CASTOE
et al., 2009), mimicking similarity by shared ancestry, can be ruled out as a possible confounding factor in
Annonaceae phylogenetics.
One unusual result of the RAxML analyses is the sister group relationship between the two subfamilies Annonoideae and Ambavioideae (Figure 1). The node connecting these two clades receives 94% bootstrap support. This contradicts previous, consistent, results of maximum parsimony, maximum likelihood and Bayesian analyses of various datasets, including those of much larger datasets containing more species as well as more sequence data (CHATROU et al., 2012; COUVREUR et al., 2011). These inferred a more basal position of Ambavioideae, as sister to a clade comprising Annonoideae and Malmeoideae. Various explanations are possible for the aberrant position of the Ambavioideae found in the RaxML analyses we present here. One might relate it to the reduced taxon sampling employed, both overall and in the exclusion of particular key taxa. Meiocarpidium lepidotum is a taxon whose absence (due to the unavailability of an ndhF sequence) in these analyses could conceivably be important. Meiocarpidium, a monotypic genus from Africa, is sister to the other species of the Ambavioideae, and its presence would have broken up the relatively long branch subtending this subfamily. The sampling of other, more derived, species of Ambavioideae is reduced too compared to Chatrou et al. (2012). However, the Malmeoideae/Annonoideae sister group relationship has been inferred consistently in previous analyses
(e.g. COUVREUR et al., 2008; PIRIE et al., 2006;
and in the many studies that use (more or less exclusively) coding data, particularly rbcL (also employed here) because it is widely available and easily aligned.
Having ruled out the possible effect of differences in non-synonymous and synonymous rates on branch length differences in Annonaceae, the question remains what possible mechanisms can cause the disparity, especially between Malmeoideae and Annonoideae. The answer to that question would have important repercussions, for example for the modelling of future molecular dating analyses. Firstly, it should be noted that we, and all studies on phylogenetics and molecular dating of Annonaceae so far, have analysed chloroplast DNA sequences. It would be important to investigate Annonaceae phylogenetics from a nuclear perspective, to
establish whether the lineage-specific effects that
we have observed so far would be upheld. Smith and Donoghue (2008), in the most comprehensive study of angiosperm substitution rates so far, found
lineage-specific differences by analysing nuclear,
mitochondrial and chloroplast data simultaneously. Though not mentioned explicitly, this concatenated
approach reflects the notion that lineage-specific
differences in substitution rates are manifest in all three plant genomes. In the absence of data from other genomes, this can be considered the standing
hypothesis for Annonaceae; it is however one that
should be tested.
Correlations have been suggested between substitution rates and generation time (GAUT et al., 2011, and references therein), and height of plants (LANFEAR et al., 2013). None of these mechanisms seem to be applicable to Annonaceae, however. Barraclough and Savolainen, (2001) and some additional studies reviewed in Gaut et al., (2011),
demonstrated the correlation between diversification
rate and molecular substitution rate. In Annonaceae, Erkens, Chatrou and Couvreur (2012) found an
increase in diversification rate in a large derived
clade within the Annonoideae, and a decrease in the Miliuseae, nested in the Malmeoideae, but the relationship was weak. We expect that further analyses of phylogenetic patterns in Annonaceae, based on a more intensive taxon and character sampling and on further scrutinizing of model assumptions, will allow us to disentangle the effects of substitution rates and time on branch lengths, and will start to unveil the mechanisms behind the branch lengths differences. In the absence of direct fossil evidence this may be our best hope of discerning between relaxed clock models and inferring accurately the ages of clades within Annonoideae and particularly Malmeoideae.
TABLE 1- Summary of the results of the PAML analyses. Malm = Malmeoideae, Amb = Ambavioideae, Gre = Greenwayodendron. * Relative rate, in substitutions per codon; background rates are
set to 1. The best LnL value is indicated in bold.
‘Foreground’ clades
Model
LnL ‘Foreground’ rates / ω
M Clock
-- 0 0 -26914.296385
-- 0 Global -26122.051955
Malm 0 Local -27150.952200 0.40097*/n.a.
Malm 0 Global -27193.927541 n.a. /0.33500
Malm 2 0 -26913.576637 n.a. /0.32854 0.36392
Malm, Amb, Gre 0 Local -27141.074350 0.41563 0.35593 0.68016/ 0.33510
Malm, Amb, Gre 0 Global -27193.927539
FIGURE 2- RAxML topology with PAML codon branch lengths (substitutions per codon), for non-synonymous (dn) and synonymous substitutions (ds) separately. Both trees have the same scale,
REFERENCES
ALGRA, A.; ALGRA, H. Dispereert niet. Twintig
eeuwen historie van de Nederlanden. Franeker: Uitgeverij T. Wever, 1978.
BAILLON, H.E. Anonacées: Histoire de plantes.
Paris: Hachette et Cie, 1868. v.1.
BAKKER, F.T.; BREMAN, F.; MERCKX, V. DNA
sequence evolution in fast evolving mitochondrial DNA nad1 exons in Geraniaceae and Plantaginaceae.
Taxon, Bratislava, v.55, n.4, p.887–896, 2006.
BARRACLOUGH, T.G.; SAVOLAINEN, V. Evolutionary rates and species diversity in flowering
plants. Evolution, Boulder, v.55, n.4, p.677-683, 2001.
CASTOE, T.A.; DE KONING, A.P.J.; KIM, H.-M.; GU, W.; NOONAN, B.P.; NAYLOR, G.J.P.; JIANG, Z.J.; PARKINSON, C.L.; POLLOCK,
D.D. Evidence for an ancient adaptive episode of convergent molecular evolution. Proceedings of the National Academy of Sciences of the United States of America, Washington, v.106, n.22, p.8986-8991, 2009.
CHATROU, L.W.; ESCRIBANO, M.P.; VIRUEL, M.A.; MAAS, J.W.; RICHARDSON, J.E.; HORMAZA, J.I. Microsatellite flanking regions
provide a new source of data for plant species-level phylogenetics. Molecular Phylogenetics and
Evolution, Philadelphia, v.53, p.726-733, 2009.
CHATROU, L.W.; PIRIE, M.D.; ERKENS, R.H.J.; COUVREUR, T.L.P.; NEUBIG, K.M.; ABBOTT, J.R.; MOLS, J.B.; MAAS, J.W.; SAUNDERS, R.M.K.; CHASE, M.W. A new subfamilial and
tribal classification of the pantropical flowering plant family Annonaceae informed by molecular phylogenetics. Botanical Journal of the Linnean Society, London, v.169, n.1, p.5-40, 2012.
C O U V R E U R , T. L . P. M o n o g r a p h o f t h e syncarpous African genera Isolona and Monodora (Annonaceae). Ann Arbor: The American Society of
Plant Taxonomists, 2009. 150p. (Systematic Botany
Monographs, 87).
COUVREUR, T.L.P.; PIRIE, M.D.; CHATROU, L.W.; SAUNDERS, R.M.K.; SU,Y.C.F.; RICHARDSON, J.E.; ERKENS, R.H.J. Early evolutionary history of the flowering plant family Annonaceae: steady diversification and boreotropical
geodispersal. Journal of Biogeography, Oxford,
v.38, n.4, p.664–680, 2011.
COUVREUR, T.L.P.; RICHARDSON, J.E.; SOSEF, M.S.M.; ERKENS, R.H.J.; CHATROU, L.W.
Evolution of syncarpy and other morphological
characters in African Annonaceae: a posterior
mapping approach. Molecular Phylogenetics and
Evolution, Philadelphia, v.47, p.302-318, 2008.
CROSBY, K.; SMITH, D.R. Does the mode of plastid inheritance influence plastid genome architecture? PLoS One, San Francisco, v.7, n.9, p.e46260, 2012.
DORNBURG, A.; BRANDLEY, M.C.; MCGOWEN, M.R.; NEAR, T.J. Relaxed clocks and inferences of
heterogeneous patterns of nucleotide substitution and divergence time estimates across whales and
dolphins (Mammalia: Cetacea). Molecular Biology
and Evolution, Oxford, v.29, n.2, p.721-736, 2012.
DOYLE, J.A.; BYGRAVE, P.; LE THOMAS, A.
Implications of molecular data for pollen evolution in
Annonaceae. In: HARLEY, M.M.; MORTON, C.M.;
BLACKMORE, S. Pollen and spores: morphology and biology. Kew: Royal Botanic Gardens, 2000. p.259-284.
DRUMMOND, A.J.; HO, S.Y.W.; PHILLIPS, M.J.;
RAMBAUT, A. Relaxed phylogenetics and dating
with confidence. PLoS Biology, San Francisco, v.4,
n.5, p.88, 2006.
CONCLUSIONS
We demonstrated that the two major clades of Annonaceae, the Annonoideae and the
Malmeoi-deae, have significantly different branch length
distributions. This difference, however, is not attri-butable to different rates of non-synonymous and synonymous substitutions. The differences in evo-lutionary rate between the major clades of Annona-ceae pose a challenge for current molecular dating
techniques, leading to conflicting results depending
DUCHENE, D.; BROMHAM, L. Rates of molecular evolution and diversification in plants: chloroplast
substitution rates correlate with species-richness in the Proteaceae. BMC Evolutionary Biology, London, v.13, n.1, p.65, 2013.
ERKENS, R.H.J.; CHATROU, L.W.; COUVREUR,
T.L.P. Radiations and key innovations in an early
branching angiosperm lineage (Annonaceae;
Magnoliales). Botanical Journal of the Linnean Society, London, v.169, n.1, p.117-134, 2012.
FRIES, R.E. Annonaceae. In: ENGLER, A.;
PRANTL, K. Die natürlichen Pflanzenfamilien.
2nd ed. Berlin: Duncker & Humblot, 1959. p.1-171.
GAUT, B.; YANG, L.; TAKUNO, S.; EGUIARTE,
L.E. The patterns and causes of variation in plant nucleotide substitution Rrates. Annual Review of
Ecology, Evolution, and Systematics, Palo Alto,
v.42, n.1, p.245-266, 2011.
GEORGE, A.P.; NISSEN, R.J. Propagation of
Annona species: A review. Scientia Horticulturae,
Amsterdam, v.33, p.75-85, 1987.
LANFEAR, R.; HO, S.Y.W.; DAVIES, T.J.; MOLES, A.T.; AARSSEN, L.; SWENSON, N.G.; WARMAN, L.; ZANNE, A.E.; ALLEN, A.P. Taller plants
have lower rates of molecular evolution. Nature Communications, London, v.4, p.1879, 2013.
LARTILLOT, N.; POUJOL, R. A phylogenetic
model for investigating correlated evolution of substitution rates and continuous phenotypic characters. Molecular Biology and Evolution,
Oxford, v.28, n.1, p.729-744, 2011.
MAAS, P.J.M.; WESTRA, L.Y.T. Rollinia. New York: The New York Botanical Garden, 1992. 188p. (Flora Neotropica monograph, v.57)
MILLER, M.A.; PFEIFFER, W.; SCHWARTZ, T.
Proceedings of the Gateway Computing Environments Workshop (GCE). Creating the CIPRES science gateway for inference of large phylogenetic trees.
New Orleans: IEEE, 2010. p.45-52.
MOWER, J.P.; TOUZET, P.; GUMMOW, J.S.; DELPH, L.D.; PALMER, J.D. Extensive variation
in synonymous substitution rates in mitochondrial genes of seed plants. BMC Evolutionary Biology,
London, v.7, p.135, 2007.
PARADIS, E.; CLAUDE, J.; STRIMMER, K. APE: Analyses of phylogenetics and evolution in R
language. Bioinformatics, Oxford, v.20, n.2,
p.289-290, 2004.
PIRIE, M.D.; CHATROU, L.W.; ERKENS, R.H.J.; MAAS, J.W.; VAN DER NIET, T.; MOLS, J.B.;
RICHARDSON, J.E. Phylogeny reconstruction and molecular dating in four Neotropical genera
of Annonaceae: the effect of taxon sampling in age estimation. In: BAKKER, F.T.; CHATROU, L.W.; GRAVENDEEL, B.; PELSER, P.B. Plant
species-level systematics: new perspectives on pattern
and process. Liechenstein: A.R.G. Gantner Verlag, 2005. p.149-174.
PIRIE, M.D.; CHATROU, L.W.; MOLS, J.B.; ERKENS, R.H.J.; OOSTERHOF, J.
‘Andean-centred’ genera in the short-branch clade of
Annonaceae: testing biogeographical hypotheses
using phylogeny reconstruction and molecular dating. Journal of Biogeography, Hoboken, NJ, v.33, n.1, p.31-46, 2006.
PIRIE, M.D.; DOYLE, J.A. Dating clades with fossils and molecules: the case of Annonaceae. Botanical Journal of the Linnean Society, London,
v.169, n.1, p.84-116, 2012.
POZORSKI, T.; POZORSKI, S. Cherimoya and
guanabana in the archaeological record of Peru.
Journal of Ethnobiology, Denton, v.17, n.2, p.235-248, 1997.
RAINER, H. Monographic studies in the genus
Annona L. (Annonaceae): Inclusion of the genus Rollinia A.St.-Hil. Annalen des Naturhistorischen Museums in Wien B, Vienna, v.108, p.191-205, 2007.
RICHARDSON, J.E.; CHATROU, L.W.; MOLS, J.B.; ERKENS, R.H.J.; PIRIE, M.D. Historical
biogeography of two cosmopolitan families of
flowering plants: Annonaceae and Rhamnaceae. Philosophical Transactions of the Royal Society B: Biological Sciences, London, v.359, n.1450,
p.1495-1508, 2004.
STAMATAKIS, A. RAxML-VI-HPC: maximum
likelihood-based phylogenetic analyses with thousands of taxa and mixed models. Bioinformatics,
Oxford, v.22, n.21, p.2688–2690, 2006.
SURVESWARAN, S.; WANG, R.J.; SU, Y.C.F.;
SAUNDERS, R.M.K. Generic delimitation and historical biogeography in the early-divergent
‘ambavioid’ lineage of Annonaceae: Cananga,
Cyathocalyx and Drepananthus. Taxon, Bratislava,
v.59, p.1721-1734, 2010.
VAN ANDEL, T.; MYREN, B.; VAN ONSELEN,
S . G h a n a ’s h e r b a l m a r k e t . J o u r n a l o f Ethnopharmacology, Philadelphia, v.140, n.2,
p.368-378, 2012.
WANG, J.; THOMAS, D.C.; SU, Y.C.F.; MEINKE, S.; CHATROU, L.W.; SAUNDERS, R.M.K.
A plastid DNA phylogeny of Dasymaschalon
(Annonaceae) and allied genera: Evidence for generic
non-monophyly and the parallel evolutionary loss of inner petals. Taxon, Bratislava, v.61, p.545-558,
2012.
W E RT H E I M , J . O . ; F O U R M E N T, M . ;
KOSAKOVSKY POND, S.L. Inconsistencies in estimating the age of HIV-1 subtypes due to heterotachy. Molecular Biology and Evolution, Oxford, v.29, n.2, p.451-456, 2012.
YANG, Z. PAML 4: Phylogenetic Analysis by
Maximum Likelihood. Molecular Biology and
Evolution, Oxford, v.24, n.8, p.1586-1591, 2007.
YANG, Z.; NIELSEN, R. Estimating synonymous
and nonsynonymous substitution rates under realistic evolutionary models. Molecular Biology and