Engineering
ISSN: 1809-4430 (on-line)
_________________________
1 Grupo de Pesquisa em Ciências Agro-Ambientais, Universidade Estadual do Oeste do Paraná/ Cascavel - PR, Brasil.
GEOCHEMICAL BACKGROUND IN AN OXISOL
Doi:http://dx.doi.org/10.1590/1809-4430-Eng.Agric.v37n3p565-573/2017
ADIR S. CEMBRANEL1, SILVIO C. SAMPAIO2*, MARCELO B. REMOR1,
JACKELINE T. GOTARDO1, PÁBOLLA M. DALLA ROSA1
2*Corresponding author.Grupo de Pesquisa em Ciências Agro-Ambientais, Universidade Estadual do Oeste do Paraná/ Cascavel - PR, Brasil. E-mail: [email protected]
ABSTRACT: Geochemical background establishment is indispensable to determine the actual state
of contamination of soils and sediments. However, no scientific consensus exists regarding the methodology for determining these values. In this context, this study aimed to establish the geochemical background in an Oxisol (Rhodic Hapludox) by means of an integrated method that uses direct and indirect soil analyses to identify the most appropriate calculation methodology. Soil samples were collected in a permanent preservation area of the Cascavel River watershed, PR, Brazil. The elements Cd, Co, Cr, Cu, Fe, K, Mg, Mn, Na, Ni, Pb, and Zn present in soil samples were quantified by flame atomic absorption spectrometry. The use of a permanent preservation area is the most effective method to establish the geochemical background in the Cascavel River watershed. However, soil chemical element concentrations have spatial variability and dependence, requiring the application of non-parametric statistical methods based on third quartile and median for establishing the geochemical background.
KEYWORDS: trace elements, heavy metals, sediment, soil.
INTRODUCTION
Trace elements are found in soils, sediments, and even in places without anthropic interference, being their existence dependent on weathering processes and characteristics of soil formation rocks (NANOS & RODRÍGUEZ MARTÍN, 2012). In environmental studies, natural concentrations of chemical elements are commonly called geochemical background. Human activities, such as mining, vehicle traffic, agriculture, industries, wastewater treatment stations, landfills, among others, increase the concentrations of trace elements in soils and sediments above geochemical background (HERNÁNDEZ-CRESPO & MARTÍN, 2015). In aquatic environments, trace elements bind to colloidal particles and, through sedimentation, accumulate in sediments. Therefore, the knowledge of geochemical background is important to determine the actual state of contamination of environments.
Different approaches have been developed to determine geochemical background. Methods are usually classified into direct or indirect, as well as methods that integrate both forms (DUNG et al., 2013). Direct methods use the means or medians of trace element concentrations in samples from the pre-industrial era or preserved areas to estimate geochemical background (GALUZSKA & MILASZEWSKI, 2011). In contrast, indirect methods use a large number of samples, statistical tools, and spatial analysis to separate, within a data set, the geochemical background of values related to anthropogenic contamination (HERNÁNDEZ-CRESPO & MARTÍN, 2015). The use of direct methods is criticized for requiring a specialized knowledge of the sampling area, with a possible subjectivity in sample selection, uncertainty regarding the actual state of area preservation (GALUZSKA & MIGASZEWSKI, 2011), in addition to not considering the variability and natural distribution of trace elements in soils and sediments. Indirect methods, on the other hand, are expensive, require large amounts of samples and analyses, and do not represent the actual concentrations because the data are often subject to statistical treatments. Thus, integrated methods that combine both direct and indirect approaches demonstrate a greater convenience and reliability.
more reliable geochemical background. For instance, JUCHEN et al. (2014) sampled preserved areas (legal reserves) and used parametric statistical analysis, REIMANN et al. (2005) proposed an approach composed by sampling in different locations and application of non-parametric and spatial statistical analysis, and PAYE et al. (2012) sampled in areas without anthropic action and used multivariate statistics.
In this context, this study aimed to establish the geochemical background in an Oxisol (Rhodic Hapludox) by means of an integrated method, identifying the most appropriate calculation methodology for the Cascavel River watershed, PR, Brazil.
MATERIAL AND METHODS Study area
The Cascavel River watershed (Figure 1) is part of the Iguaçu River watershed and is located between the parallels 24°37’ and 25°04’ S and the meridians 53°22’ and 53°28’ W in Cascavel, the western region of Paraná State, Brazil. This watershed has a total area of 117.50 km2 and the main riverbed has an extension of 17.85 km. Land use and occupation in the Cascavel River drainage area consist of by urban areas (33.84%), where the main river springs are located, as well as agricultural areas (36.84%) and forest and reservoirs (29.34%), as shown in Figure 1.
FIGURE 1. Land use and occupation, study area location, and soil sampling points in the Cascavel river watershed.
Collection and preparation of samples
phytogeographic formation Mixed Ombrophilous Forest. Thus, collection sites were established in areas with a dense native forest cover since they are more likely to be remnants of a primary forest. At each site, nine simple soil samples were randomly collected at a depth of 0–0.2 m and 9 samples at a depth of 0.2–0.4 m. These single samples were dried at ambient temperature (25–35°C) in a closed environment. After drying and declodding, 200 g of each of the nine simple samples from each site at different depths were homogenized in a plastic container, forming 22 composite soil samples, one for each depth at each site.
Physicochemical analysis
Particle size analysis was performed with the combination of sedimentation and sieving tests, according to ABNT (1984). The concentration of chemical elements was determined by flame atomic absorption spectrophotometry in the silt/clay fraction (<63 µm), as recommended by the World Health Organization (WHO, 1982). For this, soil samples were sieved in PVC and nylon sieves with a 63-µm mesh.
Total extraction of the elements cadmium (Cd), cobalt (Co), chromium (Cr), copper (Cu), iron (Fe), potassium (K), magnesium (Mg), manganese (Mn), sodium (Na), nickel (Ni), lead (Pb), and zinc (Zn) was carried out by wet method, according to the method 3050B by USEPA (1996). Data accuracy was verified by applying analysis methods to samples of certified reference materials IAEA 356 and IAEA 433 (marine sediment), in which results were concordant with a minimum confidence level of 95%.
Data analysis
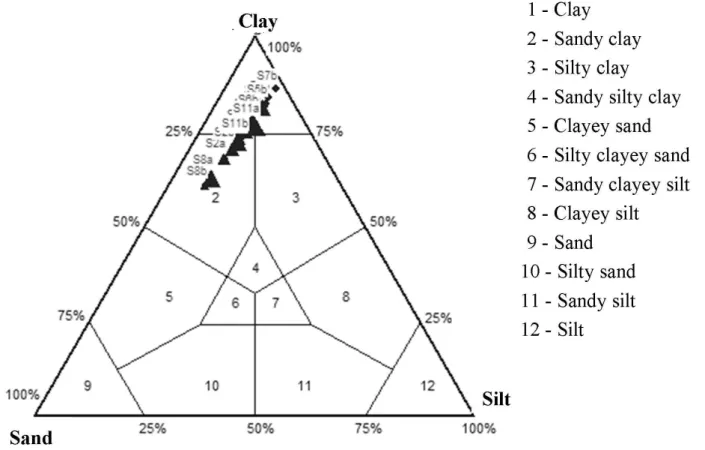
Data from the particle size analysis of soil samples for texture determination were interpreted by means of Shepard diagram and using the R package rysgran (GILBERT et al., 2012) from the statistical software R.
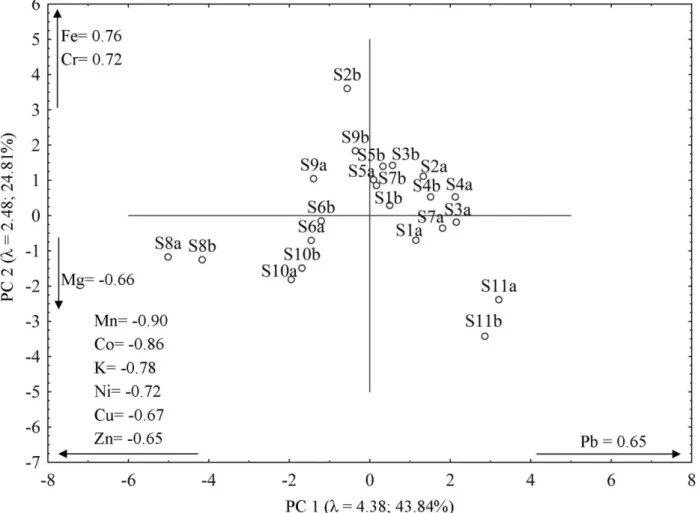
The set of original chemical variables of soil samples was simultaneously summarized in a single Principal Component Analysis (PCA). This analysis reduces the set of original variables in a set of Principal Components (PCs), which seeks to maintain the maximum variability of the original set. PCA was performed on the Pearson correlation matrix of variables and the criterion for PC retention adopted was the broken-stick, i.e. with eigenvalues higher than the expected at random (JACKSON, 1993). In order to interpret the meaning of the retained PCs of the original variables, only Pearson correlation coefficients higher than 65% were considered.
Tukey’s boxplot graph was used to identify outliers in the data set of each variable. After outlier quantification, the percentage was calculated as a function of the number of observations of the respective variable.
Soil geochemical background (SGB) were calculated according to [eq. (1)], as in HERNÁNDEZ-CRESPO & MARTÍN (2015) and REMOR et al. (2015); [eq. (2)], as in REDON et al. (2013); [eq. (3)], as in REIMANN et al. (2005) and ANDER et al. (2013); and [eq. (4)], as in REIMANN et al. (2005) and ROTHWELL & COOKE (2015).
SGB = + σ (1)
where,
is the mean and σ is the standard deviation.
SGB = + (2 × σ) (2)
SGB = Q3 + 1.5 × (Q3− Q1) (3)
where,
SGB = Q2 + (2 × MAD) (4) where,
Q2 is the median and MAD is the median absolute deviation.
MAD = 1.4826 × Q2i (|Xi− Q2j(Xj)|) (5)
where,
Q2i is the median, Xi is the sample value, and Q2j(Xj) is the median of the variable.
RESULTS AND DISCUSSION
Results of particle size analysis were used to classify soil samples for texture. Shepard diagram (Figure 2) shows that 16 of the 22 samples have a clayey texture, corroborating the results found by GONÇALVES et al. (2012) and SANTOS et al. (2015) in an Oxisol of western Paraná. Moreover, six samples from sites S2, S8, and S10 presented sandy clay texture. However, soil samples at both depths (0–0.20 and 0.20–0.40 m) of these collection points did not present distinct textures, which is probably due to soil spatial heterogeneity.
FIGURE 2. Textural composition of soil samples from the Cascavel River watershed according to Shepard diagram.
significant statistical difference between the factor and its levels (JACKSON, 1993).
FIGURE 3. Principal component analysis of soil chemical variables of the Cascavel River watershed.
The elements that compose PC 1, especially Cu and Zn, are in general associated with the anthropogenic origin (ESMAEILI et al., 2014). However, the positive correlation with Mn indicates that these metals are complexed to manganese oxides and have a geogenic origin. Manganese oxides have a permanent negative structural charge due to the substitution from Mn+4 to Mn+2, in addition to presenting a high specific surface area, favoring cation adsorption, such as Cu+2, Co+2, Ni+2, Zn+2, among others (PORTO et al., 2014). Concentrations of Co and Ni (PC 1) and Cr (PC 2) in soils depend on the parent rock content (NANOS & RODRÍGUEZ MARTÍN, 2012), being the concentration of these metals higher in basic and ultrabasic rocks (FACCHINELLI et al., 2001; RODRÍGUEZ-MARTÍN et al., 2013a). In addition, the anthropic inputs of Cr and Ni are usually lower than their concentrations in soil (FACCHINELLI et al., 2001; RODRÍGUEZ-MARTÍN et al., 2013b). Concentrations of chemical elements in soil samples from PPA of the Cascavel River watershed have a spatial variability of geogenic origin caused by the natural heterogeneity of soil in the region, as observed by means of PCA (Figure 3).
when the number of outliers is less than 10%, being used by ANDER et al. (2013) and McILWAINE et al. (2014). The second method (Equation 4) is based on the median and MAD and it is indicated when the number of outliers is greater than 15%, providing more conservative estimations of SGB (ROTHWELL & COOKE, 2015; ESMAEILI et al., 2014). If the number of outliers is between 10 and 15%, the equation choice is at researcher discretion.
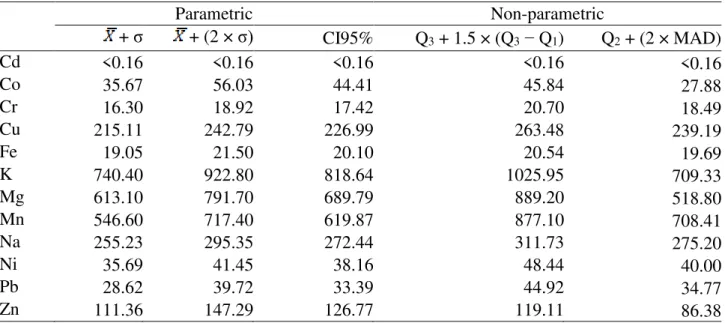
TABLE 1. Soil geochemical background in the Cascavel River watershed (concentrations in ppm, except Fe in %).
Parametric Non-parametric
+ σ + (2 × σ) CI95% Q3 + 1.5 × (Q3− Q1) Q2 + (2 × MAD)
Cd <0.16 <0.16 <0.16 <0.16 <0.16
Co 35.67 56.03 44.41 45.84 27.88
Cr 16.30 18.92 17.42 20.70 18.49
Cu 215.11 242.79 226.99 263.48 239.19
Fe 19.05 21.50 20.10 20.54 19.69
K 740.40 922.80 818.64 1025.95 709.33
Mg 613.10 791.70 689.79 889.20 518.80
Mn 546.60 717.40 619.87 877.10 708.41
Na 255.23 295.35 272.44 311.73 275.20
Ni 35.69 41.45 38.16 48.44 40.00
Pb 28.62 39.72 33.39 44.92 34.77
Zn 111.36 147.29 126.77 119.11 86.38
Mean; σ: Standard deviation; IC95%: Confidence interval; Q3: Third quartile; Q1: First quartile; Q2: Median; MAD: Median
absolute deviation (Equation 5)
Concentrations of soil chemical elements from PPA of the Cascavel River watershed presented spatial heterogeneity, as observed in PCA (Figure 3). Thus, the guidelines proposed by REIMANN & FILZMOSER (2000) and REIMANN et al. (2005) to establish the geochemical background were adopted. The SGB of Cr, Cu, K, Mg, Mn, Na, Ni, and Pb was established with the results expressed by Equation 4 whereas the SGB of Co, Fe, and Zn was established with the results expressed by Equation 5 (Table 1 and 2) since these elements presented a number of outliers greater than 15% of the data set. The element Cd could not be quantified because it presented concentrations below the limit of quantification (0.16 ppm). When the analytical results are lower than the limit of quantification (LQ), a <LQ should be chosen as the SGB of the substance and exclude it from the other procedures of statistical interpretation (CONAMA, 420/2009).
TABLE 2. Geochemical background in Paraná State, Brazil, and Global Geochemical Background – GGB (concentration in ppm, except Fe in %).
Cascavel River(1) Paraná River(2) Ivinhema River(2) Verdadeiro RiverSão Francisco (3) GGB(4)
Cd <0.16 <0.16 1.60 0.07 0.30
Co 27.88 32.60 80.40 * 19.00
Cr 20.70 39.50 34.20 52.40 90.00
Cu 263.48 52.40 98.40 212.30 45.00
Fe 20.54 * * * 8.65
K 1025.95 2846.00 1260.00 * 26600.00
Mg 889.20 3590.00 2600.00 * 15000.00
Mn 887.10 552.00 415.50 916.40 850.00
Na 311.73 258.00 665.00 * 9600.00
Ni 48.44 17.50 39.70 30.26 68.00
Pb 44.92 25.90 20.70 17.46 20.00
Zn 86.38 66.10 105.40 82.14 95.00
(1)This study; (2)REMOR et al. (2015); (3)JUCHEN et al. (2014); (4)TUREKIAN & WEDEPOHL (1961); *: Not assessed.
When comparing the SGBs obtained in the Cascavel River watershed with other SGBs established by REMOR et al. (2015) and JUCHEN et al. (2014) in Paraná State, different trace element concentrations can be observed. This difference is even greater when SGB is compared with GGB. The concentration of chemical elements in soil is influenced mainly by the type and mineralogical properties of the source material (parent rock), as well as physical, chemical, and biological processes by which the soil was formed, in addition to the proportion of mineral constituents in the solid phase (NANOS & RODRÍGUEZ MARTÍN, 2012). The different soil formation factors generate a great spatial variability, thus making it necessary to establish regional SGBs to assess soil contamination.
CONCLUSIONS
The use of soil samples from permanent preservation areas is the most efficient source to establish the geochemical background of the Cascavel River watershed. However, soil chemical element concentrations of this watershed have spatial variability and dependence, requiring the application of non-parametric statistical methods based on third quartile and median for establishing geochemical background. Therefore, the determination of these values is a significant step to assess properly the degree of soil and sediment contamination of the watershed, in addition to guiding public policies aiming at preserving water source areas taking into account the degree of soil and sediment contamination.
ACKNOWLEDGEMENTS
The authors are grateful for the financial support from CNPq (National Council for Scientific and Technological Development), CAPES (Coordination for the Improvement of Higher Education Personnel), UNIOESTE (State University of West Paraná), and PGEAGRI (Graduate Program in Agricultural Engineering).
REFERENCES
ANDER, E.L.; JOHNSON, C.C.; CAVE, M.R.; PALUMBO-ROE, B.; NATHANAIL, C.P.; LARK, R.M. Methodology for the determination of normal background concentrations of
contaminants in English soil. Science of The Total Environment, New York, v. 454–455, p. 604– 618, jun. 2013. DOI: 10.1016/j.scitotenv.2013.03.005
DUNG, T.T.T.; CAPPUYNS, V.; SWENNEN, R.; PHUNG, N.K. From geochemical background determination to pollution assessment of heavy metals in sediments and soils. Reviews in
Environmental Science and Bio/Technology, Dordrecht, v. 12, p. 335–353, dez. 2013. DOI:
10.1007/s11157-013-9315-1
ESMAEILI, A.; MOORE, F.; KESHAVARZI, B.; JAAFARZADEH, N.; KERMANI, M. A geochemical survey of heavy metals in agricultural and background soils of the Isfahan industrial zone, Iran. Catena, Giessen, v. 121, p. 88–98, out. 2014. DOI: 10.1016/j.catena.2014.05.003 FACCHINELLI, A.; SACCHI, E.; MALLEN, L. Multivariate statistical and GIS-based approach to identify heavy metal sources in soils. Environmental Pollution, Oxford, v. 114, p. 313–324, out. 2001. DOI: 10.1016/S0269-7491(00)00243-8
GALUZSKA, A.; MIGASZEWSKI, Z.M. Geochemical background – an environmental
perspective. Mineralogia, Bologna, v. 42, n. 1, p. 7–17, 2011. DOI: 10.2478/v10002-011-0002-y GILBERT, E.R.; CAMARGO, M.G.; SANDRINI NETO, L. rysgran: Grain size analysis,
textural classifications and distribution of unconsolidated sediments. R package version 2.0.
2012.
GONÇALVES, M.S.; SAMPAIO, S.C.; COELHO, S.R.M.; SUSZEK, F.L.; CORDOVIL, C.M.S. Atrazine bound residues formation and dissipation in subtropical soil under swine wastewater application. Engenharia Agrícola, Jaboticabal, v. 32, n. 6, p. 1156-1164. nov./dez. 2012. HERNÁNDEZ-CRESPO, C.; MARTÍN, M. Determination of background levels and pollution assessment for seven metals (Cd, Cu, Ni, Pb, Zn, Fe, Mn) in sediments of a Mediterranean coastal lagoon. Catena, Giessen, v. 133, p. 206–214, out. 2015. DOI: 10.1016/j.catena.2015.05.013 JACKSON, D.A. Stopping Rules in Principal Components Analysis: A comparison of heuristical and statistical approaches. Ecology, v. 74, n. 8, p. 2204-2214, dez. 1993. DOI: 10.2307/1939574 JUCHEN, C.R.; VILAS BOAS, M.A.; POLETO, C.; MACEDO, M. Use of legal reserve areas as geochemical background in hydrosedimentology studies. Revista Brasileira de Ciência do Solo, Viçosa, MG, v. 38 n. 6, nov./dez. 2014. DOI: 10.1590/S0100-06832014000600029
McILWAINE, R.; COX, S.F.; DOHERTY, R.; PALMER, S.; OFTERDINGER, U.; MCKINLEY, J.M. Comparison of methods used to calculate typical threshold values for potentially toxic
elements in soil. Environmental Geochemistry and Health, Andover, v. 36, n. 5, p. 953–971, out. 2014. DOI: 10.1007/s10653-014-9611-x
NANOS, N.; RODRÍGUEZ MARTÍN, J.A. Multiscale analysis of heavy metal contents in soils: spatial variability in the Duero river basin (Spain). Geoderma, New York, v. 189–190, p. 554–562, nov. 2012. DOI: 10.1016/j.geoderma.2012.06.006
PAYE, H.S; MELLO, J.W.V.; MELO, S.B. Métodos de análise multivariada no estabelecimento de valores de referência de qualidade para elementos-traço em solos. Revista Brasileira de Ciência
do Solo, Viçosa, MG, v. 36, n. 3, p. 1031-1041, maio/jun. 2012. DOI:
10.1590/S0100-06832012000300033
PORTO, L.J.L.S.; ALMEIDA, C.N.; DEZOTTI, M.W.C.; CORRÊA, J.A.C.; FAIAL, K.C.F.; FAIAL, K.R.F. Distribuição de metais pesados nos sedimentos de fundo dos rios Caceribu e
REDON, P.O.; BUR, T.; GUIRESSE, M.; PROBST, J.L.; TOISER, A.; REVEL, J.C.; JOLIVET, C.; PROBST, A. Modelling trace metal background to evaluate anthropogenic contamination in arable soils of south-western France. Geoderma, New York, v. 206, p. 112–122, set. 2013. DOI: 10.1016/j.geoderma.2013.04.023
REIMANN, C., FILZMOSER, P., GARRETT, R.G., 2005. Background and threshold: critical comparison of methods of determination. Science of the Total Environment, New York, v. 346, n. 1–3, p. 1–16, jun. 2005. DOI: 10.1016/j.scitotenv.2004.11.023
REIMANN, C.; FILZMOSER, P. Normal and lognormal data distribution in geochemistry: death of a myth. Consequences for the statistical treatment of geochemical and environmental data.
Environmental Geology, Berlin, v. 39, n. 9, p. 1001–1014, jul. 2000. DOI:
10.1007/s002549900081
REMOR, M.B.; SAMPAIO, S.C.; DAMATTO, S.R.; CASTILHOS, Z.C.; STEVAUX, J.C.; VILAS BOAS, M.A.; DOS REIS, R.R. Geochemistry of the Upper Paraná River floodplain: study of the Garças Pond and Patos Pond. Journal of Radioanalytical and Nuclear Chemistry, Lausanne, v. 305, n. 2, p. 409-418, ago. 2015. DOI: 10.1007/s10967-015-4021-9
RODRÍGUEZ-MARTÍN, J.A.; CARBONELL, G.; NANOS, N.; GUTIÉRREZ, C. Source
Identification of Soil Mercury in the Spanish Islands. Archives of Environmental Contamination
and Toxicology, Berlin, v. 64, n. 2, p. 171-179, fev. 2013b. DOI: 10.1007/s00244-012-9831-y
RODRÍGUEZ-MARTÍN, J.A.; RAMOS-MIRAS, J.J.; BOLUDA, R.; GIL, C. Spatial relations of heavy metals in arable and greenhouse soils of a Mediterranean environment region (Spain).
Geoderma, New York, v. 200–201, p. 180–188, jun. 2013a. DOI: 10.1016/j.geoderma.2013.02.014
ROTHWELL, K.A.; COOKE, M.P. A comparison of methods used to calculate normal background concentrations of potentially toxic elements for urban soil. Science of The Total Environment, New York, v. 532, p. 625–634, nov. 2015. DOI: 10.1016/j.scitotenv.2015.06.083
SANTOS, D.; SOUZA, E.G.; NÓBREGA, L.H.P.; BAZZI, C. L.; QUEIROZ, F.N. Physical properties of soils and soybean yields after planting cover crops. Engenharia Agrícola, Jaboticabal, v. 35, n. 2, p. 280-292, mar./abr. 2015. DOI: 10.1590/1809-4430
TUREKIAN, K.K.; WEDEPOHL, K.H. Distribution of the Elements in Some Major Units of the Earth's Crust. Geological Society of America Bulletin, New York, v. 72, p. 175-192, fev. 1961. DOI: 10.1130/0016-7606(1961)72[175:DOTEIS]2.0.CO;2
USEPA - UNITED STATES ENVIRONMENTAL PROTECTION AGENCY. Method 3050B.
Acid digestion of sediments sludges and soils. USEPA, 1996. CD-ROM.