ISSN 0104-6632 Printed in Brazil
www.abeq.org.br/bjche
Vol. 26, No. 01, pp. 171 - 180, January - March, 2009
Brazilian Journal
of Chemical
Engineering
PREDICTION OF LIQUID–LIQUID EQUILIBRIA
FOR POLYETHYLENE GLYCOL BASED
AQUEOUS TWO-PHASE SYSTEM BY
ASOG AND UNIFAC METHOD
M. Perumalsamy
1*and T. Murugesan
21
Department of Chemical Engineering, National Institute of Technology, Trichy-620015, India.
2
Chemical Engineering Programme, University Technology Petronas, Bandar Seri Iskandar, 31750, Tronoh, Perak, Malaysia.
E-mail: [email protected]
(Submitted: February 25, 2008 ; Accepted: July 4, 2008)
Abstract - Liquid-Liquid equilibrium data were obtained for the polyethylene glycol2000(PEG2000)-sodium citrate-water system at 298.15, 308.15 and 318.15 K. The effect of temperature on binodal and tie line data was studied and published in a previous article (Murugesan and Perumalsamy, 2005). The interaction parameters of ASOG and UNIFAC models were estimated using the LLE data of PEG2000-sodium citrate-water system and are used to predict the LLE data for PEG6000-sodium citrate-citrate-water system at 298.15, 308.15 and 318.15 K (literature data). The predicted LLE data by both ASOG and UNIFAC models showed good agreement with the experimental and literature data.
Keywords: Liquid-Liquid equilibria; Polyethylene glycol; Sodium citrate; ASOG; UNIFAC
INTRODUCTION
Liquid-liquid extraction has been gaining importance in biochemical engineering as a result of the development of aqueous two-phase systems for the purification and isolation of macromolecules, such as protein, recombinant DNA, nucleic acid and antibiotics etc., Aqueous two-phase systems are formed when two hydrophilic components are mixed with water at above the threshold concentration (Albertsson, 1971). Due to their high water content, aqueous two-phase systems provide a gentle and protective environment for the separation/ purification of biological materials. Aqueous two-phase systems were first applied by Albertsson (1971) to recover biomolecules. Generally the salt based aqueous two phase systems (ATPS) were made using polyethylene glycol with salt consisting
reported in a previous article (Perumalsamy and Murugesan, 2007). Porto et al (2008) used PEG/Citrate systems to remove proteases from a
Clostridium perfringens fermentation broth. Tubio et al (2007) studied the effect of different factors such as polyethyleneglycol molecular weight, pH, tie line length, temperature and the presence of an inorganic salt on the protein partition coefficient. Recently Zafarani-Moattar et al. (2008) measured the equilibrium data of aqueous polypropylene glycol(PPG)-sodium citrate system at different temperatures, and used Merchuk expression for reproducing the experimental binodal data. In the present work, the group contribution methods, namely, Analytical Solution Of Groups (ASOG) and UNIversal Functional Activity Coefficient (UNIFAC) method were used for the prediction of the behavior of aqueous PEG6000–sodium citrate-water system, where the interaction parameters of the system were estimated using the LLE data of PEG2000-sodium citrate-water system. The liquid-liquid equilibrium data and the phase behaviour for PEG2000-sodium citrate-water system at 298.15, 308.15 and 318.15K temperatures were reported in a previous article (Murugesan and Perumalsamy, 2005). The literature data were taken from Zafarani-Moattar et al.(2004). They measured the equilibrium data of aqueous PEG6000-sodium citrate system at different temperatures, however, they made use of osmotic virial and UNIQUAC equations with or without Debye-Huckel term
Several models for the activity coefficient have been proposed for the polymer-polymer systems, but only few attempts only have been made for the thermodynamic modeling of aqueous polymer-inorganic salt systems. Aqueous polymer-salt systems have several advantages over the polymer-polymer systems due to the larger differences in density, greater selectivity, lower viscosity, lower cost and the larger relative size of the drops (Franco et al, 1996). Due to the size differences between the smaller molecules of salt and the polymer, the thermodynamic behavior of polymer-salt systems is more complicated. Several models for the estimation of activity coefficients have been proposed, involving the combinatorial and free volume effects in one term. There are mainly two kinds of models based on osmotic virial expansions and lattice theories proposed in literature. Osmotic virial expansions, using the osmotic pressure of a solvent in the solution, have been used in describing the phase behavior of two-phase systems. Edmond and Ogston (1968) proposed a virial expansion to predict phase diagrams of aqueous mixtures of Polyethylene
glycol and Dextran . King et al. extended this model and used for the prediction of biomolecule partitioning whereas Haynes et al. (1989) included a higher order virial coefficient in the above model to obtain a phase diagram [King et al., (1988), Haynes et al., (1989), Wu et al., (1996)].
The prediction of phase diagrams of polymer – polymer systems is mainly based on the Flory – Huggins theory, the UNIQUAC and the UNIFAC model [Haghtalab., (2001), Fredenslund., (1977)]. They are the widely used Lattice models. The extended UNIQUAC, UNIFAC and NRTL models have also been used for the prediction of phase behavior of the aqueous two-phase polymer-salt systems. In the present work, Liquid-Liquid equilibrium data were obtained for the polyethylene glycol2000(PEG2000)-sodium citrate-water system at 298.15, 308.15 and 318.15 K. The effect of temperature on binodal and tie line data was studied and published in a previous article (Murugesan and Perumalsamy, 2005). The UNIFAC and ASOG (Analytical Solution of Groups) method suggested by and Kojima and Tochigi, [Novak et al., (1987), Kojima et al., (1979)], was applied for the prediction of phase behavior of the aqueous PEG6000-sodium citrate-water system at equilibrium.
THERMODYNAMIC FRAMEWORK
Several models are available for the calculation of activity coefficients. Some are empirical such as those proposed by Margules and Van Laar (Noval et al., 1987); others, use the local composition concept, such as Wilson (1964) and NRTL (Renon and Prausnitz, 1968); still others, such as UNIQUAC (Haynes et al, 1989), have a more theoretical basis; and finally, some, such as ASOG (Derr and Deal, 1969; Kojima and Tochigi, 1979) and UNIFAC (Fredenslund et al, 1977), use the group contribution method, in which the activity coefficients are calculated from the contributions of the various groups making up the molecules of the solution. The concept of local composition states that due to intermolecular forces and differences in molecular sizes the composition of the system in the neighbourhood of a given molecule is not the same as that of bulk composition.
Prediction of Liquid–Liquid Equilibria for Polyethylene Glycol Based Aqueous Two-Phase System 173
determined experimentally, only certain thermodynamic models can be used, where the interaction parameters are determined from the behavior of a real system. The ASOG method (Kojima, 1979) as well as the UNIFAC method (Fredenslund, 1977) has found a wide application in practice.
ASOG and UNIFAC methods have a wide range of applications with temperatures between 2ºC and 155ºC, pressures upto 10 atm. This approach was mainly used for vapour-liquid equilibria at normal operating conditions. In the present case the UNIFAC interaction parameters used are those estimated using vapour-liquid equilibrium data obtained under normal operating conditions. The same parameters can be used for the prediction of solid-liquid equilibria also, but liquid-liquid equilibria cannot be predicted using the same interaction parameters. Hence, it was necessary to develop a unique (Magnussen et al, 1981) parameter table based on liquid-liquid equilibrium data, which is the major limitation of the model (Renon et al, 1968).
A given activity coefficient model should be able to predict any type of equilibrium using the same available parameters. Fredenslund et al (1977) compiled the UNIFAC group interaction parameters based on VLE data, which cannot be extended for the prediction of liquid-liquid equilibria. Hence it was necessary to estimate the interaction parameters for every liquid-liquid system involved. Moreover, the group contribution approach for mixtures with polymers is different from core UNIFAC, and hence it requires completely new interaction parameters to be estimated. Oishi and Prausnitz (1978) successfully applied the UNIFAC model for the polymer solutions.
The ASOG and UNIFAC methods are based on the assumption that the contribution to the activity coefficient of component i can be separated into two parts, namely, combinatorial part and residual part.
ln γi = ln γi C + ln γi R (1) The size or shape of the molecule is accounted in the combinatorial part and the actual interaction between the groups is accounted in the residual part. Since the contribution of the combinatorial part to the overall activity coefficient is small, it is mostly considered for mixture of molecules of various sizes.
ASOG Method
The group fraction is defined as
N i ki i 1 k N g
i mi i 1 m 1
x v X x v = = = =⎛ ⎞ ⎜ ⎟ ⎜ ⎟ ⎝ ⎠
∑
∑ ∑
(2)where νki is the content of the group k in molecules of component i, N is the number of components and g is the number of various groups in the mixture.
( )
(
)
g
i R
i mi m m m 1
ln v ln ln
=
γ =
∑
Γ − Γ (3) where Γm is the activity coefficient of group m in the mixture and Γm(i) is the activity coefficient of group m in pure compound i.The Flory – Huggins equation is used for the estimation of combinatorial part of the activity coefficient,
N FH
C FH FH i
i i i j N FH j 1
j j j 1
1 v
ln ln v ln x v
x v =
=
− γ = −
∑
+∑
(4)where νi FH
is the measure of the size of molecule i, defined as the number of atoms in the molecule (except for hydrogen atoms). The value of νki represents the number of atoms (other than hydrogen atoms), in group k of substance i.
(
)
g g
k km
m n mn g
n 1 n 1
n kn n 1
X a
ln 1 ln X a
X a = = = ⎛ ⎞ ⎜ ⎟ ⎜ ⎟ Γ = − − ⎜ ⎟ ⎜ ⎟ ⎜ ⎟ ⎝ ⎠
∑
∑
∑
(5)These parameters were evaluated as temperature dependent using the expression
mn mn mn ln a
T
β
= α + (6) which holds for m=n that αmn = βmn = 0.
UNIFAC Method
UNIQUAC equation is used for the estimation of the combinatorial part,
C i i i i
i i
i i i i
ln 1 ln
ln 1 zq 1
x x 2
⎛ Φ Φ ⎞ ⎛ Φ Φ ⎞ γ =⎜ + − ⎟− ⎜ + − ⎟
θ θ
⎝ ⎠ ⎝ ⎠ (7)
where i i i N i i i 1 x r x r = Φ =
∑
i i i N i i i 1 x q x q = θ =∑
(8)Quantities qi and ri are proportional to the surface area and volume of molecule i, found on the basis of values Rk and Qk of the corresponding individual groups in the i-th molecule using the relationship
g i ki k
k 1
r v R
=
=
∑
g i ki k
k 1
q v Q
=
=
∑
(9)where νki is the number of k groups in the molecule of component i
g g g
g k mk
m m k mk g
g k 1 k 1
jk k j 1
ln Q 1 ln
= =
=
⎧ ⎛ ⎞⎫
⎪ ⎜ ⎟⎪
⎛ ⎞
⎪ ⎜ Θ Ψ ⎟⎪
⎪ ⎜ ⎟ ⎪
Γ = ⎨ − ⎜ Θ Ψ ⎟− ⎜ ⎟⎬ ⎜ ⎟ ⎪ ⎝ ⎠ Θ Ψ ⎪
⎜ ⎟
⎪ ⎜ ⎟⎪
⎪ ⎝ ⎠⎪
⎩ ⎭
∑
∑
∑
(10)where gk k K g j j j 1 X Q Q X = Θ =
∑
(11)and the interaction parameter Ψjk is considered to be temperature dependent having the following form
jk jk a exp T − ⎛ ⎞ Ψ = ⎜ ⎟
⎝ ⎠ (12)
The Surface and Volume Parameters
For PEG, the values for the volume and surface parameters, which are required in the UNIFAC equation, are estimated using group contribution method as adopted by Van Krevelen and Hoftyzer (1976) and are given in Table 1. The values of
volume and surface parameters for Na+ were reported by H. Zerres et al.(1994); whereas the same for citrate ion were estimated by M.T. Zafarani Moattar (2004), using group contribution method. The estimated values of volume and surface for Na+ and citrate ions are also given in Table 1.
Estimation of Model Parameters
The equilibrium data for PEG 2000-sodium citrate-water system at different temperatures were used to estimate the interaction parameters of the ASOG and the UNIFAC equations by minimizing the following objective function:
( ) ( )
( )
(
) (
)
(
)
(
) (
)
(
)
2 1 1 i 1 1 ii 1 1 i
2 2 2 i 2 2 i
i 2 2 i
2 3 3 i 3 3 i
i 3 3 i
x x O.F x x x x x x x Ι ΙΙ ΙΙ Ι ΙΙ ΙΙ Ι ΙΙ ΙΙ
⎡⎡ γ − γ ⎤⎤ ⎢⎣ ⎦⎥ = ⎢ ⎥ +
γ
⎢ ⎥
⎣ ⎦
⎡⎡ γ − γ ⎤⎤ ⎢⎣ ⎦ +⎥ ⎢ γ ⎥
⎢ ⎥
⎣ ⎦
⎡⎡⎢ γ − γ ⎤⎥⎤ ⎢⎣ ⎦⎥ ⎢ γ ⎥
⎢ ⎥ ⎣ ⎦
∑
∑
∑
(13)where I and II represent the two aqueous phases, and j is the number of tie lines and the equilibrium condition used is
(xiγi)I = (xiγi)II (14) The values of the interaction parameters obtained using the ASOG method is given in Table 2 and 3 and that of UNIFAC method is given in Table 4. Using the estimated interaction parameters, the phase diagrams for PEG6000-sodium citrate-water system at different temperatures were predicted. The average deviation of the predicted results by UNIFAC method and ASOG method are given in Table 5 and 6 respectively. The deviation is defined by the following equation: N exp cal i i i 1 1
Dev x x *100
N =
=
∑
− (15)Prediction of Liquid–Liquid Equilibria for Polyethylene Glycol Based Aqueous Two-Phase System 175
Table 1: Group parameter for PEG, salt and water
Group H2O CH2OH CH2OCH2 Na+ Sodium citrate
Rk 0.920 1.674 1.593 0.095 5.764
Qk 1.400 1.740 1.320 0.143 5.116
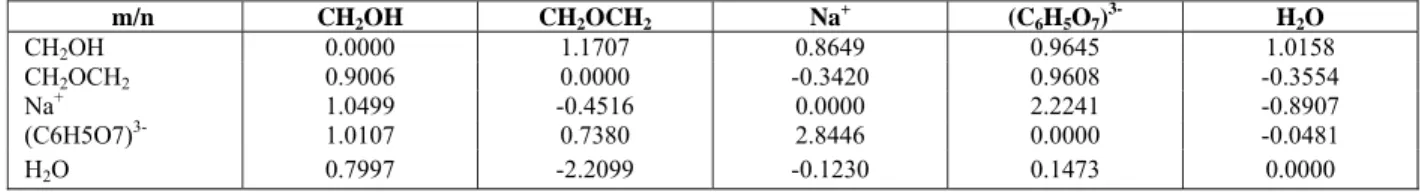
Table 2: Interaction parameter αmn of ASOG method for the system PEG2000(1)–sodium citrate(2)-water(3) m/n CH2OH CH2OCH2 Na+ (C6H5O7)3- H2O
CH2OH 0.0000 1.1707 0.8649 0.9645 1.0158
CH2OCH2 0.9006 0.0000 -0.3420 0.9608 -0.3554
Na+ 1.0499 -0.4516 0.0000 2.2241 -0.8907
(C6H5O7)3- 1.0107 0.7380 2.8446 0.0000 -0.0481
H2O 0.7997 -2.2099 -0.1230 0.1473 0.0000
Table.3: Interaction parameter βmn of ASOG method for the system PEG2000(1)–sodium citrate(2)-water(3) m/n CH2OH CH2OCH2 Na+ (C6H5O7)3- H2O
CH2OH 0.0000 1.0004 0.9995 0.9999 1.00099
CH2OCH2 0.9996 0.0000 0.9944 0.9997 1.01773
Na+ 1.0003 0.9976 0.0000 1.0033 0.98619
(C6H5O7)3- 1.0001 1.0003 1.0081 0.0000 0.99186
H2O 0.9993 0.9875 0.9936 0.9963 0.00000
Table 4: Interaction parameters ajk of the UNIFAC equation for the PEG2000(1)-sodium citrate(2)-water(3) system
j/k CH2OH CH2OCH2 Na+ (C6H5O7)3- H2O
CH2OH 0.0000 3.7541 1.9622 17.2052 1.9845
CH2OCH2 6.4244 0.0000 68.1963 725.0347 15.0194
Na+ 0.0279 -23.2776 0.0000 -53.8425 27.4332
(C6H5O7)3- 1.6738 -84.8722 -63.2657 0.0000 186.1067
H2O 1.7457 7.8546 -8.1667 -224.8808 0.0000
Table 5: Comparison of experimental results with the calculated results using UNIFAC method for the PEG-sodium citrate-water based system.
S.No ATPS System
PEG Average molecular
weight
T(K)
Average Deviation
(%)
Maximum Deviation
(%)
Overall Deviation
(%)
Reference
298.15 0.6538 0.7021 308.15 0.4467 0.4903 1 PEG2000-sodium
citrate-water 2000
318.15 0.6869 0.7217
0.5958 Murugesan and Perumalsamy (2005)
298.15 0.6926 0.8546 308.15 1.0064 1.2863 2 PEG6000-sodium
citrate-water 5886
318.15 0.9363 1.2578
0.8784 Zafarani-Moattar et al (2004)
Table 6: Comparison of the experimental results with the calculated results using ASOG method for the PEG-sodium citrate-water based system.
S.No ATPS System
PEG Average molecular
weight
T(K)
Average deviation
(%)
Maximum Deviation
(%)
Overall Deviation
(%)
Reference
298.15 0.7783 0.8216 308.15 0.8482 0.8956 1 PEG2000-sodium
citrate-water 2000
318.15 0.9210 0.9723 0.8492
Murugesan and Perumalsamy
(2005) 298.15 0.8568 0.9279
308.15 1.0908 1.2651 2 PEG6000-sodium
citrate-water 5886
318.15 2.0547 2.3698
RESULTS AND DISCUSSION
The binodal data, representing the minimum concentration required for the formation of two phases at temperatures 293.15, 303.15 and 313.15 K and the tie line compositions at temperatures 293.15, 303.15 and 313.15 K were determined. The LLE data for PEG2000-sodium citrate-water system at different temperatures and the effect of temperature on phase behaviour were described in an earlier article (Murugesan and Perumalsamy, 2005) .The effect of temperature on the binodal curves of the investigated aqueous PEG2000-sodium citrate system is represented in Fig.1, which shows that an increase in temperature expands the two-phase area of binodal curve. The experimental tie line data at 298.15 K are shown in Fig. 2, as an example. Also the effects of temperature on tie line data are shown in Fig. 3. The Figure shows that the slope and the length of the tie line increases with temperature rises. In aqueous two-phase system, PEG and salt are predominantly present in the top and bottom phase respectively, due to the increase in hydrophobicity of PEG molecules with increase in temperature. Voros et al.(1993) and Mishima et al. (1995) reported similar results for other aqueous PEG-salt systems.
The obtained deviations showed that both ASOG and UNIFAC methods can be satisfactorily used to
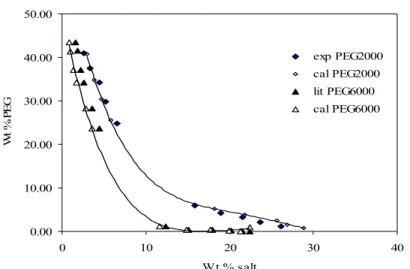
predict the LLE data of the PEG (with different molecular weights)-sodium citrate–water systems at the studied temperature range. The model parameters were estimated from PEG2000-sodium citrate-water system based LLE data and they were used to predict the PEG6000-sodium citrate-water system based LLE data. Hence it is proved that both ASOG and UNIFAC models can predict the dependence of the phase diagram on the polymer molecular weights using only one set of parameters. A comparison between the experimental and calculated data by ASOG and UNIFAC method is shown in Fig. 4 and 5 respectively for the PEG-sodium citrate-water based systems. In Fig 4 and 5, the points are the experimental results and the curves represent the values calculated using the ASOG and UNIFAC methods respectively. Figures 4 and 5 show that the binodal moves towards the lower concentrations with an increase in the polymer molecular weight. Thus the group contribution approach for the prediction of phase equilibria can be satisfactorily applied to PEG2000-sodium citrate-water based aqueous two-phase systems containing various groups of components. In the present work both ASOG and UNIFAC models showed good agreement with the experimental data for the polymer-salt based aqueous two-phase system at different temperatures and estimating new interaction group parameters.
Prediction of Liquid–Liquid Equilibria for Polyethylene Glycol Based Aqueous Two-Phase System 177
Figure 2: Phase diagram for the PEG2000-sodium citrate-water system at 298.15 K
Figure 3: Effect of temperature on the tie lines for the PEG2000-sodium citrate–water system
0.00 10.00 20.00 30.00 40.00 50.00
0 5 10 15 20 25 30 35
Wt % salt
W
t %
P
E
G
exp PEG2000 cal PEG2000 lit PEG6000 cal PEG6000
0.00 10.00 20.00 30.00 40.00 50.00
0 10 20 30 40
Wt % salt
W
t %
P
E
G
exp PEG2000
cal PEG2000
lit PEG6000 cal PEG6000
Figure 5: Comparison of the experimental tie line data with the calculated values using ASOG method for the PEG-sodium citrate-water based system at 308.15K
CONCLUSION
The binodal data and tie line data for the system PEG2000-sodium citrate-water at 298.15, 308.15 were obtained. The effect of temperature on LLE data has been studied. It was found that the expansion of two-phase area was observed with an increase in temperature. It was also observed that the slope and length of the tie lines increased with increasing temperature. Further, the group contribution methods, namely, Analytical Solution Of Groups (ASOG) and UNIFAC method were used to predict the behavior of aqueous PEG 6000–sodium citrate system. The interaction parameters were estimated using the LLE data of PEG2000–sodium citrate system and associated with the existing VLE parameters. Hence these models seem to be more convenient to predict the dependence of the phase diagram on molecular weight. Even though, the correlated results of both models show satisfactory agreement with the experimental data, this agreement was slightly better, when UNIFAC method was employed.
ACKNOWLEDGEMENTS
The Authors wish to express their appreciation to CSIR for their financial assistance for the purchase of chemicals and to Anna University for the award of Teaching and Research Associate Fellowship to Muthiah Perumalsamy for the support of this investigation.
NOMENCLATURE
List of Symbols
ao, a1, a2 coefficients amn, akn interaction parameters
defined in eqn (7)
g number of groups
n refractive index
N number of components
O.F objective function
qi volume of molecule i Qk relative surface area of
group k
ri surface area of molecule i Rk relative volume of group k
W weight fraction
xi mole fraction of component i
X group fraction
z coordination number
Greek Letters
γ activity coefficient
Γ group activity coefficient
αmn, βmn interaction parameter between group m and n
νki content of the group k in molecules of
component i
Prediction of Liquid–Liquid Equilibria for Polyethylene Glycol Based Aqueous Two-Phase System 179
φi volume fraction
Ψmk parameter in the UNIFAC equation
Subscripts
m, n, i, j, k
groups, polymer, salt and water
p, s polymer, salt
Superscripts
C, R combinatorial, residual cal calculated exp experimental
g group k
(i) pure compound i FH Flory – Huggins
REFERENCES
Albertsson, P. A., Partition of cell particles and macromolecules, Second ed., Interscience/Wiley, New York (1971).
Derr, E. L., Deal, C. H., Analytical solution of groups: Correlation of activity coefficients through structural group parameters, Inst. Chem. Eng. Symp. Ser., 32, p. 44 (1969).
Edmond E., Ogston A. G., An approach to the study of phase separation in ternary aqueous systems, Biochem. J., 109, p. 569-576 (1968).
Franco, T. T., Andrews, T. A., Asenjo, J. A., Use of chemically modified proteins to study the effect of a single protein property on partitioning in aqueous two-phase systems: effect of surface hydrophobicity, Biotech. Bioeng. 49, p. 300-308 (1996).
Fredenslund, A., Gmehling, J., Rasmussen, P., Vapour – Liquid Equilibria using UNIFAC, Elsevier, Amsterdam (1977).
Haghtalab, A., Mokhtarani, B., On extension of UNIQUAC_NRF model to study the phase behavior of aqueous two-phase polymer-salt systems, Fluid Phase Equilibria 180, p. 139-149 (2001).
Haynes, C. A., Blanch H. W., Praunitz, J. M., Separation of Protein Mixtures By Extraction: Thermodynamic Properties of Aqueous Two-Phase Polymer Systems Containing Salts and Proteins, Fluid Phase Equilibria 53, p. 463-474 (1989).
King, R. S., Blanch H. W., Prausnitz J. M., Molecular thermodynamics of aqueous two-phase
systems for bioseparations, AIChE. J., 34, p.1585-1594 (1988).
Kojima, K., Tochigi, K., Prediction of vapor-liquid equilibria by the ASOG method, Elsevier / Kodansha, Tokyo (1979).
Magnussen T., Rasmussen P., Fredenslund A., UNIFAC Parameter Table for Prediction of Liquid-Liquid Equilibria, Ind. Eng. Chem. Process Des. Dev., 20, p. 331-339 (1981).
Mishima, K., Nakatani, N., Nomiyama, T., Matsuyama, K., Nagatani, M., Nishikawa, H., Liquid-Liquid equilibria of aqueous two-phase systems containing polyethylene glycol and dipotassium hydrogenphosphate, Fluid Phase Equilibria 107, p. 269-276 (1995).
Murugesan, T., Perumalsamy, M., Liquid-Liquid Equilibria of Polyethylene glycol 2000 + Sodium citrate +Water at (25°, 30°, 35°, 40° and 45) °C, J. Chem. Eng. Data 50, p. 1392-1395 (2005). Novak, J. P., Mautous, J., Fick, J., Liquid – liquid
equilibria, Elsevier (1987).
Oishi T., Prausnitz J. M., Estimation of Solvent Activities in Polymer Solutions Using a Group Contribution Methodology, Ind. Eng. Chem. Process Des. Dev., 17, p. 333-339 (1978).
Perumalsamy, M., Murugesan,T., Partition behavior of bovine serum albumin in PEG2000-sodium citrate-water based aqueous two-phase system,
Separation Science and Technology 42, p.
2049-2065 (2007).
Porto. T. Al., Liquid–liquid extraction of proteases from fermented broth by PEG/citrate aqueous two-phase system, Chemical Engineering and Processing 47, p. 716-721 (2008).
Renon, H. J., Prausnitz, M., Local composition in thermodynamic excess functions for liquid mixtures, AIChE J. 14, p. 135-144 (1968).
Tubío, G., Nerli, Picó, B., G., Partitioning features of bovine trypsin and α-chymotrypsin in polyethyleneglycol-sodium citrate aqueous two-phase systems, Journal of Chromatography B 852, p. 244-249 (2007).
Van Krevelen, D., W., Hoftyzer, P. J., Properties of polymers: Their estimation and correlation with chemical structure, second ed., Elsevier, Amsterdam, chapter 11 (1976).
Voros, N., Proust, P., Fredenslund, A., Liquid-liquid phase equilibria of aqueous two-phase systems containing salts and polyethylene glycol, Fluid Phase Equilibria 90, p. 333-353 (1993).
Wu, Y.T., Lin, D. Q., Zhu, Z. Q., Mei, L. H., Prediction of liquid-liquid equilibria of polymer-salt aqueous two-phase systems by a modified Pitzer's virial equation, Fluid Phase Equilibria 124, p. 67-79 (1996).
Zafarani-Moattar, M. T., Rahmat Sadeghi, Ali Asghar Hamidi, Liquid-Liquid equilibria of an aqueous two-phase system containing polyethylene glycol and sodium citrate: experiment and correlation, Fluid Phase
Equilibria 219, p. 149-155 (2004).
Zafarani-Moattar, M. T., Emamian, S., Hamzehzadeh, S., Effect of Temperature on the Phase Equilibrium of the Aqueous Two-Phase Poly(propylene glycol) + Tripotassium Citrate System, J. Chem.Eng.Data 53, p. 456-461 (2008).