www.atmos-chem-phys.net/11/9155/2011/ doi:10.5194/acp-11-9155-2011
© Author(s) 2011. CC Attribution 3.0 License.
Chemistry
and Physics
New and extended parameterization of the thermodynamic model
AIOMFAC: calculation of activity coefficients for organic-inorganic
mixtures containing carboxyl, hydroxyl, carbonyl, ether, ester,
alkenyl, alkyl, and aromatic functional groups
A. Zuend1, C. Marcolli2, A. M. Booth3, D. M. Lienhard2,4, V. Soonsin2, U. K. Krieger2, D. O. Topping3, G. McFiggans3, T. Peter2, and J. H. Seinfeld1
1Department of Chemical Engineering, California Institute of Technology, Pasadena, California, USA 2Institute for Atmospheric and Climate Science, ETH Zurich, Zurich, Switzerland
3School of Earth, Environmental and Atmospheric Science, University of Manchester, Manchester, UK 4School of Chemistry, University of Bristol, Bristol, UK
Received: 26 April 2011 – Published in Atmos. Chem. Phys. Discuss.: 20 May 2011 Revised: 25 August 2011 – Accepted: 1 September 2011 – Published: 7 September 2011
Abstract. We present a new and considerably extended parameterization of the thermodynamic activity coefficient model AIOMFAC (Aerosol Inorganic-Organic Mixtures Functional groups Activity Coefficients) at room tempera-ture. AIOMFAC combines a Pitzer-like electrolyte solu-tion model with a UNIFAC-based group-contribusolu-tion ap-proach and explicitly accounts for interactions between or-ganic functional groups and inoror-ganic ions. Such interactions constitute the salt-effect, may cause liquid-liquid phase sep-aration, and affect the gas-particle partitioning of aerosols. The previous AIOMFAC version was parameterized for alkyl and hydroxyl functional groups of alcohols and polyols. With the goal to describe a wide variety of organic com-pounds found in atmospheric aerosols, we extend here the pa-rameterization of AIOMFAC to include the functional groups carboxyl, hydroxyl, ketone, aldehyde, ether, ester, alkenyl, alkyl, aromatic carbon-alcohol, and aromatic hydrocarbon. Thermodynamic equilibrium data of organic-inorganic sys-tems from the literature are critically assessed and comple-mented with new measurements to establish a comprehensive database. The database is used to determine simultaneously the AIOMFAC parameters describing interactions of organic functional groups with the ions H+, Li+, Na+, K+, NH+4, Mg2+, Ca2+, Cl−, Br−, NO−
3, HSO−4, and SO 2−
4 . Detailed descriptions of different types of thermodynamic data, such
Correspondence to: A. Zuend
9156 A. Zuend et al.: Extended parameterization of the AIOMFAC model
1 Introduction
Thermodynamic models are key tools to gain insight into the non-ideal behavior of organic-inorganic mixtures. At-mospheric aerosols present prominent examples for organic-inorganic mixtures of remarkable complexity, containing a multitude of different organic compounds, inorganic salts and acids, and water (e.g., Rogge et al., 1993; Saxena and Hildemann, 1996; Murphy and Thomson, 1997; Middle-brook et al., 1998; Decesari et al., 2000; Lee et al., 2002; Griffin et al., 2002; Maria et al., 2004; Kanakidou et al., 2005; Murphy et al., 2006; Decesari et al., 2006; Zhang et al., 2007; Russell et al., 2009). Gas-particle partitioning of water and semivolatile organic and inorganic compounds is determined by thermodynamic equilibrium between the gaseous and condensed phases (Pankow, 1994, 2003; Hal-lquist et al., 2009; Zuend et al., 2010) and by the kinetics of exchange processes such as gas phase diffusion (Mar-colli et al., 2004b). The non-ideality of mixtures in aerosol particles influences the gas-particle partitioning and affects the physical state of the condensed phase, potentially lead-ing to liquid-liquid phase separation (Pankow, 2003; Erdakos and Pankow, 2004; Marcolli and Krieger, 2006; Chang and Pankow, 2006; Ciobanu et al., 2009; Zuend et al., 2010; Kwamena et al., 2010; Smith et al., 2011; Bertram et al., 2011), the formation of crystalline solid phases (Nenes et al., 1998; Clegg et al., 1998a; Colberg et al., 2004; Zaveri et al., 2005; Fountoukis and Nenes, 2007), or the transition to an amorphous solid state (Zobrist et al., 2008, 2011; Murray, 2008; Mikhailov et al., 2009; Virtanen et al., 2010).
Inorganic salts and acids (electrolytes) that for the most part dissociate into ions (charged molecules or atoms) in liquid solutions play an important role in aqueous organic-inorganic systems. Interactions between ions and neutral or-ganic molecules may have a crucial impact on the dissolu-tion behavior and phase state of a system, commonly known as the salt-effect: Increasing the concentration of a strong electrolyte in a mixture may lead to “salting-out” of rela-tively nonpolar organics, i.e., the dissolved ions drive the or-ganic compounds out of the mixed phase – either to the gas phase or into a different, organic-rich liquid phase, initiat-ing or modifyinitiat-ing a liquid-liquid phase separation and a new equilibrium state. This well-known property of electrolytes is used in chemical and biochemical process engineering to separate aqueous organic mixtures (liquid-liquid extraction, two-phase partitioning) and to shift azeotropes in distillation processes, with large-scale applications in the petrochemical industry, in seawater desalination plants, and water purifi-cation systems. With respect to tropospheric aerosols, re-cent modeling studies (Zuend et al., 2010) and experiments (Smith et al., 2011; Bertram et al., 2011) on the phase state of idealized laboratory organic-inorganic aerosol mixtures sug-gest that ambient aerosols likely exhibit liquid-liquid phase separation at relative humidities (RH).85 %.
Activity coefficients of the different components represent the degree of thermodynamic non-ideality in a specific mul-ticomponent mixture, caused by the combined effects of all molecular interactions. For atmospheric purposes the vapor pressures of water and semivolatile organic and inorganic compounds are required in gas-particle partitioning calcula-tions, which depend on the saturation vapor pressures of the pure compounds and their activity coefficients in the liquid aerosol mixture. For example, in case of water, the equilib-rium water vapor pressure over a liquid mixture, pw, is re-lated to the water activity on the mole fraction basis (denoted by superscript(x)),aw(x), bypw=p◦wa
(x)
w , wherepw◦ is the saturation vapor pressure over pure liquid water (a function of temperature only). Activity and activity coefficient,γs(x), of a compounds are related byas(x)=γs(x)xs, where xs is the mole fraction ofsin the liquid mixture. These basic ther-modynamic relationships, corresponding chemical potentials and standard states, are described in detail by Zuend et al. (2010). In case of atmospheric water at gas-particle equi-librium, relative humidity and aerosol water activity are re-lated by RH=aw(x)=γw(x)xw (strictly valid only for droplet sizes where the Kelvin effect due to the curvature of the sur-face can be neglected, i.e., for droplet diameters>100 nm). At the core of thermodynamic equilibrium calculations are therefore models to calculate activity coefficients.
scheme (Zdanovskii, 1936, 1948; Clegg et al., 2003; Clegg and Seinfeld, 2004) is used to calculate the water content of mixtures. Examples of such decoupled models are the approach by Clegg et al. (2001) and the aerosol diameter dependent equilibrium model (ADDEM) of Topping et al. (2005b). Hybrid approaches to combine two specific mod-els, of which one describes the inorganic part and the other the organic part, have been discussed by Clegg and Sein-feld (2006a). Many coupled organic-inorganic models for aerosols are based on an extended UNIFAC approach (e.g. Ming and Russell, 2002; Raatikainen and Laaksonen, 2005; Chang and Pankow, 2006; Erdakos et al., 2006; Zuend et al., 2008), differing mainly in the degree of detail regarding the description of aqueous electrolyte solutions and the coupling via an organic-inorganic interaction part, as discussed by Zuend et al. (2008).
Tong et al. (2008) compared four different organic-inorganic models, two of which are fully coupled, to test whether the inclusion of explicit ion-organic interaction terms improves the performance over that of decoupled mod-els. They tested this question by comparison of model pre-dictions with experimental water activity data of dicarboxylic acids mixed with NaCl or(NH4)2SO4. Tong et al. found for the systems studied, that the decoupled models performed as well as the coupled models and in some cases even bet-ter. However, water activity predictions show only the abil-ities of thermodynamic models to calculate particle water content, but not the ability to correctly calculate the activ-ity coefficients of all components. In fact, for systems of more than two components, a thermodynamic model might accurately predict water activities, while failing to accurately predict activities of the other components. As we point out in this study, a rigorous thermodynamic calculation of the activity coefficients of all species in a system is essential to accurately compute vapor-liquid, liquid-liquid, and solid-liquid equilibria, and, hence, the gas-particle partitioning and phase states. The AIOMFAC model, described in the follow-ing sections, is a fully coupled model that allows consistent calculations of activity coefficients and phase states. This is essential for a proper description of mixed tropospheric aerosols, which are expected to exhibit liquid-liquid phase separation at RH.85 % (Zuend et al., 2010; Smith et al., 2011).
2 AIOMFAC model
The thermodynamic model AIOMFAC (Aerosol Inorganic-Organic Mixtures Functional groups Activity Coefficients) is a group-contribution model designed for the calculation of activity coefficients in aqueous organic-inorganic systems (Zuend et al., 2008). The group-contribution concept treats organic molecules as structures composed of different func-tional groups. This approach allows the representation of thousands of different organic compounds using a relatively
small and manageable number of functional groups. Espe-cially regarding the organic aerosol fraction, a compound-specific approach may not be feasible except in the case of well-defined laboratory systems. Field studies reporting im-portant individual organic compounds, compound classes, and/or distributions of functional groups found in ambient aerosols, identified alkyl, carboxyl, hydroxyl, ketone, alde-hyde, amines, organosulfates, ether, alkenyl, and aromatic groups (Decesari et al., 2000; Maria et al., 2003; Decesari et al., 2006; Russell et al., 2009; Gilardoni et al., 2009; Liu et al., 2009; Takahama et al., 2011). Hence, many organic aerosol components can be characterized by means of about 10 different kinds of organic functional groups.
AIOMFAC is based on the group-contribution model LI-FAC (Yan et al., 1999) – yet modified in many respects to better represent relevant species, reference states, and the rel-ative humidity range of the atmosphere. This is described in our previous work (Zuend et al., 2008), where we we have considered cations H+, Li+, Na+, K+, NH+4, Mg2+, and Ca2+, anions Cl−, Br−, NO3−, HSO−4, and SO24−and a wide range of alcohols/polyols composed of the alkyl (CHn, n = 0, 1, 2, 3) and hydroxyl (OH) functional groups for a first parameterization of organic-inorganic interactions.
In this study, we revise and extend the AIOMFAC model parameterization for the full range of atmospheric compo-sitions covering activity coefficient calculations of mixtures containing carboxyl, hydroxyl, ketone, aldehyde, ether, es-ter, alkenyl, alkyl, aromatic carbon, and aromatic carbon-alcohol functional groups, plus water and the inorganic ions as given above. We discuss how the availability, reliability, and abundance or in some cases lack of experimental data, define the main limitations for the current parameterization of the different binary functional group ↔ion interactions (the double arrow ↔ is used to mark interactions). The semi-empirical middle-range parameterization of explicit or-ganic ↔inorganic interactions in organic + water + salt so-lutions enables accurate and thermodynamically consistent computations of activity coefficients for all mixture species, required for the prediction of vapor-liquid equilibria (VLE), solid-liquid equilibria (SLE), liquid-liquid equilibria (LLE), and the computation of gas/particle partitioning of multicom-ponent systems (Zuend et al., 2010). It should be noted that, similar to the previous version, the model so far is con-strained to room temperature (298 K±5 K). Generalizations of the model applicable to other temperatures are presently underway.
3 Methods
3.1 Activity coefficients in AIOMFAC
9158 A. Zuend et al.: Extended parameterization of the AIOMFAC model (MR), and short-range (SR) contributions (Zuend et al.,
2008). These three interaction ranges contribute to the Gibbs excess energy Gex p,T ,nj of a thermodynamic system, constituting the system’s deviation from an ideal mixture:
Gex p,T ,nj=GexLR+GexMR+GexSR. (1)
Here,pis the total pressure,T the absolute temperature, and
nj (j=1,...,k) the molar amounts of thekcomponents in a system. Mole fraction based activity coefficientsγj(x)of the different components are derived from expressions for the different parts ofGexusing the relation
lnγj(x)=
∂Gex/(RT ) ∂nj
p,T ,nj′6=j
, (2)
whereRis the universal gas constant. Accordingly, the ac-tivity coefficients are calculated from the three model parts: lnγj(x)=lnγj(x),LR+lnγj(x),MR+lnγj(x),SR. (3) The long-range part, an extended Debye-H¨uckel expression, and the semi-empirical middle-range part form together a Pitzer-like group-contribution model, enabling accurate de-scriptions of electrolyte solutions, from dilute to highly con-centrated conditions into regions supersaturated with respect to crystalline phases.
Short-range interactions are calculated with a slightly modified UNIFAC model (Fredenslund et al., 1975) using the revised parameter set of Hansen et al. (1991) (stan-dard UNIFAC) for most of the functional group interactions. Modifications of the UNIFAC model part within AIOMFAC include further the introduction of inorganic ions, to account for their effects on the entropy and enthalpy of mixing apart from their charge-related interactions (Li et al., 1994; Yan et al., 1999; Zuend et al., 2008). Owing to the importance of hydroxyl and carboxyl functional groups in organic aerosols, we furthermore use the specific UNIFAC parameterizations of Marcolli and Peter (2005) for alcohols/polyols and the pa-rameterization of Peng et al. (2001) for the COOH group of carboxylic acids, for associated interaction parameters where these improved UNIFAC parameterizations differ from the standard UNIFAC parameterization by Hansen et al. (1991). Revisions and new UNIFAC parameters are compatible with the standard UNIFAC parameter set as long as the same mathematical model expressions are used. The UNIFAC pa-rameters of Marcolli and Peter (2005) and of Peng et al. (2001) differ only in a few main group interaction parameters from standard UNIFAC and their compatibility is guaranteed. The impact on calculated activity coefficients when combin-ing parameters from the different UNIFAC parameterizations within AIOMFAC has been tested and it was found that the model accuracy improves in most cases as compared to using parameters from standard UNIFAC only.
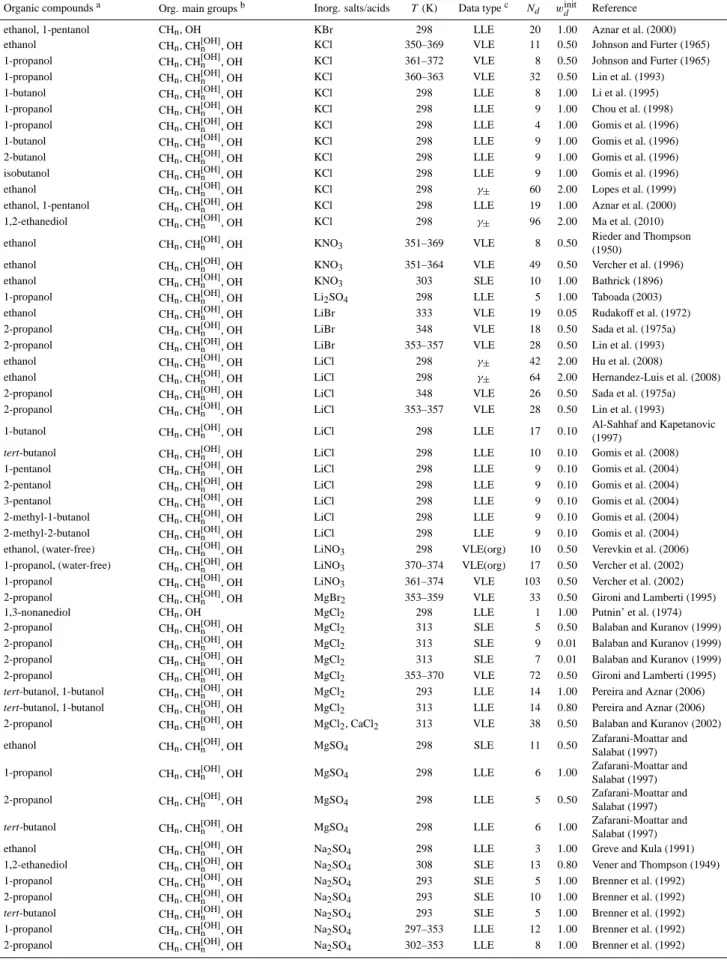
Figure 1 shows examples for the assignment of main groups in AIOMFAC. Note that the functional groups of a
chemical species are divided into so-called main groups and subgroups according to UNIFAC convention (Fredenslund et al., 1975; Marcolli and Peter, 2005; Zuend et al., 2008). E.g., the alkyl groups CH3, CH2, CH and C are differ-ent subgroups classified into the main group CHn. The distinction of different alkyl groups by Marcolli and Peter (2005): CH[nOH] with an attached OH group, CH[nalc−tail] in hydrophobic tails of alcohols, and CH[nalc] elsewhere in al-cohols, is implemented in full detail in the UNIFAC part of AIOMFAC, leading to the significant improvement in the de-scription of interactions of alcohol (and polyol) molecules with themselves and water as described by these authors. However, AIOMFAC main group↔ion interactions involv-ing the groups CH[nalc−tail]and CH[nalc]are described with the same parameters as CHn (standard UNIFAC) ↔ion inter-actions, as the current database and associated uncertainties do not suggest that a further distinction leads to an over-all improvement. With the exception of CH[nOH] groups, standard UNIFAC CHngroups are used for alkyl groups in molecules which contain hydroxyl groups combined with different other functional groups (i.e., non-pure alcohols, see Fig. 1). As intensive testing shows, the consideration of a specific CH[nOH] group, which accounts for the induced po-larity by the neighboring hydroxyl group, leads to a better description of different alcohols, polyols, and sugars within the group-contribution concept. Including the CH[nOH]group as a distinct functional group in AIOMFAC is justified, since unlike other polar groups, such as COOH or CHnCO, the OH group does not comprise the CHngroup it is bonded to.
Note that organic acids are treated as undissociated species in AIOMFAC. This is a simplification, as organic acids, e.g., dicarboxylic acids, tend to dissociate at least partially in di-lute aqueous solutions. This simplification is justified for moderately to highly concentrated solutions of carboxylic acids and when reactions with strong bases are not consid-ered. The reason for this simplification, and with it the omis-sion of carboxylate ions and salts, is the group-contribution representation. In order to explicitly treat the partial dissocia-tion of organic acids within a group-contribudissocia-tion method, one would need to define a dissociation constant of the carboxyl functional group, but different organic acids have quite dif-ferent dissociation constants (Clegg and Seinfeld, 2006a,b), making it difficult to assign a specific dissociation constant to the COOH group. Moreover, experimental data to deter-mine interactions between carboxylate anions and inorganic cations are rather incomplete (Clegg and Seinfeld, 2006b). Therefore, we neglect the dissociation of organic acids in aqueous solutions. However, the effects of partially dis-sociated carboxylic acids on the non-ideal mixing behavior are to some extent implied by means of the ionic strength-dependent COOH↔ion interaction contributions.
OH (UNIFAC-MP)
CHn[OH] [bonded to OH-group] (UNIFAC-MP) CHn[alc] [in alcohols] (UNIFAC-MP)
CHn[alc-tail] [in hydrophobic tails of alcohols] (UNIFAC-MP)
CHn (standard UNIFAC)
COOH (UNIFAC-Peng)
C=C (standard UNIFAC)
CHnCO (standard UNIFAC)
CHnO (standard UNIFAC)
CCOO (standard UNIFAC)
CHO (standard UNIFAC)
ACHn (standard UNIFAC)
ACOH (standard UNIFAC)
2-methyl-2-butanol
1,2-hexanediol
1,4-dihydroxy-2-butene
propanoic acid
citric acid
diethylketone
2-isopropoxyethanol
1,4-dioxane
1-propyl acetate
phenol
vanillin
3-hydroxybenzoic acid
Fig. 1. Upper box: complete list of types of organic functional main groups used in AIOMFAC. AIOMFAC follows the UNIFAC naming
convention for functional groups (see also Fig. 8). Besides the functional groups and associated interaction parameters of standard UNIFAC (Hansen et al., 1991), specific groups of Marcolli and Peter (2005) (UNIFAC-MP) and of Peng et al. (2001) (UNIFAC-Peng) are used as indicated. AIOMFAC middle-range main group↔ion interactions involving the specific alkyl groups CH[nalc−tail][in hydrophobic tails of alcohols] and CH[nalc][in alcohols, (but not in hydrophobic tail nor bonded to OH group)] are described with the same parameters as CHn (standard UNIFAC)↔ion interactions, denoted by the common outline color. Lower box: examples.
organic compounds and water, which are treated in the mod-ified UNIFAC model that makes up the AIOMFAC SR part. Hence, all adjustable AIOMFAC parameters to optimize the description of organic functional groups↔ion interactions in mixtures are implemented in the MR part. We focus in the following description only on the new and extended param-eterization of the organic main group↔ion interactions to additional functional groups in the MR part, while retaining the AIOMFAC MR-part expressions as given by Zuend et al. (2008) and refer to that previous work for a complete and detailed description of the AIOMFAC model expressions.
The expression forGexMRof a mixture containingnkmoles of solvent main groupsk(main groups of organics and wa-ter), with molar massesMk, andni moles of ionsiis (Zuend et al., 2008):
GexMR
RT =
1 P
k
nkMk X
k X
i
Bk,i(I )nkni
+P 1 k
nkMk X
c X
a
Bc,a(I )ncna
+P 1 k
nkMk X
c X
a
Cc,a(I )ncna X
i
ni|zi| P
k
nkMk
+P 1 k
nkMk X
c X
c′≥c
Rc,c′ncnc′
+ 1
P k
nkMk 2
X
c X
c′≥c X
a
Qc,c′,ancnc′na. (4)
Here,ncandnc′are moles of cations,naare moles of anions, andI is the ionic strength on a molal basis: I=12P
imiz2i, with molalitiesmiand integer number of elementary charges
9160 A. Zuend et al.: Extended parameterization of the AIOMFAC model
Cc,a(I )are interaction coefficients between cation↔anion pairs with respect to the total charge concentration. The co-efficients Rc,c′ andQc,c′,a describe binary and ternary in-teractions involving two different cations. These latter two interaction coefficients have been introduced by Zuend et al. (2008) to improve the description of systems containing the ion combinations NH+4, H+or NH+4, H+, SO24−(e.g., aque-ous sulfuric acid + ammonium sulfate solutions), especially at very high ionic strength. Hence, the last two terms of Eq. (4) vanish in other cases.
The first three interaction coefficients in Eq. (4) are param-eterized as functions of ionic strengthI. In AIOMFAC, we use expressions similar to those used for Pitzer models:
Bk,i(I )=b(k,i1)+b(k,i2)e−b (3) k,i √
I, (5)
Bc,a(I )=b(c,a1)+b(c,a2)e−b (3) c,a √
I, (6)
Cc,a(I )=c(c,a1)e−c (2) c,a √
I, (7)
whereb(k,i1),bk,i(2),b(c,a1),bc,a(2),b(c,a3),cc,a(1), andc(c,a2) are adjustable AIOMFAC parameters. The parameterb(c,a3) has been found to describe most aqueous salt solutions, when assuming a fixed value of 0.8 kg1/2mol−1/2. In cases where this value did not result in a satisfactory data fit, b(c,a3) has been al-lowed to vary (Zuend et al., 2008). The parameterbk,i(3) is kept constant for all organic-inorganic solutions at a value of 1.2 kg1/2mol−1/2. All interaction coefficients in the MR part are symmetric, i.e.Bk,i(I )=Bi,k(I ). Since water is de-fined as the reference solvent for inorganic ions, no explicit ion↔water interactions are determined, i.e.,Bk=H2O,i(I )=
0 for all inorganic ions. However, non-ideality effects from cations and anions interacting with water molecules are in-directly accounted for via the cation↔anion interaction co-efficients,Bc,a(I ),Cc,a(I ),Rc,c′, andQc,c′,a, as the corre-sponding interaction parameters have been determined on the basis of (organic-free) aqueous electrolyte solutions.
In this study, the organic main group↔ ion interaction parametersb(k,i1) andbk,i(2) of theBk,i(I )coefficients (Eq. 5) are revised or determined for the first time. In addition, we revise the MR parameters involved in aqueous ammo-nium sulfate + sulfuric acid mixtures (to correct for an error in the previous parameter estimation, see Sect. 5.1) and we fitted the parameters of Eqs. (6) and (7) for Mg2+↔Br−, Ca2+ ↔Br−, and Ca2+ ↔ SO24− interactions. All other model parameters are kept as given in Zuend et al. (2008).
3.2 Uncertainty and the determination of model parameters
The adequate consideration of uncertainties in both exper-imental data and the model is crucial for the determina-tion of organic main group ↔ ion interaction parameters. Qualitatively, an organic + water + salt system can be mod-eled in terms of organic ↔organic, organic↔ water,
or-ganic ↔ ion, and aqueous cation ↔ anion interactions (cation↔cation and anion↔anion interactions can usually be neglected, see description of Eq. (4) for exceptions). In the group-contribution framework of AIOMFAC (and UNIFAC), organic ↔ organic interactions are implemented on the level of interactions between organic functional groups (sub-groups/main groups in UNIFAC part), while organic↔ion interactions are described by organic main groups interact-ing with inorganic ions (no distinction on subgroup level as in LIFAC, Yan et al., 1999; Kiepe et al., 2006). Model un-certainties are associated with each of these types of interac-tions. Moreover, each measured quantity has its own level of random and systematic errors, which also depend on mix-ture composition, rendering some data points more reliable than others. This needs to be considered during the parame-ter deparame-termination procedure, e.g., by applying a meaningful weighting procedure to the individual datasets.
In order to parameterize organic↔ion interactions from measurements, the deviations between measured thermody-namic equilibrium quantities and corresponding calculated quantities can be minimized by improving the organic↔ion interaction parameters, provided that the contributions from all other binary interactions are already correctly consid-ered. However, if there are significant uncertainties and cor-responding deviations caused by other interaction contribu-tions, the deviations between measured and calculated quan-tities cannot be attributed entirely to the organic↔ion in-teraction. Zuend et al. (2008) showed that activity coef-ficients in aqueous electrolyte solutions are accurately cal-culated by AIOMFAC, so that it is justified to assume un-certainties from aqueous cation↔anion interactions to be negligible. Inherent to the group-contribution concept, or-ganic ↔water and organic ↔ organic contributions from the UNIFAC model part bear higher uncertainties, as can be seen from comparisons of UNIFAC calculations and mea-surements for salt-free systems. A reduction of the influence of random and systematic errors can be achieved by basing the parameterization on a wide range of data, including dif-ferent data types and difdif-ferent organic compounds. Prepro-cessing of some experimental data types in order to isolate the salt-effect on the organics from other contributions, as de-scribed in Sect. 4, helps to avoid that deviations arising from limitations of the UNIFAC part are erroneously compensated by organic-inorganic interactions.
might interfere: when the ternary systems from the ex-ample mentioned above are dominated by propanoic acid (CH3CH2COOH) as the carboxylic acid, which is composed of two CHnmain groups in addition to the carboxyl group, the COOH↔Cl−interaction parameters tend to become bi-ased towards systems with a CHn:COOH ratio of 2:1, al-though the CHn ↔Cl− interaction contribution should not be reflected by the COOH ↔Cl− interaction parameters. Furthermore, if only a certain type of data is available to de-termine a specific organic-inorganic interaction, e.g., experi-mental water activities, it might not be sufficient to constrain model parameters for accurate predictions of activities of all components. In general, such issues emerge from the repre-sentation of systems and components in AIOMFAC (or any other group-contribution model) and the amount and distri-bution of datasets used for the model parameter determina-tion.
Although it cannot be completely avoided that an uneven distribution of datasets biases the model parameterization, a database containing a large variety of different datasets for the description of all the binary organic main group↔ion in-teractions is the key to reduce parameterization interferences. This emphasizes the necessity and advantage of fitting all binary interaction parameters simultaneously using the en-tire database, since all systems are coupled by common ions and/or organic main groups. Provided a sufficient amount of experimental data for different systems exists, covering a wide range of concentrations, the diverse effects arising from organic main group↔ion interactions can be disentangled by the parameter optimization procedure.
3.3 Objective function
Finding optimal organic↔ion interaction parameters is a challenging multidimensional global optimization problem. In due consideration of the various aspects of model and measurement uncertainties and to enable intercomparability of different quantities, we formulate the following general objective function, subject to minimization:
Fobj= X d X u wd,u
Qcalcd,u−Qrefd,u Q ref d,u +Q tol d,u 2 . (8)
Here,d is a dataset index, udenotes a point in the dataset,
wd,u is the weighting of a data point as calculated from Eq. (9), and the sums cover all data points in all datasets con-sidered. Qrefd,uis a given reference quantity, i.e., a measured value or a quantity derived from measurements by means of thermodynamic relations. Qcalcd,u is the corresponding quan-tity calculated with the model at given conditions.Qtold,uis a tolerance quantity (>0) with the same units asQrefd,u, repre-senting the measurement uncertainty or model sensitivity as described below. The range of values and units of the actual quantities depend on the data type (data types are discussed
in Sect. 4). To simplify the procedure of assigning individ-ual weightings to data points based on the data type and other properties, such as the number of data points in a dataset,Nd, the following approach is used:
wd,u= winit
d ifNd≤η,
wdinit×Nη
d ifNd> η,
(9) wherewinitd is an initial weighting assigned to datasetd, as-suming the number of data points to be η, regardless of the actual number (Nd). Here we set η=10, which is a characteristic number of points of the datasets considered. Equation (9) reduces the influence of datasets containing a large number of points, while avoiding an inordinately large weighting of datasets with only very few points. Initial weightings assigned to the datasets for the model fit are given in Table 2. The following rules were applied to assign ini-tial weightings based on data type (see Sect. 4), temperature range and considerations regarding overall model optimiza-tion. LLE and SLE data close to 298 K were assigned awinitd
of 1.0, mean molal activity coefficients, γ±, andaw(bulk) data an initial weighting of 2.0, water activity data from elec-trodynamic balance measurements,aw(EDB), a value of 1.0, and VLE data an initial weighting of 0.5 (or less depend-ing on the temperature range). In addition, datasets show-ing large scatter or inconsistency with most other comparable data were given lower weightings or were set to zero. Dataset contributions to the objective function value after trial opti-mization iterations were analyzed and used to identify po-tential inconsistencies among datasets, possible mistakes in the dataset conversion or the implementation in the model (quality control), and to avoid that a few datasets completely dominate the parameter optimization due to numerical issues or other unjustified reasons.
In caseQrefd,u in Eq. (8) is an experimentally determined value, such as a ternary mixture composition at salt satura-tion or the relative humidity in equilibrium with a bulk so-lution (i.e., the water activity), the corresponding tolerance quantity,Qtold,u, can be considered a characteristic uncertainty of the measurement. Qtold,uwould then be a stated measure-ment error or the standard deviation of several repeated ex-periments. However, for most of the data considered in the model fit, error bars are not given. Furthermore, we would like to know the sensitivity of activity coefficients with re-spect to a stated or assumed experimental uncertainty. Com-mon to all measurements is the possibility of a slight error in composition. Therefore, we use the AIOMFAC model to calculate the effect of a tiny change in composition on the activity coefficients of the different mixture components by means of a total molar derivative:
stγ x⋆=dntol ∂γt ∂n1 T ,n
j6=n1
+ ∂γt ∂n2 T ,n
j6=n2
+...+ ∂γt ∂nk
T ,nj6=nk !
9162 A. Zuend et al.: Extended parameterization of the AIOMFAC model Here,stγ(x⋆)is the activity coefficient sensitivity of
compo-nentt at a compositionx⋆(x1,x2,...,xk)of ak-component system and dntol is a molar increment corresponding to a mole fraction tolerance xtol characteristic for the dataset (dntol=xtol×1mol). In this study, we chose xtol=0.01 for all datasets, which we consider a reasonable error tol-erance for the use with a group-contribution model. The par-tial derivatives ofγt are calculated with respect to a molar change of each independent mixture component (n1,...,nk), while keeping the molar amountsnjof all other components fixed at the values corresponding tox⋆. Similarly, replac-ing the activity coefficient by the activity at of a compo-nent in Eq. (10), the activity sensitivitysta(x⋆)is calculated. The sensitivitystγ(x⋆)provides a measure of the extent to which calculated AIOMFAC activity coefficients are sensi-tive to an error in a given mixture composition. If the rela-tionship between a mixture composition and associated ac-tivity coefficients is experimentally determined to some de-gree of certainty and found to be sufficiently well represented by AIOMFAC, the calculated activity coefficient sensitivity can also be used to assess the quality of experimental data. Therefore, this concept enables an estimate of composition-related uncertainties of measurements and, thus, a way to determine how much one can trust a certain data point rel-ative to other points/measurements. Other sources of error, more related to the accuracy of a specific experimental tech-nique, can be factored in via the initial dataset weighting. For data types in which theQrefd,uare activity coefficients or activities, AIOMFAC sensitivities are used to calculate the tolerance quantity of a specific data point required for the objective function computation. For example, ifQrefd,u and
Qcalcd,u are measured and calculated water activities at com-positionx⋆, thenQtold,u=swa(x⋆). In other cases, e.g., when
Qrefd,uandQcalcd,u are measured and calculated compositions in mole fractions,Qtold,uis simply:Qtold,u=xtol.
Due to the fact that we use AIOMFAC to compute the sensitivities with a certain test set of interaction parameters at each iteration step (Fobj evaluation) during the parame-ter optimization procedure, the sensitivities calculated from Eq. (10) are a result of the AIOMFAC test-parameterization that feeds back on the objective function value. Hence, in principle there are two options to minimizeFobj: (1) by min-imizing the numerator(Qcalcd,u−Qrefd,u)2of Eq. (8), which is desired, or (2) by maximizing the denominator (at a sub-optimal nominator) via maximizingQtold,u, which should be avoided. In practice, feedback loops maximizingQtold,u dur-ing parameter optimization do not pose a problem, because
Qtold,udepends only on the sensitivities for certain data types. Data distributed over a wide concentration range automati-cally corrects a tendency for option (2). The denominator of Eq. (8) is also designed to restrict the influence of data points with a very low sensitivity by the additional termQrefd,u. Data with a very low activity coefficient sensitivity are typically rather insensitive to organic main group↔ion interactions,
e.g., water activity at high mole fractions of water, and a high weighting of such data would only add more noise instead of signal to the actual parameter optimization problem.
3.4 Constraints based on functional group polarity series
The physicochemical meaning of the binary interaction co-efficients Bk,i(I ) provides additional information to con-strain the parameters bk,i(1) andb(k,i2) to a meaningful range. The first term on the right-hand side of Eq. (4) (which in-cludesBk,i(I )) represents contributions to the Gibbs excess energy attributed to two-body interactions between organic main groups and ions. While the contribution of this term scales with the molalities of involved organic main groups and ions, the interaction coefficientsBk,i(I )are functions of ionic strength only. These coefficients represent interaction strengths, specific to each main group-ion pair. However, relative to the same ioni⋆ at a given ionic strength I⋄, we argue that the differentBk,i⋆(I⋄)values are not independent of each other, but rather that they are related to each other and depend on the polarity of the main groupsk. Ions have a higher affinity for polar functional groups than for nonpo-lar groups due to charge ↔ permanent dipole interactions with polar functional groups. Additionally, the polar car-boxyl group partially dissociates in dilute solutions, enabling charge↔charge interactions and certain ions, e.g., NO−3 and SO24−, can also form hydrogen bonds with hydroxyl and car-boxyl groups, which can lead to salting-in of organic com-pounds. On the other hand, much weaker (attractive) inter-actions between ions and nonpolar main groups are the main cause for the salting-out effect of ions on organics in aqueous solutions. Here, the reference value forBk,i⋆(I⋄)is the in-teraction with water, for which we haveBH2O,i⋆(I⋄)=0 (by
definition). Therefore, in the case of nonpolar main groups, theBk,i⋆(I⋄)values are expected to be positive and greater than the Bk,i⋆(I⋄) of polar main groups, representing the larger difference of nonpolar group↔ion interactions rel-ative to interactions of ions with polar water molecules. We formulate a functional group polarity series for the interac-tion coefficientBk,i⋆(I⋄)with the polarity of main groupsk in decreasing order:
COOH < ACOH . OH+CH[nOH]
< CHO
. CHnO . CHn[OH] . ACHn . CHn < C=C and
CCOO < CHnCO < C=C.
(11)
The inequality signs are with respect to the values of
considered in a separate series. However, in terms of their Gibbs energy contributions according to Eq. (4), these func-tional groups can be thought of as units consisting of two sin-gle carbon-containing groups, e.g., CHnCO≈CHn+CHO or C=C≈CHn+CHn. Hence, the second series of Rela-tion (11) is, within a certain tolerance, related to the first series. Relation (11) allows one to formulate a set of in-equality expressions, e.g.: BCOOH,i⋆(I⋄) < BACOH,i⋆(I⋄), BCHnO,i⋆(I⋄) < BCHn,i⋆(I⋄),BCHnCO,i⋆(I⋄) < BC=C,i⋆(I⋄),
etc. Such inequality expressions are used as additional con-straints during the determination of the model parameters by evaluatingBk,i⋆(I⋄)at I⋄=0.001 mol kg−1, 0.1 mol kg−1, 10 mol kg−1, and 100 mol kg−1. These constraints effec-tively restrict the parameter range for each main group-ion pair. Among the advantages of such an approach are the re-sulting physically meaningfulBk,i(I ) interaction contribu-tions and, with regard to prediccontribu-tions (extrapolacontribu-tions) on the basis of the group-contribution concept, a more reliable pa-rameterization of AIOMFAC.
4 Types and processing of experimental data
Central for a reliable parameterization of AIOMFAC is a broad distribution of experimental data, comprising mixtures containing the target functional groups and inorganic ions at various concentrations. The theoretical basis common to dif-ferent experimental techniques and data types is thermody-namic equilibrium. Equilibria between the gas phase and a liquid mixture constitute the basis for vapor-liquid equi-librium (VLE) phase composition measurements, equilibria between coexisting liquid phases provide liquid-liquid equi-librium (LLE) tie-line data, and equilibria between solid and liquid phases (SLE) furnish composition data of saturated so-lutions. Measurements of the electrical conductivity in elec-trolyte solutions relative to a standard cell potential, so called electromotive force (EMF) measurements, allow a direct de-termination of mean molal activity coefficients.
The relatively weak temperature dependence of activity coefficients allows the use of data measured at somewhat higher or lower temperatures than 298 K. In this respect, dataset weightings are also used to account for a tempera-ture effect, assigning higher weightings to datasets closer to 298 K. In the following, the different data types, their pro-cessing and use in the model parameterization are described.
4.1 Vapor-liquid equilibrium data
VLE data comprise the mole fraction composition of the gas phase (y) and the liquid mixture (x) under isothermal or isobaric conditions (x-y-T-pVLE data). Isobaric measure-ments are typically conducted at 1 atm pressure (101 325 Pa), by measuring the boiling point temperature of different mix-ture compositions. Therefore, such measurements report data at higher temperatures. Almost all VLE data considered
are ternary organic + water + salt mixtures, in which the salt is present only in the liquid phase. Treating the gas phase as an ideal gas mixture, activity coefficients of the organic com-ponent and water can be obtained from modified Raoult’s law:
γj(x)= pj p◦
jxj
. (12)
Here,pj is the partial pressure of the semivolatile compo-nentj, given frompj=yjp, whereyj is the measured gas-phase mole fraction at total system pressure p. p◦
j(T ) is the pure liquid compound saturation vapor pressure andxj the liquid-phase mole fraction, defined on the basis of the completely dissociated salt:xj=nj/(Psns+Pini), where
ns are moles of solvent species (organics, water) andni are moles of the different ions. Saturation vapor pressures of or-ganics and water at different temperatures are calculated us-ing the Antoine equation with coefficients from the Landolt-B¨ornstein database (Dykyj et al., 2000). With the exception of carboxylic acids, the assumption of an ideal gas mixture is well justified for the pressure and temperature range of the data. Tests with gas-phase fugacity corrections show a neg-ligible effect onγj(x) – partly since the ratiopj/p◦j moder-ates real-gas behavior. Gas-phase association of carboxylic acids, such as formic, acetic, and propanoic acids, is ac-counted for by the relations of Chueh (1974) with dimeriza-tion equilibrium coefficients from Tsonopoulos and Praus-nitz (1970). The availability of VLE measurements for salt-free organic + water systems at similar conditions allows a further processing of activity coefficients with the goal to iso-late the salt-effect on the organics from other contributions. Isolating the salt-effect enables achieving qualitative agree-ment of model and experiagree-mental data in terms of salting-in or salting-out effects of a certain electrolyte on an organic compound. This is useful since at lower salt concentrations uncertainties in the UNIFAC part of AIOMFAC might lead to a qualitatively wrong parameter fitting, i.e., forcing the model towards predicting a salting-in effect when salting-out is actually observed. The idea of isolating the salt-effect is to calculate the deviation1sc,sfγj(x)(xj′)of a component’s ac-tivity coefficient in the salt-containing (sc) from the corre-sponding salt-free (sf) system, calculated at the same liquid mixture mole fractionx′
j (superscript′denotes here the cal-culation of mole fractions on a salt-free basis, i.e., even when a salt is present in the mixture) and temperature range:
9164 A. Zuend et al.: Extended parameterization of the AIOMFAC model
0.0 0.2 0.4 0.6 0.8 1.0
x'(organic) (electrolyte-free basis) 0
2 4 6 8 10 12 14 16
∆
s
c
,s
f γj
(x
)
0 1
xj
x(1) x(2)
xions(3)
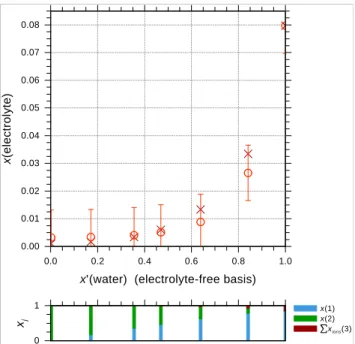
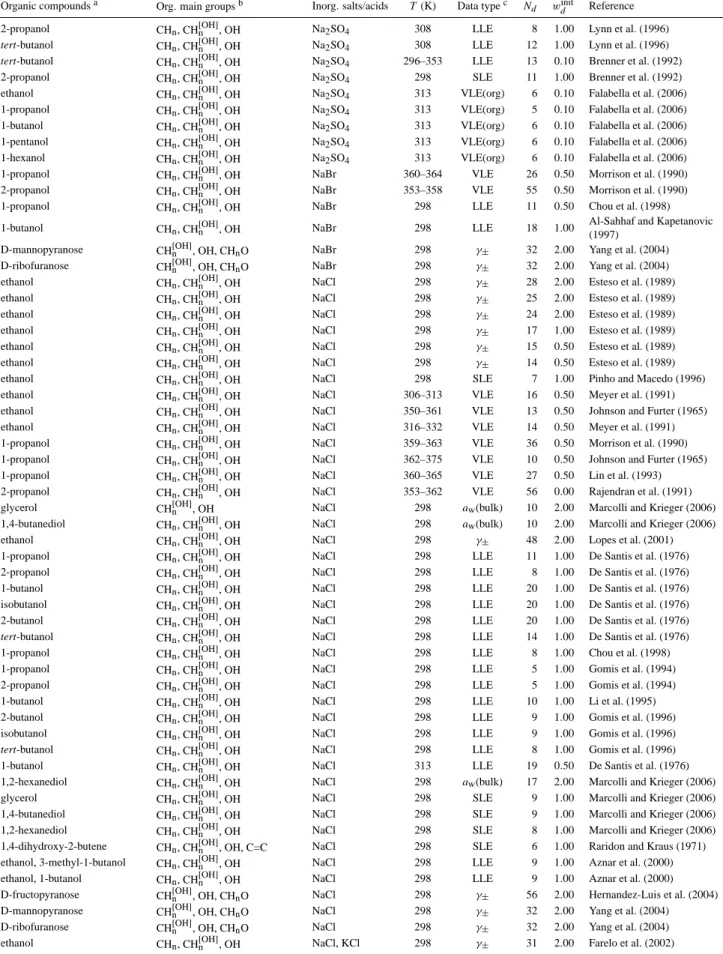
Fig. 2. Activity coefficient deviations 1sc,sfγj(x) of salt-free vs. salt-containing mixtures in the water (1) + 2-propanol (2) + LiCl (3) system derived from isobaric VLE data at 354–358 K. Experimental data ( , ) by Lin et al. (1993) and calculated values ( , ) are shown in blue for water and in green for 2-propanol. The error bars represent the model sensitivity to a composition varia-tion byxtol=0.01. The mixture compositions with respect to com-pletely dissociated LiCl are shown in the bar graphs.
parameterization satisfying the Gibbs-Duhem-Margules re-lation for binary systems (McGlashan, 1963; Soonsin et al., 2010):
gex
RT = x2(1−x2)+ " k
X
i=1
ci(1−2x2)i−1 #
, (14)
d
gex/(RT )
dx2 =
(1−2x2)+ " k
X
i=1
ci(1−2x2)i−1 #
+x2(1− x2) "
−2 k X
i=2
(i−1)ci(1−2x2)i−2 #
,(15)
lnγ2(x) = g ex
RT +(1−x2) d
gex/(RT ) dx2
, (16)
lnγ1(x) = g ex RT −x2
dgex/(RT ) dx2
, (17)
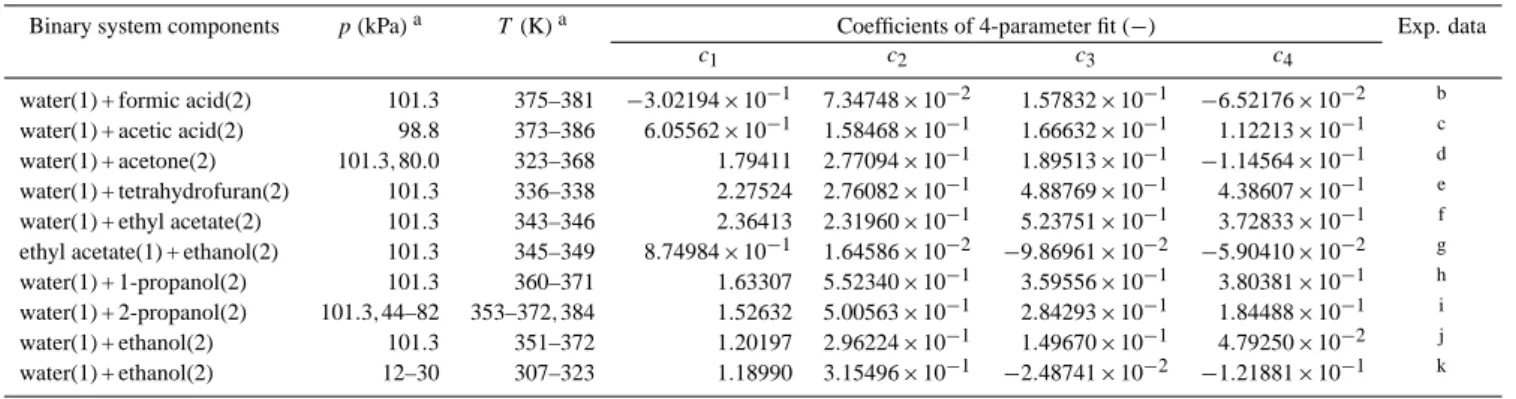
wheregexis the molar Gibbs excess energy of a binary so-lution (components 1 and 2) andci (i=1,...,k) are fitted, system-specific coefficients up to orderk=4, given in Ta-ble 1. Equations (16) and (17) provide then theγj(x),sf re-quired in Eq. (13). The data processing with Eq. (13) leads in most cases to a clear qualitative and quantitative distinction between the salt-effect on water (predominately salting-in) and on organic compounds (predominately salting-out).
For complete (x-y-T-p) VLE datasets, Eq. (13) is used to define the reference quantity,Qrefd,u=1sc,sfγ(x)
j . Q calc d,u is calculated accordingly by the model. Qtold,uis defined using the model sensitivity of the activity coefficient deviation as
Qd,utol =sγt (1sc,sfγj(x))+1, where the term+1 (=γj(x),ideal) attenuates effects from noisy data on the special salt-effect isolation treatment (when introduced in the denominator of Eq. 8). An example of the use of VLE data processed this way is shown in Fig. 2 for the ternary system water + 2-propanol + LiCl. This system is representative for the behav-ior of many ternary VLE systems in that it shows a strong salting-out effect on the organic, i.e., large positive devia-tions from the electrolyte-free baseline (where1sc,sfγorg(x)= 0), at compositions where the organic component makes up only a small fraction of the solution and the electrolyte con-centration is relatively high. This enhanced salting-out ef-fect can be intuitively explained by the microscopic view that at such conditions, moderating organic↔ organic in-teractions are largely diminished, whereas organic↔ion in-teractions are more frequent, due to the higher probabilities of an organic molecule to directly interact with an ion (or with a water molecule), than with another organic molecule. The salt-effect isolation treatment removes the effects of or-ganic ↔ water interactions on the activity coefficients of both water and the organic compound. Hence, deviations from the electrolyte-free baseline in Fig. 2 (and similar fig-ures) represent the direct and indirect effects of dissolved ions on activity coefficients of the organic compound and water. Organic↔ion interactions directly affect the activ-ity coefficients of the organic compound, while water↔ion interactions indirectly affect organic activity coefficients ac-cording to the Gibbs-Duhem relation. Typical for electrolyte-containing mixtures when dilute with respect to the organic fraction, is an increased model sensitivity to small variations in composition, which explains and justifies an increase in the deviations between calculated and measured activity co-efficients of the organic compound.
Some VLE datasets are incomplete in the sense that they provide only, e.g., x-y-T data, where total pressure infor-mation is missing. In our database, the data type VLE(x
-y-T) coincides with ternary mixtures containing monocar-boxylic acids, such as propanoic acid, which associate in the gas phase to form significant amounts of dimers. There-fore, individual activity coefficients of water and the or-ganic compound cannot be derived from the experimental data in the way it is achieved for complete VLE(x-y-p-T) data and no isolation of the salt-effect is attempted. How-ever, the measured mole fraction of water in the gas phase,
Table 1. Coefficients for the Gibbs-Duhem-Margules parameterization fitted to salt-free binary VLE data.
Binary system components p(kPa)a T(K)a Coefficients of 4-parameter fit (−) Exp. data
c1 c2 c3 c4
water(1) + formic acid(2) 101.3 375–381 −3.02194×10⁻¹ 7.34748×10⁻² 1.57832×10⁻¹ −6.52176×10⁻² b water(1) + acetic acid(2) 98.8 373–386 6.05562×10⁻¹ 1.58468×10⁻¹ 1.66632×10⁻¹ 1.12213×10⁻¹ c water(1) + acetone(2) 101.3,80.0 323–368 1.79411 2.77094×10⁻¹ 1.89513×10⁻¹ −1.14564×10⁻¹ d water(1) + tetrahydrofuran(2) 101.3 336–338 2.27524 2.76082×10⁻¹ 4.88769×10⁻¹ 4.38607×10⁻¹ e water(1) + ethyl acetate(2) 101.3 343–346 2.36413 2.31960×10⁻¹ 5.23751×10⁻¹ 3.72833×10⁻¹ f ethyl acetate(1) + ethanol(2) 101.3 345–349 8.74984×10⁻¹ 1.64586×10⁻² −9.86961×10⁻² −5.90410×10⁻² g water(1) + 1-propanol(2) 101.3 360–371 1.63307 5.52340×10⁻¹ 3.59556
×10−1 3.80381
×10−1 h
water(1) + 2-propanol(2) 101.3,44–82 353–372,384 1.52632 5.00563×10⁻¹ 2.84293×10⁻¹ 1.84488×10⁻¹ i water(1) + ethanol(2) 101.3 351–372 1.20197 2.96224×10⁻¹ 1.49670×10⁻¹ 4.79250×10⁻² j water(1) + ethanol(2) 12–30 307–323 1.18990 3.15496×10⁻¹ −2.48741×10⁻² −1.21881×10⁻¹ k
aPressure and temperature ranges are stated with respect to the experimental data used for the fit.
Experimental data references:bYun et al. (1998),cNarayana et al. (1985),dBrunjes and Bogart (1943); Al-Sahhaf and Jabbar (1993),eSada et al. (1975b),fRajendran et al.
(1991),gTopphoff et al. (2001),hVercher et al. (1999); Morrison et al. (1990); Gmehling et al. (1981); Lin et al. (1993),iKato et al. (1971); Sada et al. (1975b); Morrison et al.
(1990); Lin et al. (1993); Gmehling et al. (1981); Gironi and Lamberti (1995); Rajendran et al. (1991),jGmehling et al. (1981); Kurihara et al. (1993); Johnson and Furter (1957);
Kirschbaum and Gerstner (1939),kKirschbaum and Gerstner (1939); Gmehling et al. (1981).
and dimer are related by: p2d=(p2m)2K2(T ), whereK2is the temperature dependent association equilibrium constant as given, e.g., by Tsonopoulos and Prausnitz (1970). The expression to calculatey1with AIOMFAC is then:
y1=
γ1(x)x1p1◦ γ1(x)x1p◦1+γ2(x)x2p2◦m+2K2
γ2(x)x2p◦2m
2. (18)
Here,p2◦mis the saturation vapor pressure of the monomer of component 2 atT, calculated by solving the quadratic equa-tion: K2(p◦2m)2+p2◦m−p◦2=0, wherep◦2 is the total satu-ration vapor pressure of component 2 atT, obtained from the Antoine Equation with coefficients from the Landolt-B¨ornstein database (Dykyj et al., 2000). Hence the unknowns in Eq. (18) are the activity coefficients, which are calculated with AIOMFAC. The tolerance quantity of data type VLE(x
-y-T) is set toQtold,u=xtol.
4.2 Water activity data
A special case of VLE data are water activitiesaw of bulk solutions or from aqueous droplets. The latter are typi-cally investigated in an electrodynamic balance (EDB), with a hygroscopicity tandem differential mobility analyzer (HT-DMA), or by micro-Raman spectroscopy. In bulk experi-ments, the (water) vapor pressure or relative humidity (RH) of the gas phase in equilibrium with a solution of a given composition is measured. Solution concentrations up to sat-uration can be reached. In EDB, HTDMA or micro-Raman measurements, droplets are equilibrated in an atmosphere of known RH. The radius or volume change of the droplets re-flects the water uptake or release as a function of RH and can be related to absolute water content when the dry mass is known or when bulk reference water activities at high RH are available. EDB and HTDMA measurements are usually
less accurate than bulk measurements because of uncertain-ties in both, ambient RH and water content. However, they can access the supersaturated concentration range because small droplets with little contact to surfaces can reach high supersaturations. Accurate water activity measurements of bulk solutions and droplets require the vapor pressure of the organic component to be low with respect to the water vapor pressure. Water activity measurements have the advantage of providing data at room (or even lower) temperatures and are a useful data source to constrain organic↔ion interac-tions, although water activities are only indirectly affected by such interactions (Gibbs-Duhem relation). In case ofaw data,Qrefd,u andQcalcd,u are the measured and calculated aw(x) values at given mixture compositions andQtold,uare the cal-culated water activity sensitivities (Eq. 10). Figure 3 shows measured and calculated water activities in the system wa-ter + malonic acid +(NH4)2SO4at 298 K. The deviations of water activities in the ternary mixtures as compared toawof the salt-free water + malonic acid system represent the effects of water↔ion and malonic acid↔ion interactions (here the ions are NH+4 and SO24−). In this example, measured water activities are relatively well represented by the AIOMFAC calculations, with slightly higher deviations at lower water contents. The many data points in this dataset, with compo-sitions covering a variety of malonic acid:ammonium sulfate ratios, are one way to facilitate that the model parameter op-timization is not biased towards a specific organic:inorganic mixing ratio.
4.3 Liquid-liquid equilibrium data
9166 A. Zuend et al.: Extended parameterization of the AIOMFAC model
0.0 0.2 0.4 0.6 0.8 1.0
x'(organic) (electrolyte-free basis) 0.0
0.2 0.4 0.6 0.8 1.0
w
a
te
r
a
c
ti
v
it
y
a
w
0 1
xj
x(1) x(2)
xions(3)
Fig. 3. Water activities in the ternary system water (1) + malonic
acid (2) +(NH4)2SO4(3) at 298 K. Experimental bulkawdata ( ) by Salcedo (2006) and corresponding calculated values ( ) at var-ious mixture compositions, as shown in the bar graphs. The error bars represent the modelaw-sensitivity to a composition variation byxtol=0.01. The dashed curve shows the calculated water activ-ity of the salt-free solvent mixture.
certain temperature are determined. One way to compare AIOMFAC predictions with experimental data, is to perform a liquid-liquid phase separation computation, for which an initial mixture composition of the experimental tie-line is needed as input. To do this, we use the computation method for liquid-liquid phase separation described by Zuend et al. (2010), using AIOMFAC for the Gibbs energy calculation. An initial mixture composition, with mole fractionsxinitj , on an unstable/metastable point on a tie-line is generated by
xjinit=1
2
xjα+xjβ, (19)
wherexjαandxjβ are the experimentally determined compo-sitions of the two liquid phases,αandβ, at equilibrium. This way, measured and calculated phase compositions can be di-rectly compared. However, this approach unfortunately in-volves high computational costs that cannot be avoided when a reliable detection of the LLE composition is essential. Such computational demands are acceptable when only a few LLE data points are used with a small number of fit parameters. In this study, where thousands of LLE data points are used and ∼250 parameters need to be determined simultaneously, tak-ing up to a million objective function evaluations includtak-ing billions of AIOMFAC calls – the described LLE prediction approach is simply unfeasible. Thus, a different, computa-tionally more efficient use of LLE data is mandatory.
To overcome this technical barrier, we make use of the thermodynamic phase equilibrium conditions. Based on the reference state definitions of AIOMFAC, activities of the dif-ferent independent components have to be equal in coexist-ing phases, i.e.,as(x),α=as(x),βin case of solvent components and IAPαMX=IAPβMXin case of electrolytes, where
IAPMX=
aM(m)ν +
×
aX(m)ν −
(20) is the molal ion activity product of electrolyte unit “Mν+Xν−” with ν+ cations M and ν− anions X (Zuend
et al., 2010). This isoactivity condition enables a direct cal-culation and comparison of activities in coexisting phases at the experimental LLE compositions. Typical for or-ganic + water + salt LLE is that only a very small amount of electrolyte is dissolved in the organic-rich phase and only a small part of the organic fraction is present in the aqueous-electrolyte phase. This makes the sensitivity to small errors in phase composition very high, because tiny amounts of electrolyte need to be detected accurately in a predominantly aqueous-organic phase. Moreover, the activity sensitivities of electrolytes and organics in their respective concentration-poor phases are very high. Therefore, a good choice forQrefd,u
and especially the consideration of the sensitivities byQtold,u
is of crucial importance. The objective function terms of LLE data are therefore defined in a dataset- and component-specific manner. For each component in a dataset d, the phase in which the activity sensitivitysja is smaller on av-erage, is defined as the reference phase, which is typically the phase where j is enriched. At a data pointu, Qrefd,u of a component j is then set to the calculated activity value (IAP in case of electrolytes) of j in the reference phase. The tolerance quantity is defined as the sum of the activ-ity sensitivities from both phases: Qtold,u=sja,α+sja,β. Note that according to the error propagation rule the expression
Qtold,u= r
sa,αj
2 +sja,β
2
should be used (as pointed out by a reviewer). However, since in most cases here the activ-ity sensitivactiv-ity in one phase is much larger than in the other phase, using the sum of sensitivities introduces little error. Hence, we use a relative activity deviation in the expres-sion of the objective function (Eq. 8) for LLE data. This “rel. activity deviation” is defined as a
β j−ajα
aαj+sa,αj +sa,βj for the case where phaseαis the reference phase of componentj
(otherwise all superscriptsα have to be interchanged to β
0 10 20 30
tie-line no. 0.0
0.1 0.2 0.3 0.4 0.5 0.6 0.7 0.8
|
re
l.
a
c
ti
v
it
y
d
e
v
ia
ti
o
n
s
|
0 1
xj
α
x(1) x(2) x(3)
xions(4)
0 1
xj
β
Fig. 4. Calculated relative activity deviations in the quater-nary LLE system water (1) + 4-methyl-2-pentanone (2) + acetic acid (3) + NaCl (4) at 308 K. Compositions of the two phasesαand
βare given in the bar graphs at each tie-line, measured by Govin-darajan and Sabarathinam (1995). Relative activity deviations and corresponding model sensitivities (error bars) are shown for water ( ), 4-methyl-2-pentanone ( ), acetic acid ( ), and rel. IAP devia-tions for NaCl ( ). For clarity, symbols of the different components at a tie-line are shifted slightly in x-axis direction.
as e.g., water. The reasons for this behavior are analogous to the ones discussed above in case of VLE data.
The described isoactivity condition method is computa-tionally efficient and enables an alternative way to use LLE data for the model parameter determination. For plots and evaluation of calculated and experimental ternary LLE data, we use the LLE phase separation computation approach as well, enabling a direct comparison of predicted and exper-imentally determined phase compositions. An example of this is shown in Fig. 5 for the ternary system water + tert-butanol + NaCl at 298 K. Panel (a) of Fig. 5 shows the mis-cibility gap mapped on a coordinate system that depicts the water contents of the two phases as a function of the water-free “dry” composition. Panel (b) shows the same system on a coordinate system that emphasizes the very different con-tents of tert-butanol and NaCl in the two phases. The phase separation computation using AIOMFAC predicts a slightly wider miscibility gap, but is in general agreement with the measurements. Neither the binary water + tert-butanol sys-tem nor the binary water + NaCl syssys-tem exhibit a liquid-liquid phase separation at any mixing ratio at 298 K. Hence, the phase separation in the ternary system can only be caused
by interactions attributed to the salting-out effect of ions on organics. The salting-out effect is mainly considered by means of the parameters representing the middle-range in-teractions between involved ions and organic main groups. For example, setting for testing purposes all middle-range organic↔ion parameters to zero, i.e., equal to the value of water↔ion interactions, results in a predicted single-phase solution. Thus, a good fit of AIOMFAC organic↔ion MR-parameters is essential for accurate representations of liquid-liquid equilibria.
4.4 Solid-liquid equilibrium data
Solid-liquid equilibria constitute mixture composition data, at which liquid mixtures are in equilibrium with a solid phase. In the case of binary systems at isothermal condi-tions, there is only one specific SLE-composition point, e.g., the saturated solution of a salt in water at 298 K (at a salt-specific equilibrium deliquescence relative humidity). For ternary systems at constant temperature, SLE data define a solubility limit curve of points at different mixture composi-tions. In case of ternary aqueous organic-inorganic systems, the salt, water or the organic compound can form crystalline solids, depending on the mixture composition and tempera-ture. Solid-liquid equilibria can become complicated when hydrates or mixed crystals form. Thermodynamic equilib-rium conditions require all solution components, present in the solid phase, to hold a specific liquid phase activity, or activity product (in case of salts, hydrates and mixed crys-tals) at different solution compositions in equilibrium with the same solid phase. For example, a ternary system of 2-ethoxyethanol + water + KCl in SLE with solid KCl, shown in Fig. 6, requires a constant molal ion activity product IAPKCl=Ksp(T ) at different compositions. A reference value for the solubility product Ksp(T ) can be calculated with AIOMFAC from the solubility limit in the correspond-ing binary aqueous system (in this example, water + KCl). Hence, the following information is needed for the use of SLE data: mixture compositions at solubility limit, tempera-ture, and composition of the solid phase.
In order to compare measured with calculated isothermal SLE data, AIOMFAC is used to calculate mixture composi-tions that fulfill the solubility limit equilibrium condicomposi-tions. For the following description of our method, let us assume for that a salt MX forms the solid phase. First, the solubil-ity product Ksp(T ) at the solubility limit of MX is calcu-lated from binary aqueous composition data. Second, at a given ternary composition the salt-free mole fraction compo-sition,xj,j′
9168 A. Zuend et al.: Extended parameterization of the AIOMFAC model
0.0 0.2 0.4 0.6 0.8 1.0
x'(electrolyte) (water-free basis)
0.0 0.2 0.4 0.6 0.8 1.0
x(
w
at
er
)
0 1 xj
α
0 1 xj
β
(b) (a)
Water (1) + tert-Butanol (2) + NaCl (3) Fig. S0157 (AIOMFAC_output_0058)
H2O (1) + tert-Butanol (2) + NaCl (3) Temperature: 298 K
x(1) x(2)
xions(3)
Water (1) + tert-Butanol (2) + NaCl (3)
0.00 0.02 0.04 0.06 0.08 0.10
x(electrolyte)
0.0 0.2 0.4 0.6 0.8 1.0
x(
or
ga
ni
c)
0 1 xj
α
0 1 xj
β
Fig. 5. Experimental and computed LLE phase compositions of the ternary system water (1) + tert-butanol (2) + NaCl (3) at 298 K. Measured
tie-line data ( ) by Gomis et al. (1996) and computed compositions ( ) using AIOMFAC with the phase separation prediction module (Zuend et al., 2010). (a) Phase diagram where the abscissa represents the water-free “dry” molar mixture composition,x′(NaCl). The solid gray and dashed red lines indicate coexisting phase compositions of the measured and calculated compositions, respectively (non-standard tie-lines in this coordinate system). (b) Phase diagram of the same system, plotted on mole fraction axis,x(NaCl) vs.x(tert-butanol). In this coordinate system, tie-lines maintain their standard meaning, i.e., initial (unstable) and stable end points are collinear. In (b), experimental and calculated tie-lines intersect at the initial compositions,xjinit, used for the phase separation computations.
0.0 0.2 0.4 0.6 0.8 1.0
x'(water) (electrolyte-free basis) 0.00
0.01 0.02 0.03 0.04 0.05 0.06 0.07 0.08
x
(e
le
c
tr
o
ly
te
)
0 1
xj
x(1) x(2)
xions(3)
Fig. 6. Experimental and calculated SLE compositions of the
sys-tem water (1) + 2-ethoxyethanol (2) + KCl (3) at 298 K, saturated with KCl. SLE composition measurements ( ) by Chiavone-Filho and Rasmussen (1993) and calculated solubility limits ( ) using the IAPKCl of the saturated binary water + KCl solution as reference. Error bars representxtol=0.01.
0.80 0.82 0.84 0.86 0.88 0.90 0.92
x(water) (electrolytes dissociated) 0.0
0.1 0.2 0.3 0.4 0.5 0.6 0.7
m
e
a
n
m
o
la
l
a
c
ti
v
it
y
c
o
e
ff
.
γ
0 1
xj
x(1) x(2)
xions(3)
Fig. 7. Mean molal activity coefficientsγ± of KCl in the system water (1) + ethanol (2) + KCl (3) at 298 K. Experimental values ( ) derived from EMF measurements by Lopes et al. (1999), calculated
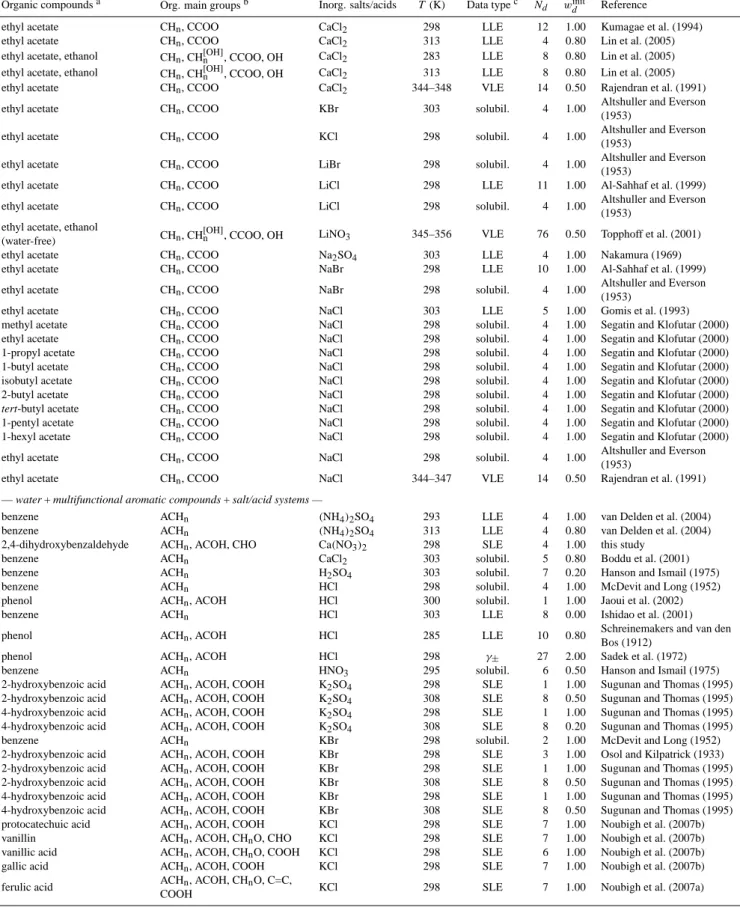
group name ions →
main groups ↓ H+ Li+ Na+ K+ NH4+ Mg2+ Ca2+ Cl- Br- NO3- HSO4- SO4
2-alkyl CHn 19 31 184 68 90 16 35 256 35 43 5 104
alkyl bonded to hydroxyl group CHn
[OH] 10 19 91 40 43 13 20 140 21 23 1 51
hydroxyl OH 10 19 91 40 43 13 20 140 21 23 1 51
carboxyl COOH 4 9 47 33 48 6 6 66 9 18 4 56
ketone CHnCO 4 2 40 9 3 2 2 37 4 7 14
aldehyde CHO 1 4 1 1 1 1 4 1 2 2
ether CHnO 2 7 24 14 4 1 5 45 5 2 1 4
ester CCOO 4 14 2 5 19 4 1 1
alkenyl C=C 1 1 4 1 7 1 1 6 1 4 1 4
aromatic
hydrocarbon ACHn 7 8 19 26 4 5 2 40 8 6 1 16
aromatic
carbon-alcohol ACOH 3 7 14 24 1 5 1 32 6 4 13
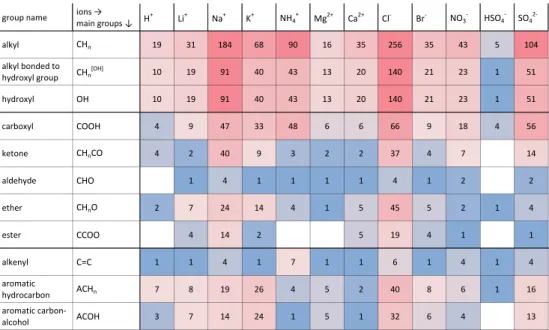
Fig. 8. Distribution of datasets for the determination of organic main group↔ion interaction parameters. The number of different datasets associated with each interaction pair is shown. Percentile-wise coloring based on the number of datasets suggests the degree of confidence (based only on statistical considerations) in the determined interaction parameters: blue (low confidence) to red (high confidence). Main group CHnrepresents here also the specific alkyl main groups CH[nalc]and CHn[alc−tail], as they share the same main group↔ion interaction parameters.
Powell’s hybrid method (Mor´e et al., 1980, 1984) to find the root of IAPKCl−Ksp(T )=0 efficiently. If the solid phase is an organic, an analogous procedure is used, by keeping the organic-free mole fraction composition constant and varying the organic amount. Therefore, in case of SLE data,Qrefd,u
is the experimentally determined composition in mole frac-tions,Qcalcd,uthe corresponding mole fractions calculated with AIOMFAC as described above, andQtold,u=xtol(=0.01).
Some datasets state the solubility limit of an organic com-pound in aqueous electrolyte solutions that are in equilibrium with an organic-rich liquid phase (e.g., Segatin and Klofutar, 2000). If the condition is true, that virtually no electrolyte is present in the organic-rich liquid phase, such ternary LLE-solubility data can be used analogously to SLE LLE-solubility data. This condition is fulfilled only in the case of rather hydrophobic organic compounds, which also exhibit limited solubility in pure water.
4.5 Electromotive force data
In EMF measurements, the electric potential difference be-tween two different electrodes in an electrolyte solution (gal-vanic cell) is recorded as a function of pressure, temperature, and solution composition. Using the modified Nernst equa-tion and a system-specific activity coefficient model, such as a Pitzer model, mean molal activity coefficientsγ± can be calculated from the EMF data at different electrolyte mo-lalities (e.g., Robinson and Stokes, 2002; Roy et al., 1972a; Esteso et al., 1989). Mean molal activity coefficients from
EMF data are derived with the reference state of an infinitely dilute electrolyte solution in the corresponding solvent mix-ture, while the reference state of electrolytes in AIOMFAC is the infinitely dilute solution in pure water. Hence, to cor-rectly use such EMFγ±data, we run AIOMFAC in a mode that also refers to the aqueous-organic solvent mixture as ref-erence state. Figure 7 shows suchγ± data and associated model sensitivities for the system water + ethanol + KCl. In case of EMF data,Qrefd,uandQcalcd,u are measured and calcu-latedγ±on molal solvent mixture reference state basis and
Qtold,uis the correspondingγ±sensitivity,sγ±.
4.6 Database overview