American Journal of Applied Sciences 6 (6): 1122-1125, 2009 ISSN 1546-9239
© 2009 Science Publications
1122
The Effects of Excess Oxygen to Mixture on the Gasses
Emissions of a Gasoline Engine
Waleed Momani
Department of Mechanical Engineering, Faculty of Engineering Technology,
Al Balqa Applied University, Amman, Jordan
Abstract: Problem statement: The effects of excess feeding oxygen to the fuel-air mixture on the exhausts gasses emissions concentrations are investigated here. It is known that spark-ignition and diesel engines are considered as major sources of urban air pollution; such pollutants are CO2, CO, HC. Hence, many techniques have been used to decrease such emissions such as: Catalytic converters, oxidizers, traps and Diesel Particulate Filters (DPF), but these techniques have some disadvantages represented by: Forming back pressure which affects the engine performance, plugging and high costs.
Approach: In present study the effects of feeding more oxygen to the combustion mixture is studied
experimentally. Results: It was found from tests applying on an engine that excess oxygen has positive results in decreasing concentration of both CO and HC's. Conclusion/Recommendations: CO2concentration at oxygen injection test is greater than that at without oxygen injection at the two cases: With load and without load tests and at nearly all engine speeds. CO concentration at oxygen injection test is much less than that at without oxygen injection at the two cases: With load and without load tests and at nearly all engine speeds. HC concentration at oxygen injection test is less than that at without oxygen injection at the two cases: With load and without load tests and at nearly all engine speeds. It also recommended using more amount of oxygen in the future to find the optimal value of oxygen can be fed and if anther fuel additives can be used.
Key words: Fuel-air mixture, exhaust emissions, excess oxygen feeding
INTRODUCTION
If you look for minutes and imagine how much these vehicles on the streets are producing emissions, you will know what will be our environment for just next year. Emissions from such engines are huge and contribute really in global worming.
These engines, as it's known, have eight locations which produce air pollutants, such as: Crankcase, brake system, oil system and the main source is the exhaust system. Exhaust can produce many kinds of pollutants like: CO, CO2, NOx, SOx, HC and Particulate Matters (PM). The relative amounts depend on engine design and operating conditions but they are of order: NOx, 500-1000 ppm, CO: 200 g Kg−1 of fuel, HC: 3000 ppm. Pollutant emissions can be substantially reduced by carefully controlling the characteristics of engine operation, particularly combustion. [1], [3]. A number of parameters affecting engine performance can influence the amount of emissions:
• The air-fuel ratio
• Rate of air-fuel mixing (oxygen content) • Flame temperature
• Combustion lag • Residence time
These, in turn, can be strongly influenced by the following:
• The fuel delivery system (including carbureted versus injected and sophistication of
• injection/carburetion technology)
• The size and shape of the cylinders and pistons • The nature of the exhaust gas path (direct versus
recirculated).[4],[6].
In addition, high compression ratios in the cylinders can increase fuel efficiency, decreasing directly the amount of CO2 emissions and, indirectly, HC and CO emissions.
Am. J. Applied Sci., 6 (6): 1122-1125, 2009
1123 a relation between the oxygenated fuel and the soot layer formation, their experiments were conducted at a 1200 rpm, moderate-load operating condition using a modern-technology, 4-stroke, heavy duty DI diesel engine with optical access. Images of broadband natural luminosity (i.e., light emission without spectral filtering) from the combustion chamber, coupled with heat-release and efficiency analyses, are presented for three kinds of test-fuels. One test-fuel (denoted GE80) was oxygenated with tri-propylene glycol methyl ether; the second (denoted BM88) was oxygenated with di-butyl maleate. The overall oxygen contents of these two fuels were matched at 26% by weight. The third test-fuel (denoted CN80) was a non-oxygenated, 80-cetane blend of two C16H34 primary reference fuels. The compositions of the three test-fuels were tailored such that each fuel had the same ignition delay at the given operating condition. Oxygen content, combustion phasing and adiabatic flame temperature also were carefully matched to isolate (as much as possible) the effects of oxygenate molecular structure on combustion and soot-formation processes.[5], [6].
The present study is an experimental one and it is applied on a Honda G 200 engine: Single cylinder with 197 cc swept volume. The engine is run for a period of time until the cooling water and lubricating oil have been brought to define operating temperature. After a period of time the concentration of CO2, CO and HC are recorded, this represents the first part of the experimental work-running the engine without any oxygen feeding-. The second part of the experimental work is to inject pure oxygen before the throttle from a cylinder contains oxygen at 120 bar pressure, during full load engine operating.[9], [10].
The data are record in two cases: an engine with load and on the second part without load at different engine speeds (RPM). The final results are shown in Fig. 1-6.
RESULTS
Figure 1-6 shows the results of the present study and compare exhaust emission ratios of the studied engine in both cases with no excess oxygen feeding and with those in the present of oxygen feeding. In the present study CO2%, HC (ppm) and CO% are measured in two cases with load engine and without load engine and then with excess oxygen or without oxygen feeding. From Fig. 6 it can be noticed that the excess pure oxygen into the combustion systems improve their performance by changing the percentage or concentration of the combustion products.
500 1000 1500 2000 2500 3000 3500 12
13 14 15 16 17
18 With oxygen
Without oxyge n
N ( RPM)
C
O
2
(
%
)
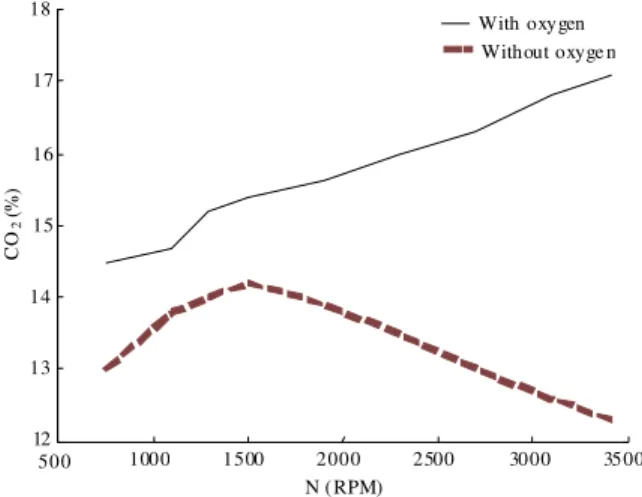
Fig. 1: CO2% Vs engine speed (RPM) with oxygen and without oxygen feeding with no load engine test
500 1000 1500 2000 2500 3000 3500
10 11 12 13 14 15 16 17 18 19
20 With o xyge n
Without oxyge n
N (RP M)
C
O2
(
%
)
Loa d test
Fig. 2: CO2% Vs engine speed (RPM) with oxygen and without oxygen feeding
500 1000 1500 2000 2500 3000 3500
0 0.5 1 1.5 2 2.5 3
3.5 Wit h O2
Without O2
N (RPM)
C
O
(
%
)
No l oad test
Am. J. Applied Sci., 6 (6): 1122-1125, 2009
1124
500 1000 1500 2000 2500 3000 3500
1. 6 1. 8 2 2. 2 2. 4 2. 6 2. 8
3 With O
2
Without O2
N (RPM) Load test
C
O
(
%
)
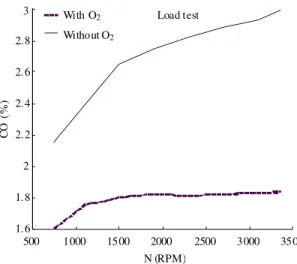
Fig. 4: CO% Vs engine speed (RPM) with load test
5 00 1 000 1 500 20 00 25 00 30 00 35 00
80 100 120 140 160 180 200 220 240
Wit h O2
Wi tho ut O2
N (RPM) No load test
H
C
(
p
p
m
)
Fig. 5: HC (PPM) Vs engine speed (RPM)
500 1000
1500 2000 2500 3000 3500 120
130
140
150
160
170
180
190
200
210
220
Without O2
N (RPM) Load test
H
C
(
P
P
M
)
With O2
Fig. 6: HC (PPM) Vs engine speed (RPM)
Figure 1 shows that the CO2 % is more in the case of more oxygen since more oxygen means that the chance of more complete combustion of fuel becomes possible, so more CO2 will produce. This can be noticed for the two cases: With load test Fig. 2 and without load test-Fig. 1. Another thing from test-Fig. 1-6 it can be noticed that CO2% increase as the engine speed increases at the case of no load test and without oxygen feeding, while for the same case and with the existence of oxygen feeding CO2 % increases into some specific value (RPM = 1500) then it decreases, the reason beyond that is as engine speed increases (with no load) it needs more oxygen and so CO2 formation will become less. In the contrary if there is a load in both cases with oxygen or with no oxygen the CO2 % decreases as engine speed increase. Figure 3 and 4 show that the CO% increases as the engine speed increases for the both cases with oxygen feeding or no oxygen feeding and for the two tests: with load and with no load, but the main thing is that CO% in the case of oxygen feeding is much less than that of with no oxygen feeding. It can be noticed that CO% in the case of oxygen feeding is less than that of with no oxygen feeding in order six times. Figure 5 and 6 show the HC in PPM Vs the engine speed, for the two loaded and no loaded cases. It can be notices that HC (PPM) decreases as the engine speed increase and the HC (PPM) with the existence of oxygen feeding is less than that of no oxygen feeding in order of about two times.
DISCUSSION
This study is considered as a base study in the field of research for saving fuel consumption. If such studies are continued the optimum ration between air (oxygen) and fuel will be reached. Results showed if more oxygen is feeding into the combustion chambers in any engine, then more combustion will be happened and bad emissions become less because they will be oxidized-as last figures showed. All exhaust emissions are decreased as more oxygen is fed into the combustion chambers. The exhaust analyzer results used in this study showed a good results compared with other engines tested without excess oxygen simultaneously. Also during the test the noise transmitted by the engine sound in the case with oxygen feeding is less than that without excess oxygen and the sound becomes softer.
CONCLUSION
Am. J. Applied Sci., 6 (6): 1122-1125, 2009
1125 • CO2 concentration at oxygen injection test is
greater than that at without oxygen injection at the two cases: With load and without load tests and at nearly all engine speeds.
• CO concentration at oxygen injection test is much less than that at without oxygen injection at the two cases: With load and without load tests and at nearly all engine speeds.
• HC concentration at oxygen injection test is less than that at without oxygen injection at the two cases: with load and without load tests and at nearly all engine speeds.
REFERENCES
1. API-agency, 2007. API-Reports USA. Direct web link: www.acde.ca.gov. pp:1-10.
2. Archie, W. and Culp J., 1991. Principles of Energy Conversion.., McGraw Hill, USA. ISBN: 10:007014902X, 2nd Edition. pp: 576-580. 3. Beg, N., 1999. Scrappage programs. Annex to
Thailand: Motorcycle Fleet Upgrade: Reducing Local and Global Emissions in Bangkok. Direct Web link: www.esmap.org/filez/pub/Thailand and reducing emissions Bangkok.pdf
4. Bose, R., 1998. Automotive energy use and emissions control: A simulation model to analyze transport strategies for Indian metropolises. Energy. Policy Journal, 26: 1001-1016:1-20. DOI: 10.1016/S0301-4215(98)00045-7
5. Charles, J., J. Mueller and Glen C., 2002. Effects of Oxygenated Compounds on Combustion and Soot Evolution in a DI Diesel Engine: Broadband Natural Luminosity Imaging.
https://shop.sae.org/technical/papers/2002-01-1631 6. Eskeland, G. and Jimenez E., 1991. Choosing
policy instruments for pollution control: A review. Direct web link:
http://econqa.worldbank.org/external/default/main? pagePK=64165259&theSitePK=469372&piPK=64 165421&menuPK=64166093&entityID=00000926 5_3961001045114
7. John, B., 1988. Internal Combustion Engine Fundamentals. McGgraw Hill, USA., ISBN: 10:007028637X, 2nd Edn., pp:850- 930.
8. Minato, K., 2000. Automotive technology and regulations on fuel economy and exhaust emissions. JSAE J., 54: pp:11-17.
9. Richard, S., 1992. Introduction to Internal Combustion Engines. The Macmillan Press Ltd., pp: 400-574.