Março, 2014
Júri:
Presidente: Prof. Doutora Maria Madalena Alves Campos de Sousa Dionísio Andrade Arguente: Doutora Ana Mafalda Almeida Peixoto Ribeiro
Vogal: Doutora Isabel Alexandra de Almeida Canento Esteves Esperança
Orientador:
Isabel A. A. C. Esteves, Investigadora Auxiliar, FCT/UNL Requimte
Co-orientadores
: José Paulo Barbosa Mota, Professor Catedrático, FCT/UNL
Mário Fernando José Eusébio, Professor Auxiliar, FCT/UNL
Bárbara Cassiana Rodrigues Camacho
Licenciada em Ciências da Engenharia Química e Bioquímica
Experimental Gravimetric Adsorption Equilibrium
of n-Alkanes and Alkenes, Carbon Dioxide
and Nitrogen in MIL-53(Al) and Zeolite 5A
i
Bárbara Cassiana Rodrigues Camacho
Licenciada em Ciências da Engenharia Química e Bioquímica
Experimental Gravimetric Adsorption Equilibrium
of n-Alkanes and Alkenes, Carbon Dioxide
and Nitrogen in MIL-53(Al) and Zeolite 5A
Dissertação para obtenção do Grau de Mestre em
Engenharia Química e Bioquímica
Orientador:
Doutora Isabel Alexandra de Almeida Canento Esteves
Co-orientadores:
Professor Doutor José Paulo Barbosa Mota
Professor Doutor Mário Fernando José Eusébio
Monte da Caparica, Faculdade de Ciências e Tecnologia, Universidade de Lisboa
iii
Experimental Gravimetric Adsorption Equilibrium
of n-Alkanes and Alkenes, Carbon Dioxide
and Nitrogen in MIL-53(Al) and Zeolite 5A
Copyright ©
v
Dedico esta conquista, com todo o carinho aos meus Pais,
vii
Agradecimentos
A elaboração da tese, pela sua finalidade académica, consiste em um trabalho individual, contudo há vários contributos que não podem nem devem deixar de ser realçados, uma vez que sem eles a realização desta não seria possível. Como tal sinto-me grata pelo apoio, pelo carinho demonstrado, pelas críticas construtivas, sempre fundamentadas por bases fortes e extremamente impulsionadoras para a realização de uma tarefa como esta, em que se pretende rigor máximo e que representa o culminar de cinco anos de aprendizagem.
Neste contexto, dedico um especial agradecimento à Doutora Isabel Esteves, pelo profissionalismo com que me orientou em uma área tão delicada como a adsorção. Agradeço a forma como abraçou esta causa, partilhando experiências, apoiando e motivando em todos os momentos, assim como, de um modo mais pessoal, a sua amizade.
Ao Professor Doutor José Paulo Mota, pelo exemplo de competência científica, pelas inúmeras trocas de impressões, correcções e comentários, que representaram uma mais-valia na realização deste trabalho.
Ao Professor Doutor Mário Eusébio, por me ter trazido até este grupo, que se distingue pelo trabalho de excelência que realiza e do qual muito me orgulho de ter feito parte.
Ao Doutor Rui Ribeiro, pela motivação, boa disposição com que sempre me auxiliou nas mais diversas tarefas que surgiram e claro pela companhia nas extensas horas de trabalho laboratorial. Ao Doutor Ricardo Silva, pelo interesse e preocupação que permanentemente demonstrou em me ajudar, até mesmo nos conhecimentos mais básicos.
Aos meus colegas de laboratório Eliana Órfão, João Gomes e Inês Valente, que sempre se apresentaram dispostos a contribuir, pela convivência diária e a entreajuda que constantemente existiu entre nós.
Á Dona Maria José Carapinha, pela sua simpatia e forma carinhosa com que continuamente me ajudou a resolver os mais variados problemas e questões que surgiram ao longo destes tempos.
viii
Á Joana Afonso, pela enorme amizade que criamos ao longo deste período académico e que de certo levo comigo, agradeço a partilha dos desabafos, as conversas e risos intermináveis. Um agradecimento muito especial a ti e á tua família por várias vezes me
ajudarem a sentir em “casa”.
Á Sofia Messias, Rafaela Santos, Nádia Carmo, pela vossa amizade, companheirismo e maneira como sempre me estimularam não só na concretização da tese, mas também na realização de todo o curso. Ao Alexander Fernandes e Igor Fernandes, pelas conversas e por toda a compreensão ao longo destes anos, um muito obrigado pelos momentos mais descontraídos, que inúmeras vezes faziam falta.
Aos meus amigos, Sara, Isabel, Érica, Catarina, João Tiago, Gonçalo, Hugo, Tiago António, Pedro, Diogo a todos vocês que não menciono, mas que sabem bem quem são, agradeço pela maneira como me apoiaram e encorajaram ao longo deste processo, aceitando constantemente as minhas ausências.
Ao meu irmão, Décio Camacho, pelo incentivo, pelo que representa para mim e por ser sempre a melhor companhia que podia ter durante esta caminhada. Ao meu sobrinho Santiago Camacho, por me premiar com a alegria de uma criança e um amor incondicional. A vocês fico grata pela força, ainda que inconsciente, me transmitiram e por pertencerem á família de que tanto me orgulho. Um obrigado em particular, para ti avó Maria da Conceição, que te tornas-te na minha estrela guia.
ix
Finalmente, aos mais importantes, os meus pais, aos quais dedico esta tese e que embora nunca tenha maneira suficiente de lhes mostrar o quanto estou agradecida, aqui fica o meu mais sincero obrigada! Obrigada pela maneira como me incutiram a alegria de viver e a confiança necessária para realizar os meus sonhos, por terem sonhado e percorrido estes caminhos comigo, afinal sem vocês nada disto seria possível. Ao longo destes anos vencemos várias batalhas e vivemos momentos inesquecíveis, uns mais positivos, outros nem tanto, mas que só me trouxeram certezas e uma delas, é que são sem dúvida os melhores Pais, o meu verdadeiro tesouro. Obrigada Mãe por seres o pilar da minha vida, obrigada Pai por seres o meu herói. Obrigada por fazerem de mim, aquilo que hoje sou. Não posso por fim, deixar de vos felicitar, porque esta conquista não é só minha, é também vossa, é da nossa família.
Por fim, a todos os familiares e amigos, que embora não citados, de uma maneira ou de outra tiveram um papel fundamental no desenvolvimento deste trabalho e para os quais sou uma esperança, resta-me afincadamente não vos desiludir.
A todos, sem excepções, um autêntico e enorme obrigado.
xi
Abstract
The objective of this work was the measuring of adsorption equilibrium, by the gravimetric method. Experimental results are presented for the adsorption equilibrium of the series of n-alkanes, ethylene, nitrogen and carbon dioxide in two microporous materials, the metal-organic framework, MIL-53(Al) and zeolite 5A. Both of them have desirable characteristics for adsorption processes, such as the capture and storage of carbon dioxide, natural gas storage, separation of components of biogas, and separation of olefin/paraffin. The determination of the equilibrium of the pure components (ethane, propane, butane, ethylene, carbon dioxide and nitrogen) covers a wide range of thermodynamic conditions; temperatures between 303.15K and 373.15K, as well as pressure values between 0 and 50 bar. The adsorption equilibrium data were analyzed through the global adjustment for each adsorbate/adsorbent system, using the Sips and Toth models. The isosteric heat was also determined. The experimental data of methane, carbon dioxide and nitrogen were correlated successfully by the potential theory of adsorption collapsing into a single characteristic curve, independent of temperature. This analysis allows the extrapolation of adsorption data for other gases, for which no experimental data is still known. The adsorption capacity is generally higher in MIL-53(Al) than in zeolite 5A, and in the two adsorbents, the preferred adsorption capacity for carbon dioxide is a good indication that these materials have a strong potential in the capture and storage of carbon dioxide, in the purification of biogas or purification of methane from natural gas.
xiii
Resumo
Este trabalho, tem por objectivo a medição de equilíbrios de adsorção, através do método gravimétrico. Os resultados experimentais são apresentados para o equilíbrio de adsorção da série de alcanos, etileno, dióxido de carbono e azoto em dois materiais microporosos, a estrutura metálica-orgânica, MIL-53(Al) e o zeólito 5A. Ambos com características desejáveis em processos de adsorção, como sejam, a captura e armazenamento de dióxido de carbono, armazenamento de gás natural, separação de componentes do biogás, e separação de olefinas/parafinas. A determinação dos equilíbrios dos componentes puros (etano, propano, butano, etileno, dióxido de carbono e azoto) cobre uma vasta gama de condições termodinâmicas; temperaturas entre 303.15K e 373.15K, assim como valores de pressão entre 0 e 50 bar. Os dados de equilíbrio de adsorção, foram analisados, através do ajuste global por adsorbato para cada um dos adsorventes, recorrendo aos modelos de Sips e Toth. O calor isostérico também foi determinado. Os dados experimentais de metano, dióxido de carbono e azoto, foram correlacionados com sucesso pela teoria do potencial de adsorção, colapsando em uma única curva característica, independente da temperatura. Esta análise permite a extrapolação de dados de adsorção para outros gases, para os quais ainda não são conhecidos dados experimentais. A capacidade de adsorção é, em geral, superior no MIL-53(Al) do que no zeólito 5A, sendo que em ambos os adsorventes, a capacidade de adsorção preferencial para o dióxido de carbono é um bom indicador de que estes materiais, apresentam um forte potencial na captura e armazenamento de dióxido de carbono, na purificação de biogás ou na purificação de metano proveniente do gás natural.
xv
List of Contents
1. Introduction ... 1
1.1. Motivation ... 1
1.2. Structure of the Thesis ... 4
2. Background ... 5
2.1. Adsorption Phenomena ... 5
2.2. Adsorption Equilibria ... 7
2.2.1. Adsorption Hysteresis ... 9
2.3. Experimental Methods for Measuring the Adsorption Isotherms ... 11
2.3.1. The Gravimetric Method ... 12
2.3.2. The Volumetric Method ... 13
2.3.3. The Calorimetric Method ... 13
2.4. Adsorbent Materials ... 14
2.4.1. 5A Zeolite ... 15
2.4.2. Metal Organic Framework MIL-53(Al) ... 17
2.5. Adsorbates ... 18
2.5.1. Carbon Dioxide ... 19
2.5.2. Nitrogen ... 19
2.5.3. N-Alkanes and Alkenes ... 20
3. Experimental Work on Adsorption ... 21
3.1. Characterization of Adsorbents ... 21
3.1.1. Characterization Techniques ... 21
3.1.2. Mercury Porosimetry ... 22
xvi
3.1.4. Nitrogen Adsorption at 77K ... 23
3.2. Adsorption Equilibrium Measurements ... 24
3.2.1. Materials ... 24
3.2.2. Experimental Description ... 25
3.2.3. Adsorbent Sample Pre-Treatment ... 30
3.2.4. Experimental Apparatus ... 31
3.2.5. Experimental Procedure ... 35
4. Experimental Results and Data Analysis ... 37
4.1. Amount of Gas adsorbed and Buoyancy Forces Account ... 37
4.1.1. Adsorption Isotherms ... 43
4.2. Theorical Methods ... 45
4.2.1. Sips and Toth Isotherm Models ... 46
4.2.1.1. Isosteric heat of Adsorption ... 48
4.2.1.2. Adsorption Results using Sips and Toth approaches ... 49
4.2.2. Adsorption Potential Theory ... 68
4.2.2.1. Results and Discussion ... 71
5. Conclusions and Future Work ... 75
Appendix A: Characterization of Adsorbents ... 77
Appendix B: Equipment Description ... 83
Appendix C: Tables and Figures of Experimental Results ... 87
Appendix D: Data Analysis ... 110
xvii
List of Figures
Figure 2.1: The six types of adsorption isotherms, as classified by IUPAC [26]. Specific amount
adsorbed versus relative pressure P/P0, where P0 is the saturation vapor pressure... 8
Figure 2.2: The four types of adsorption hysteresis as classified by IUPAC [31]. Amount adsorbed versus relative pressure P/P0, where P0 is the saturation vapor pressure. ... 10
Figure 2.3: Typical Structure of zeolite type A (left) and image of the sample of zeolite 5A, used in the experimental work (right) [91]. ... 16
Figure 2.4: Structure of the MIL-53(Al) in two conformations (lp) and (np) (left) [53]. And image of the sample of MIL-53(Al) used in the experimental work. ... 18
Figure 3.1: Gravimetric measurements in controlled environments. Comparison of conventional instrument (left) and magnetic suspension balance (right) [58]. ... 26
Figure 3.2: Measuring position with sample connected to the balance (left) and automatic decoupling [Zero Point position (ZP)] of the measuring load in order to tare and calibrate the balance (right) [58]. ... 27
Figure 3.3: Simultaneous measurement of adsorption and density. Comparison of Zero Point (ZP), Measuring Point 1 (MP1) and Measuring Point 2 (MP2) positions [58]. ... 28
Figure 3.4: Magnetic Suspension Balance (MSB) components [58, 59]. ... 29
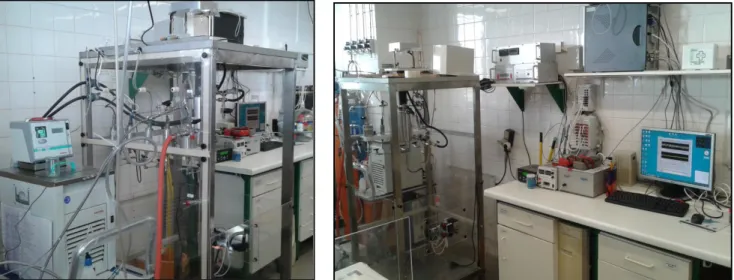
Figure 3.5: Pictures of the experimental apparatus used in the equilibrium measurements. .... 31
Figure 3.6: Schematic diagram of the experimental apparatus used in the equilibrium. ... 31
Figure 3.7: Inert, component and vacuum feed streams of the feed system unit. ... 33
Figure 3.8: Pictures of the gravimetric unit. ... 33
Figure 3.9: Pictures of the measuring unit and temperature control. ... 34
Figure 3.10: Pictures of the measurement and pressure control system. ... 34
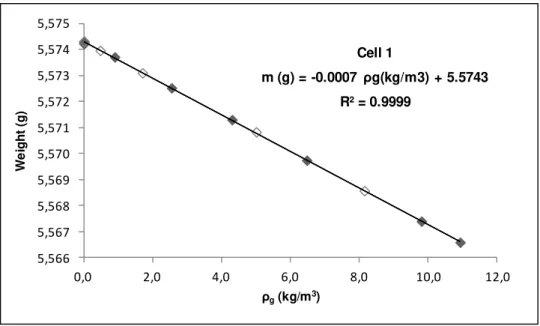
Figure 4.1: Blank calibration of sample holder for Cell 1, used in the adsorption measurements. Filled symbols and open symbols denote adsorption and desorption data, respectively. ... 39
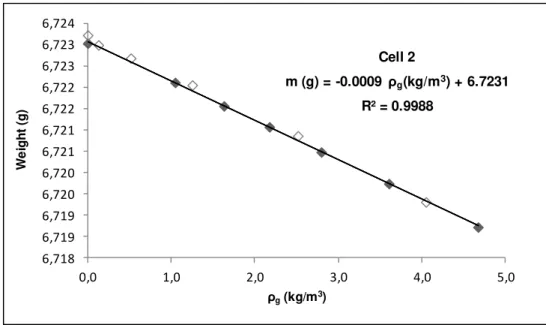
Figure 4.2: Blank calibration of sample holder for Cell 2, used in the adsorption measurements. Filled symbols and open symbols denote adsorption and desorption data, respectively. ... 39
xviii
Figure 4.4: Analysis of adsorption equilibrium measurements of the He using sample holder no.2. The experiments using a non-adsorbing gas at high temperature provides the mass and density of the MIL-53(Al) sample. Filled symbols and open symbols denote adsorption and desorption data, respectively... 41
Figure 4.5: Experimental single-component adsorption for N2 at 303.22K for MIL-53(Al). Filled symbols and open symbols denote adsorptionb and desorption data, respectively. ... 44
Figure 4.6: Experimental single-component adsorption for CO2 at 303.16K, 323.18K and 353.37K for MIL-53(Al). Filled symbols and open symbols denote adsorption and desorption data, respectively. ... 45
Figure 4.7: Global fitting of the experimental N2 adsorption data in MIL-53(Al) by the Sips isotherm. Filled symbols and open symbols denote adsorption and desorption data, respectively... 51
Figure 4.8: Global fitting of the experimental N2 adsorption data in MIL-53(Al) by the Toth isotherm. Filled symbols and open symbols denote adsorption and desorption data, respectively... 51
Figure 4.9: Global fitting of the experimental CO2 adsorption data in MIL-53(Al) by the Sips isotherm. Filled symbols and open symbols denote adsorption and desorption data, respectively... 52
Figure 4.10 : Global fitting of the experimental CO2 adsorption data in MIL-53(Al) by the Toth isotherm. Filled symbols and open symbols denote adsorption and desorption data, respectively... 52
Figure 4.11: Global fitting of the experimental C2H6 adsorption data in MIL-53(Al) by the Sips isotherm. Filled symbols and open symbols denote adsorption and desorption data, respectively... 53
Figure 4.12 : Global fitting of the experimental C2H6 adsorption data in MIL-53(Al) by the Toth isotherm. Filled symbols and open symbols denote adsorption and desorption data, respectively... 53
Figure 4.13: Global fitting of the experimental C2H4 adsorption data in MIL-53(Al) by the Sips isotherm. Filled symbols and open symbols denote adsorption and desorption data, respectively... 54
Figure 4.14: Global fitting of the experimental C2H4 adsorption data in MIL-53(Al) by the Toth isotherm. Filled symbols and open symbols denote adsorption and desorption data, respectively... 54
xix
Figure 4.16: Global fitting of the experimental CO2 adsorption data in zeolite 5A by the Toth isotherm. Filled symbols and open symbols denote adsorption and desorption data, respectively... 56
Figure 4.17: Global fitting of the experimental C2H4 adsorption data in zeolite 5A by the Sips isotherm. Filled symbols and open symbols denote adsorption and desorption data, respectively... 56
Figure 4.18: Global fitting of the experimental C2H4 adsorption data in zeolite 5A by the Toth isotherm. Filled symbols and open symbols denote adsorption and desorption data, respectively... 57
Figure 4.19: Single-component adsorption isotherms for CO2 and N2 at 303.15K. Symbols denote experimental data (filled symbols and open symbols denote adsorption and desorption data, respectively) and lines are the predictions from the Sips isotherm model. ... 58
Figure 4.20: Graph in log scale of the single-component adsorption isotherms for CO2 and N2 at 303.15K. Symbols denote experimental data (filled symbols and open symbols denote adsorption and desorption data, respectively) and lines are the predictions from the Sips isotherm model. ... 59
Figure 4.21: Single-component adsorption isotherms for CO2 and CH4 at 303.15K. Symbols denote experimental data (filled symbols and open symbols denote adsorption and desorption data, respectively) and lines are the predictions from the Sips isotherm model. ... 60
Figure 4.22: Graph in log scale of the single-component adsorption isotherms for CO2 and CH4 at 303.15K. Symbols denote experimental data (filled symbols and open symbols denote adsorption and desorption data, respectively) and lines are the predictions from the Sips isotherm model. ... 60
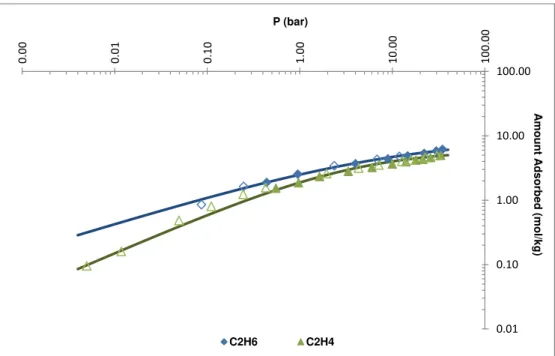
Figure 4.23 : Single-component adsorption isotherms for C2H6 and C2H4 at 303.15K. Symbols denote experimental data (filled symbols and open symbols denote adsorption and desorption data, respectively) and lines are the predictions from the Sips isotherm model. ... 61
Figure 4.24: Graph in log scale of the single-component adsorption isotherms for C2H6 and C2H4 at 303.15K. Symbols denote experimental data (filled symbols and open symbols denote adsorption and desorption data, respectively) and lines are the predictions from the Sips isotherm model. ... 62
Figure 4.25: Selectivity of CO2/N2 (blue line) and CO2/CH4 (green line) as a function of pressure at 303.15K. ... 63
Figure 4.26: Selectivity of C2H6/C2H4 as a function of pressure at 303.15K. ... 63
xx
Figure 4.28: Isosteric heats of adsorption for CO2 in MIL-53(Al), as a function of loading, determined from the temperature dependence of the Sips isotherm model. The symbols in
black represent the Qst independent of temperature. ... 65
Figure 4.29: Isosteric heats of adsorption for C2H6 in MIL-53(Al), as a function of loading, determined from the temperature dependence of the Sips isotherm model. The symbols in black represent the Qst independent of temperature. ... 65
Figure 4.30: Isosteric heats of adsorption for C2H4 in MIL-53(Al), as a function of loading, determined from the temperature dependence of the Sips isotherm model. The symbols in black represent the Qst independent of temperature. ... 66
Figure 4.31: Isosteric heats of adsorption for CO2 in zeolite 5A, as a function of loading, determined from the temperature dependence of the Sips isotherm model. The symbols in black represent the Qst independent of temperature. ... 66
Figure 4.32: Isosteric heats of adsorption for C2H4 in zeolite 5A, as a function of loading, determined from the temperature dependence of the Sips isotherm model. The symbols in black represent the Qst independent of temperature. ... 67
Figure 4.33: Single-component adsorption isotherms for the CH4, at 303.14K, 323.15K and 353.09K. Symbols denote experimental data and lines are the predictions from the D-A isotherm model. ... 72
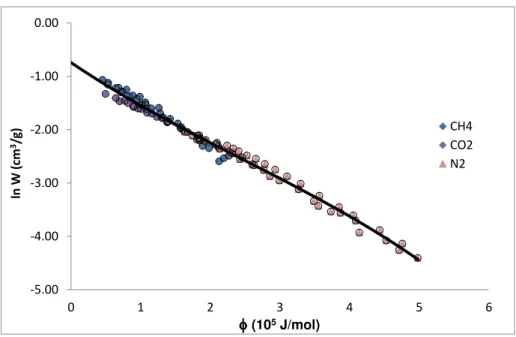
Figure 4.34: Characteristic curve obtained from collapsing the experimental data of CH4, CO2 and N2 in to a single curve. The solid line represents the fitting with the D-A isotherm model. . 72
Figure 4.35: Logarithmic representation of the characteristic curve obtained from collapsing the experimental data of CH4, CO2 and N2 in to a single curve. The solid line represents the fitting with the D-A isotherm model. ... 73
Figure A.1: Experimental Mercury intrusion-extrusion cycle for zeolite 5A. The curves give the volume of mercury (mL Hg/g of sample) penetrated at a given external pressure P into the measuring cell. The red curve (−+−+−) depicts the intrusion curve obtained; the green curve (−⊖−⊖−) shows the extrusion curve, obtained by reverting the process. ... 78
Figure A.2: Experimental Mercury intrusion-extrusion cycle for MIL-53(Al). The curves give the volume of mercury (mL Hg/g of sample) penetrated at a given external pressure P into the measuring cell. The red curve (−+−+−) depicts the intrusion curve obtained; the green curve (−⊖−⊖−) shows the extrusion curve, obtained by reverting the process [47]. ... 79
Figure A.3: Representative TGA analysis of zeolite 5A. ... 80
Figure A.4: Representative TGA analysis of MIL-53(Al) powder [47]. ... 80
Figure A.5: Adsorption Isotherm of N2 at 77K for zeolite 5A. ... 81
xxi
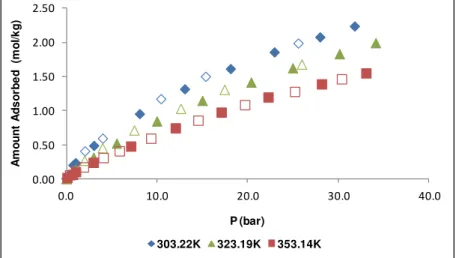
Figure C.1: Experimental single-component adsorption for N2 at 303.22K, 323.19K and 353.14K for MIL-53(Al). Filled symbols and open symbols denote adsorption and desorption data, respectively. ... 90
Figure C.2: Experimental single-component adsorption for N2 at 303.22K for MIL-53(Al). Filled symbols and open symbols denote adsorption and desorption data, respectively. ... 90
Figure C.3: Experimental single-component adsorption for N2 at 323.19K for MIL-53(Al). Filled symbols and open symbols denote adsorption and desorption data, respectively. ... 90
Figure C.4: Experimental single-component adsorption for N2 at 353.14K for MIL-53(Al). Filled symbols and open symbols denote adsorption and desorption data, respectively. ... 91
Figure C.5: Experimental single-component adsorption for CO2 at 303.16K, 323.18K and 353.37K for MIL-53(Al). Filled symbols and open symbols denote adsorption and desorption data, respectively. ... 92
Figure C.6: Experimental single-component adsorption for CO2 at 303.16K for MIL-53(Al). Filled symbols and open symbols denote adsorption and desorption data, respectively. ... 92
Figure C.7: Experimental single-component adsorption for CO2 at 323.18K for MIL-53(Al). Filled symbols and open symbols denote adsorption and desorption data, respectively. ... 92
Figure C.8: Experimental single-component adsorption for CO2 at 353.37K for MIL-53(Al). Filled symbols and open symbols denote adsorption and desorption data, respectively. ... 93
Figure C.9: Experimental single-component adsorption for C2H6 at 303.16K, 323.08K, 353.21K and 373.19K for MIL-53(Al). Filled symbols and open symbols denote adsorption and desorption data, respectively... 94
Figure C.10: Experimental single-component adsorption for C2H6 at 303.16K for MIL-53(Al). Filled symbols and open symbols denote adsorption and desorption data, respectively. ... 94
Figure C.11: Experimental single-component adsorption for C2H6 at 323.08K for MIL-53(Al). Filled symbols and open symbols denote adsorption and desorption data, respectively. ... 94
Figure C.12: Experimental single-component adsorption for C2H6 at 353.21K for MIL-53(Al). Filled symbols and open symbols denote adsorption and desorption data, respectively. ... 95
Figure C.13: Experimental single-component adsorption for C2H6 at 373.19K for MIL-53(Al). Filled symbols and open symbols denote adsorption and desorption data, respectively. ... 95
Figure C.14: Experimental single-component adsorption for C2H4 at 303.18K, 323.21K, 353.16K and 373.19K for MIL-53(Al). Filled symbols and open symbols denote adsorption and desorption data, respectively... 97
xxii
Figure C.16: Experimental single-component adsorption for C2H4 at 323.21K for MIL-53(Al). Filled symbols and open symbols denote adsorption and desorption data, respectively. ... 97
Figure C.17: Experimental single-component adsorption for C2H4 at 353.16K for MIL-53(Al). Filled symbols and open symbols denote adsorption and desorption data, respectively. ... 98
Figure C.18: Experimental single-component adsorption for C2H4 at 373.19K for MIL-53(Al). Filled symbols and open symbols denote adsorption and desorption data, respectively. ... 98
Figure C.19: Experimental single-component adsorption for C3H8 at 303.18K, 323.21K and 353.47K for MIL-53(Al). Filled symbols and open symbols denote adsorption and desorption data, respectively. ... 99
Figure C.20: Experimental single-component adsorption for C3H8 at 303.18K for MIL-53(Al). Filled symbols and open symbols denote adsorption and desorption data, respectively. ... 100
Figure C.21: Experimental single-component adsorption for C3H8 at 323.21K for MIL-53(Al). Filled symbols and open symbols denote adsorption and desorption data, respectively. ... 100
Figure C.22: Experimental single-component adsorption for C3H8 at 353.47K for MIL-53(Al). Filled symbols and open symbols denote adsorption and desorption data, respectively. ... 100
Figure C.23: Experimental single-component adsorption for C4H10 at 303.20K, 323.21K and 353.12K for MIL-53(Al). Filled symbols and open symbols denote adsorption and desorption data, respectively. ... 101
Figure C.24: Experimental single-component adsorption for C4H10 at 303.20K for MIL-53(Al). Filled symbols and open symbols denote adsorption and desorption data, respectively. ... 102
Figure C.25: Experimental single-component adsorption for C4H10 at 323.21K for MIL-53(Al). Filled symbols and open symbols denote adsorption and desorption data, respectively. ... 102
Figure C.26: Experimental single-component adsorption for C4H10 at 353.12K for MIL-53(Al). Filled symbols and open symbols denote adsorption and desorption data, respectively. ... 102
Figure C.27: Experimental single-component adsorption for CO2 at 303.16K, 323.18K and 353.37K for Zeolite 5A. Filled symbols and open symbols denote adsorption and desorption data, respectively. ... 103
Figure C.28: Experimental single-component adsorption for CO2 at 303.16K for zeolite 5A. Filled symbols and open symbols denote adsorption and desorption data, respectively. ... 104
Figure C.29: Experimental single-component adsorption for CO2 at 323.18K for zeolite 5A. Filled symbols and open symbols denote adsorption and desorption data, respectively. ... 104
Figure C.30: Experimental single-component adsorption for CO2 at 353.37K for zeolite 5A. Filled symbols and open symbols denote adsorption and desorption data, respectively. ... 104
xxiii
Figure C.32: Experimental single-component adsorption for C2H4 at 323.21K, 353.16K and 373.19K for Zeolite 5A. Filled symbols and open symbols denote adsorption and desorption data, respectively. ... 106
Figure C.33: Experimental single-component adsorption for C2H4 at 323.21K for zeolite 5A. Filled symbols and open symbols denote adsorption and desorption data, respectively. ... 107
Figure C.34: Experimental single-component adsorption for C2H4 at 353.16K for zeolite 5A. Filled symbols and open symbols denote adsorption and desorption data, respectively. ... 107
Figure C.35: Experimental single-component adsorption for C2H4 at 373.19K for zeolite 5A. Filled symbols and open symbols denote adsorption and desorption data, respectively. ... 107
Figure C.36: Experimental single-component adsorption for C3H8 at 303.18K, 323.21K and 353.47K for Zeolite 5A. Filled symbols and open symbols denote adsorption and desorption data, respectively. ... 108
Figure C.37: Experimental single-component adsorption for C3H8 at 303.18K for zeolite 5A. Filled symbols and open symbols denote adsorption and desorption data, respectively. ... 109
Figure C.38: Experimental single-component adsorption for C3H8 at 323.21K for zeolite 5A. Filled symbols and open symbols denote adsorption and desorption data, respectively. ... 109
Figure C.39: Experimental single-component adsorption for C3H8 at 353.47K for zeolite 5A. Filled symbols and open symbols denote adsorption and desorption data, respectively. ... 109
Figure D.1: Global fitting of the experimental N2 adsorption data in MIL-53(Al) by the Sips isotherm, using the software TableCurve 3D v.4.0. ... 110
Figure D.2: Global fitting of the experimental N2 adsorption data in MIL-53(Al) by the Toth isotherm, using the software TableCurve 3D v.4.0. ... 110
Figure D.3: Global fitting of the experimental CO2 adsorption data in MIL-53(Al) by the Sips isotherm, using the software TableCurve 3D v.4.0. ... 111
Figure D.4: Global fitting of the experimental CO2 adsorption data in MIL-53(Al) by the Toth isotherm, using the software TableCurve 3D v.4.0. ... 111
Figure D.5: Global fitting of the experimental C2H6 adsorption data in MIL-53(Al) by the Sips isotherm, using the software TableCurve 3D v.4.0. ... 111
Figure D.6: Global fitting of the experimental C2H6 adsorption data in MIL-53(Al) by the Toth isotherm, using the software TableCurve 3D v.4.0. ... 112
Figure D.7: Global fitting of the experimental C2H4 adsorption data in MIL-53(Al) by the Sips isotherm, using the software TableCurve 3D v.4.0 ... 112
xxiv
Figure D.9: Global fitting of the experimental CO2 adsorption data in zeolite 5A by the Sips isotherm, using the software TableCurve 3D v.4.0. ... 113
Figure D.10: Global fitting of the experimental CO2 adsorption data in zeolite 5A by the Toth isotherm, using the software TableCurve 3D v.4.0. ... 113
Figure D.11: Global fitting of the experimental C2H4 adsorption data in zeolite 5A by the Sips isotherm, using the software TableCurve 3D v.4.0. ... 114
Figure D.12: Global fitting of the experimental C2H4 adsorption data in zeolite 5A by the Toth isotherm, using the software TableCurve 3D v.4.0. ... 114
Figure D.13: Isosteric heats of adsorption for N2 in MIL-53(Al), as a function of loading, determined from the temperature dependence of the Toth isotherm model. ... 115
Figure D.14: Isosteric heats of adsorption for CO2 in MIL-53(Al), as a function of loading, determined from the temperature dependence of the Toth isotherm model. ... 115
Figure D.15: Isosteric heats of adsorption for C2H6 in MIL-53(Al), as a function of loading, determined from the temperature dependence of the Toth isotherm model. ... 116
Figure D.16: Isosteric heats of adsorption for C2H4 in MIL-53(Al), as a function of loading, determined from the temperature dependence of the Toth isotherm model. ... 116
Figure D.17: Isosteric heats of adsorption for CO2 in zeolite 5A, as a function of loading, determined from the temperature dependence of the Toth isotherm model. ... 117
xxv
List of Tables
Table 2.1: Distinction between Physisorption and Chemisorption. Adapted from [11, 13]. ... 6
Table 3.1: Main characteristics of the MIL-53(Al) and zeolite 5A samples used in this work. ... 23
Table 4.1: Results of blank calibration of the sample holders used in the adsorption measurements. ... 40
Table 4.2: Results of adsorption equilibrium measurements of the He. Cell 1, contains the sample of zeolite 5A, and Cell 2 the sample of MIL-53 (Al). ... 41
Table 4.3 : Parameters obtained from the data fitting with the Sips and Toth models for the MIL-53(Al). ... 50
Table 4.4 : Parameters obtained from the data fitting with the Sips and Toth models for the zeolite 5A. ... 55
Table 4.5: Affinity coefficients, β, for CH4, CO2 and N2 on MIL-53(Al) employed in this study. . 71
Table 4.6: Parameters obtained in the fitting of the experimental data. ... 73
Table B.1: Characteristic of the several pressure transducers used in this work. ... 85
Table C.1: The experimental data obtained from the referential blank calibration of the cell (without sample). Experiment performed at 293.78K using as gas, helium (He). ... 87
Table C.2: Experimental data obtained from measurements of equilibrium adsorption of helium (He) at 353.29K. Cell 1, containing the sample of zeolite 5A and the cell 2, containing the sample of MIL-53(Al). ... 88
Table C.3: Isotherm data of nitrogen (N2) on sample of MIL-53(Al). ... 89
Table C.4: Isotherm data of carbon dioxide (CO2) on sample of MIL-53(Al). ... 91
Table C.5: Isotherm data of ethane (C2H6) on sample of MIL-53(Al). ... 93
Figure C.6: Isotherm data of ethylene (C2H4) on sample of MIL-53(Al). ... 96
Table C.7: Isotherm data of propane (C3H8) on sample of MIL-53(Al). ... 99
Table C.8: Isotherm data of butane (C4H10) on sample of MIL-53(Al). ... 101
Table C.9: Isotherm data of carbon dioxide (CO2) on sample of zeolite 5A. ... 103
Table C.10: Isotherm data of ethane (C2H6) on sample of zeolite 5A. ... 105
Table C.11: Isotherm data of ethylene (C2H4) on sample of zeolite 5A. ... 106
xxvii
List of Symbols
𝐴, 𝐵, 𝐶 𝑒 𝐷
–
Adsorbate specific constants
ARE%
- Average relative error
𝑏
- Affinity constant (bar-1)𝑏
0 - Affinity constant at a reference temperature, 𝑇0 (bar-1)𝑐
1, 𝑐
2, 𝑐
3-
Constants characteristic of the adsorbent𝐷
𝑝̅̅̅̅
- Average pore diameter of the adsorbents(𝜇𝑚)
𝑓 - Fugacity (bar)
𝑓
𝑠 - Saturated Fugacity (bar)𝑚
- Weight read from the balance at any time (g)𝑚
ℎ - Mass of the sample holder (g)𝑚
𝑠 - Mass of the sample adsorbent (g)𝑛
- Parameter of the Sips isotherm model𝑛
0 - Parameter of the Sips isotherm model at the reference temperature,𝑇
0𝑛′
-
Parameter related to the characteristic energy for the pore size distribution𝑁
𝑒𝑥𝑝 - Number of data points𝑃
- Pressure (bar)𝑃
𝑐-
Critical pressure (bar)𝑃
𝑠 - Saturated vapor pressure (bar)𝑞
𝑒𝑥- Specific excess adsorbed (mol/kg)𝑞
𝑒𝑥𝑝-
Experimental values of amount adsorbed (mol/kg)𝑞
𝑖 - Adsorbed quantity of the more adsorbed specie (mol/kg)𝑞
𝑗 - Adsorbed quantity of the less adsorbed specie (mol/kg)𝑞
𝑚𝑜𝑑-
Predicted values by the model of amount adsorbed (mol/kg)xxviii
𝑞
𝑡 - Total amount adsorbed (mol/kg)𝑞
𝑡𝑠 - Maximum amount adsorbed (mol/kg)𝑄
- Heat of adsorption (kJ/mol)𝑄
𝑠𝑡 - Isosteric heat of adsorption (kJ/mol)𝑅
𝑔 - Ideal gas constant (J/mol.K)𝑡 - Parameter of the Toth isotherm model
𝑡
0 - Parameter of the Toth isotherm model at the reference temperature,𝑇
0𝑇 - Temperature (K)
𝑇
0-
Reference temperature (K)𝑇
𝑏-
Temperature of the liquid adsorbate at normal boiling point (K)𝑇
𝑐-
Critical temperature (K)𝑉
𝑏-
Molar volume of the liquid adsorbate at normal boiling point (cm3/mol)𝑉
𝑐-
Critical volume (cm3/mol)𝑉
ℎ - Volume of all moving parts present in the measuring cell (cm3/g)𝑉
𝑚 - Molar volume of the adsorbed phase (cm3/mol)𝑉
𝑝 - Accessible pore volume of the adsorbent (cm3/g)𝑉
𝑆 - Specific volume impenetrable to the adsorbate (cm3/g)𝑊 - Volume of the adsorbed phase (cm3/g)
𝑊
𝑆-
Specific micropore volume of the sample (cm3/g)xxix
Greek Letters
𝛼
- Constant parameter of the Sips/Toth isotherm model𝛼
𝑖/𝑗 - Selectivity𝛽
-
Affinity coefficientγ
-
Parameter related to the characteristic energy for the system𝜃
- Fractional loading𝜌
𝑎 - Density of the adsorbed phase (g/m3)𝜌
𝑔 - Density of the bulk (g/m3)𝜌
ℎ - Density of the sample holder (g/m3)𝜌
𝑠 - Density of the sample adsorbent (g/m3)𝜙
-
Adsorption Potential (J/mol)1
Chapter I
1. Introduction
1.1. Motivation
Energy and its sources have been playing a fundamental role in the activities of mankind, such that energy consumption has experienced an explosive growth. In order to respond to this huge demand, it is necessary to find resources for energy production. An obvious choice rests on fossil fuels as a primary resource, since their cost are not high, are available in large quantities and have a high calorific value [1, 2].
Fossil fuels ensure about 75% of the energy produced worldwide, and as such there is a need to find other alternatives, since they are a non-renewable source and their burning is responsible for the harmful release of various gases to the atmosphere. The emission of gases such as carbon dioxide (CO2) and methane (CH4) among others represents a problem for environmental protection, since they are both gases with greenhouse effects [1, 3].
The environmental effects of carbon dioxide (CO2) are of significant interest. The increased concentration of CO2 in the atmosphere has contributed to the aggravation of the rate of global warming thus making this gas, the main culprit in anthropogenic climate change. As such, the capture and storage of CO2 continue to be topics of great research [4]. On the other hand, methane (CH4), a gas of powerful greenhouse effect and probably the most abundant organic compound on Earth, has attracted some interest as it is the main component of natural gas. Similarly, other hydrocarbons such as ethane (C2H6), propane (C3H8), butane (C4H10), ethylene (C2H4) and propylene (C3H6) are also sources of energy for civilizations. Given their environmental concerns, research in the area of better and sustainable use of hydrocarbon processing has been held.
2
quarter of the energy needed to population worldwide. Besides being an effective alternative to fossil fuels, burning natural gas produces less carbon dioxide (CO2) and more water vapor per unit of energy, relatively to the burning of other fuels, thus demonstrating to have a better performance to the environment. Natural gas mainly consists of methane (CH4) 80-95 mol%, the remainder being small amounts of carbon dioxide (CO2), nitrogen (N2) and higher molecular weight hydrocarbons such as ethane (C2H6), propane (C3H8) and butane (C4H10). In order to respect the quality of natural gas, this should not exceed the amount of 2% and 4% (v/v) in carbon dioxide (CO2) and nitrogen (N2), respectively. However, there are some sources where contamination of carbon dioxide (CO2) is greater than 10%, which means that there is a need to reduce carbon dioxide (CO2) in excess in order to obtain a gas with suitable properties [5, 6].
Additionally, biogas is also an alternative energy source which is renewable. It is typically produced by fermentation or anaerobic digestion of organic matter under anaerobic conditions and it is composed mainly of methane (CH4) and carbon dioxide (CO2). Moreover, if biogas is sufficiently "clean" it has the same characteristics as natural gas [6, 7].
The separation and purification of gas mixtures are processes increasingly used industrially. The main applications of these processes are connected to the purification of raw materials, purification and recovery of primary products, and the removal of polluting gaseous effluents. There are several methods for the separation of gases, but in recent years adsorption has been presenting a considerable growth, because it has the ability to separate gas mixtures with optimum efficiency. This major operation unit in chemical engineering is currently a growing area of research with the development of new low-carbon processes.
Adsorption has revealed to be a great alternative for capture and storage of CO2 from combustion gas streams, increasing the target of analysis concerning the options available to reduce gas emissions with impact on global climate change. Simultaneously, the materials field of research has evolved such that there are now several solids that have been synthetized and studied as potential adsorbents of carbon dioxide (CO2), from activated carbons, to zeolites, and especially metal-organic frameworks (MOF's), in order to evaluate its effectiveness in adsorption processes. It is therefore important to perform an exhaustive characterization of these adsorbents in terms of CO2 balance, along with the study of other relevant parameters, such as adsorption-desorption kinetics, stability, regeneration, etc [8].
3
biogas must be upgraded to bio-methane which, can be injected in the natural gas grid, for domestic consumption or be directly used as vehicle fuel [7, 6, 12]. Adsorption processes can only be employed in biogas upgrading if the adsorption equilibrium of CO2 and CH4 on the adsorbent material is known.
Olefins such as ethylene (C2H4) and propylene (C3H6) have proved possess high economic value because they are commonly used in polymer production and other applications [13]. They are typically used in oil refineries, a large number of physical and chemical processes for converting oil into gasoline, fuel oil and hundreds of other commercial products. The catalytic cracking is a process used to increase gasoline production from oil. The purge of this process contain large amounts of olefins that should be recovered. One of the most popular and used methods for the separation of olefins from their respective paraffins is the traditional distillation. However this process is extremely difficult and has high energy costs. Adsorption-based processes have been explored as an alternative to distillation processes. One mixture of interest is propane (C3H8) / propylene (C3H6) has been the subject of extensive study, since it is a relevant separation in the petrochemical industry [14].
Likewise, the search for a suitable adsorbent is crucial for the success of any adsorption process, and thus its field of reseach has been the subject of extensive research [15].
4
1.2.
Structure of the Thesis
The structure of this thesis comprise with the following content:
Chapter 1: Introduction
Chapter 2: Background
This chapter discusses the theory and experimental methods related to the adsorption phenomenon and analyze the latest developments that have been made in this research field. A brief approach is done concerning the gases studied in this work, i.e. the series of light alkanes and alkenes, carbon dioxide and nitrogen. Moreover, a short reference to the chosen adsorbent materials, zeolites and metal-organic frameworks (MOF’s) is also made.
Chapter 3: Experimental Work on Adsorption
In this chapter it is possible to find all the experimental work. It encloses the characterization of the adsorbent materials used, a brief reference to the method used in the experimental determination of the adsorption isotherms, as well as the description of the entire gravimetric unit used for the purpose of this work. Lastly, the complete experimental methodology employed is included in this chapter.
Chapter 4: Experimental Results and Data Analysis
This chapter presents the experimental results obtained in this work, along with their data analysis. In order to obtain broader models to describe the adsorption isotherms, global data fittings were performed by using the Toth and Sips model equations. A second approach adopted was the potential theory of adsorption that has proved to be quite interesting. Very little information using this theory is available in open literature, especially for the selected adsorbents. An error determination accompanied the experimental analysis.
Chapter 5: Conclusions and Future Work
5
Chapter II
2. Background
This chapter provides an introduction to the adsorption phenomena, its importance and principles, thus proving some developments that have been made in this area.
2.1. Adsorption Phenomena
The Adsorption Phenomenon has been recognized by humanity throughout the ages, and is increasingly used in performing separations and purifications.
Adsorption occurs whenever a porous solid surface (adsorbent) is exposed to a gas or a liquid (adsorbate). This exothermic phenomenon is defined as enrichment of the material or increase in the density of the fluid in the vicinity of an interface. Therefore, the porous solid surface is considered as the "heart of adsorption", providing a very high surface area or high micropore volume, and consequently a high adsorptive capacity [16]. The inverse endothermic process is called desorption where the molecules adsorbed at the solid surface of the adsorbent are released [17].
The adsorption occurs due to the effect of the various types of linkages between the adsorbate-adsorbent pair: van der Waals interactions, covalent bonding, acid-base, hydrogen bonding, among others. The strength of binding is extremely important, because if the interactions are fairly weak, small adsorbate amounts are adsorbed; if the interactions are strong, the regeneration of the adsorbent will be difficult to achieve [18].
6
Physisorption occurs when adsorption interaction forces between molecules are weak, with links based on intermolecular forces of van der Waals and/or electrostatic interactions. The heat of adsorption is relatively low compared to chemical adsorption, and presents a reversible character. This adsorption is invariably exothermic, a fact which can be verified by studying their thermodynamics [19, 20].
Chemisorption occurs when the adsorption process takes place through chemical interactions between the molecules of the adsorbent and adsorbate at the surface of the solid. In this case, the bond strengths are mainly of covalent nature or ionic, restricted at the first surface layer of the adsorbent [19, 20]. This type of adsorption is usually irreversible with a much higher adsorption heat than in the case of physisorption.
Table (2.1) shows the main differences between the physisorption and chemisorption.
Table 2.1: Distinction between Physisorption and Chemisorption. Adapted from [11, 13].
Physisorption Chemisorption
Low heat of adsorption order of enthalpy reaction Heat of adsorption on the
Mono or multilayer Only monolayers
Adsorbed molecules do not suffer dissociation
Can occur dissociation of molecules
Occurs at low temperatures Occurs at high temperatures
Reversible May be irreversible
Low degree of specificity High degree of specificity
The adsorption process at an industrial level is extremely important, as such, some adsorbents are already used on a large scale as desiccants, catalysts or catalyst supports and others are used for the separation, purification and/or storage of gases, pollution control, among others. In addition, this process plays a vital role in biological mechanisms. Adsorption-based separation processes have been the subject of considerable research for CO2 capture
from flue gases, capture and recovery of VOC’s, air drying, biogas upgrading, hydrogen
purification, and removal of light hydrocarbons from various gas streams [12, 21, 22, 23, 24, 25].
7
determining the surface area and pore size distribution of a diverse range of porous materials. Such materials (adsorbents) will be extremely important in any adsorption process.
The older types of known industrial adsorbents are activated carbon and silica gel, but there is a great interest in developing new materials having pores of well-defined shape and size, as are the cases of metal-organic structures that have recently presented an increasing applicability as adsorbents [26, 27, 5, 28, 29].
2.2. Adsorption Equilibria
With the advancement of research conducted in the field of adsorption became necessary to quantify the amount adsorbed, retained by the adsorbent, which was named by adsorption capacity. The adsorption capacity depends then on the temperature and the pressure or the concentration, in the case of the adsorbate in question being a gas or a liquid, respectively.
The amount adsorbed retained by the adsorbent after reaching the equilibrium is named adsorption capacity. The adsorption capacity of the solid depends both on the temperature and the pressure or the concentration, being the adsorbate in question a gas or a liquid.
For the study of the adsorption equilibria and adsorption capacity of an adsorbent, it is normally considered one of the three constant variables, that is, the adsorption data is considered as isosteres if the amount adsorbed is constant; isobars for constant pressure values, or isothermal if the temperature is kept constant.
Adsorption isotherms are the most frequently used procedure in data collection and, depending on the properties of the adsorbate and the adsorbent in question, they may acquire different shapes [2]. Adsorption isotherms are then used to compare the adsorption capacity of the adsorbents for specific substances. In literature there are numerous records of experimental isotherms data, measured in several solid-gas systems, with a wide variety of forms. The shape of the adsorption isotherms present inflections, and therefore concave and convex configurations may be obtained [30]. Most of these isotherms, resulting in physical adsorption, may be conveniently grouped into six distinct categories according to the IUPAC classification. Originally the first five types (I to V) of isotherms were proposed by Brunauer and his colleagues in 1940 [26].
8
Figure 2.1: The six types of adsorption isotherms, as classified by IUPAC [26]. Specific amount
adsorbed versus relative pressure P/P0, where P0 is the saturation vapor pressure.
The isotherms of the type I are reversible and have a concave shape in relation to the axis of relative pressure, since the specific amount adsorbed increases significantly at low pressures, ultimately reaching a plateau. Such isotherms are normally given for microporous solids and a pore size not much larger than the adsorbate molecules [26, 31].
As for the type II, these isotherms are also reversible and they are obtained with non-porous or macronon-porous adsorbents, then having a monolayer formation followed by adsorption of multiple layers [26, 31].
Type III isotherms show a convex shape along the whole axis relative pressure. These isotherms are reversible, but are not very common the systems that have this type of curvature. In such cases, the adsorbent-adsorbate interactions play a very important role [26, 31].
The type IV isotherms whose initial region is closely related to type II isotherm, tend to stabilize at high relative pressures. It has a characteristic appearance, the hysteresis loops, which are associated with capillary condensation that occurs in the mesopores. The lower branch represents the measurements obtained by progressive addition of adsorbate, and the upper branch of the phasing. Such isotherms are common and are provided by various industrial mesoporous adsorbents, but the exact shape of the hysteresis loop varies from system to system [26, 31].
9
V isotherms exhibit a hysteresis loop which is related with the mechanism for filling and emptying the pores [26, 31].
Finally, the VI type of adsorption isotherms, also commonly known as isothermal steps is also relatively rare and in which the sharpness of steps depends on the system and temperature. This shows the various steps that occur in multiple layers of adsorption on uniform surfaces and non-porous. The height of each step is related to the ability of each layer [26, 31].
This classification is a simplification, since many experimental isotherms have a composite nature, and some are more complex than expected. It is obvious that this kind of classification is only applicable for the adsorption of a single component. Such experimental measurements are extremely useful to characterize porous materials [26].
The theoretical modeling of adsorption isotherms is extremely important for the practical processes of scale-up of adsorption.
2.2.1. Adsorption Hysteresis
Although the adsorbed amount gives an idea of the pore form, another way of evaluate the behavior of the pore is to investigate the shape of the hysteresis loop when present [16].
The terms of adsorption and desorption are commonly used to indicate the direction by which the equilibrium states were discussed. The adsorption hysteresis occurs when the amount adsorbed is not brought to the same level by the adsorption and desorption at a given pressure balance [26]. The hysteresis is a phenomenon which arises essentially in the area of multilayer physical adsorption isotherms, is usually associated with mesoporous structures and can exhibit a variety of shapes [31].
Although the effect of various factors on adsorption hysteresis are not yet fully understood and remain the subject of considerable study, there is a classification made by the IUPAC which that classifies 4 types of hysteresis designated of H1 - H4 [31, 32].
10
Figure 2.2: The four types of adsorption hysteresis as classified by IUPAC [31]. Amount adsorbed
versus relative pressure P/P0, where P0 is the saturation vapor pressure.
As it can be seen in Figure (2.2), there are two kinds of extremes, H1 and H4. In the first case, H1, the branch of the adsorption and desorption are almost vertical and parallel along a range of appreciable gas adsorption. In the case of H4 it appears that the two branches are almost horizontal and parallel along the axis of relative pressure. The types of hysteresis H2 and H3 are then considered intermediate between these two extremes [31].
11
2.3. Experimental Methods for Measuring the Adsorption
Isotherms
The measurements of gas adsorption are not difficult to perform, as long as they are carried out carefully, with the appropriate equipment and process design. Additionally, prior to any measurements of adsorption equilibria several considerations should be accounted for:
a) What is the purpose of the work?
b) What are the operating conditions?
c) What is the desired data accuracy?
Obviously, the selection of the methodology and experimental conditions always depend on the purpose it is intended, being still necessary always ensure a controlled and well-defined measurement procedure [26].
Gas adsorption equilibrium can be measured by several different methods. In this section the more classical methods are addressed, namely the gravimetric and volumetric/manometric ones. A brief reference to the calorimetric method is made.
Both gravimetric and volumetric/manometric techniques have the same objective, that is, to measure the amount of gas adsorbed on an adsorbent surface as a function of the pressure of the gas, thus obtaining an adsorption isotherm after reaching the equilibrium at each point of the curve. These techniques have their advantages and disadvantages, so it is important to have the knowledge about both of them, especially to decide which method use [32]. The major distinctions between these two methods are:
a) Cost.
Normally the gravimetric method is more expensive than the volumetric one. Although both methods require an accurate pressure reading, the gravimetric equipment usually entailed higher investment costs.
b) Capacity.
12
2.3.1. The Gravimetric Method
The gravimetric method is a method that has great potential in research on phenomena of gas adsorption in porous solids. The main characteristic of the gravimetric method is its ability to measure small changes regarding the weight of an adsorbent sample. The most accurate and reliable measurement of adsorption isotherms can be carried out by weighing the mass of adsorbent which is in contact with the adsorbate using a very sensitive microbalance; preferably a magnetic suspension balance (MSB).
The principle of the gravimetric method is simpler than the volumetric method. Typically, physical adsorption isotherms are represented by the adsorbed amount depending on the pressure.
The gravimetric adsorption measurements have shown to have a great use, from characterizing porous means, measuring gas adsorption equilibriums to investigating the adsorption kinetics [17]. Finally, is relevant to give some attention to the advantages and disadvantages of this method of measurement of adsorption equilibrium.
The main advantage of the gravimetric method is undoubtedly its high precision and accuracy, made possible by the commercially available microbalances. The amount of adsorbent material is also a positive aspect, since smaller amounts can be used when are only available small quantities of newly developed material; or a considerable solid quantity can be employed allowing results with a higher reproducibility. Unlike the volumetric/manometric method, extremes of pressure (too high or too low pressures) do not represent a problem in gravimetric adsorption measurements, since in these measurements the adsorbed mass is determined by its weight. Another advantage is that using this type of isothermal measurements, it is possible to determine the kinetics of the process.
13
2.3.2. The Volumetric Method
The oldest method and still widely used to measure adsorption equilibrium is the volumetric (or manometric) method. This is based on measuring the pressure of a gas in a calibrated volume, at a constant volume and at a known temperature. Typically, physical adsorption isotherms are presented as volume of gas adsorbed depending on the relative pressure.
Today it is known that it is inappropriate to use the term volumetric since the amount adsorbed is measured by the change in gas pressure, rather than volume [26, 17]. It is important then to discuss some of the advantages and disadvantages of this method.
One of the great advantages as mentioned above is that the volumetric method is much less expensive; the only associated cost is related with the pressure transducers investment, which depends on the accuracy required. Their simplicity is another positive side, since this technique does not require sophisticated equipment, and furthermore the experiment itself is simple and can even be automated.
On the other hand, the main drawback of this technique is that it is not very suitable for research, especially for low pressure ranges. Another negative aspect of this process is also the amount of adsorbent material; if only a few milligrams of adsorbent is available, the gravimetric method is strongly recommended due to the cumulative errors present on the volumetric adsorption measurements. Another disadvantage of this technique is that it does not provide information on the kinetics of the adsorption process [17, 32].
2.3.3. The Calorimetric Method
Calorimetric measurements are less common when compared to the techniques listed above. In fact, to be effective this method must be combined with a volumetric or gravimetric technique.
14
2.4. Adsorbent Materials
In an adsorption process, the adsorbate molecules aggregate onto the surface of the adsorbent and/or in the pores of it. The adsorbent is normally porous in nature with a high surface area capable of adsorbing a particular fluid, which can be liquid or gaseous. Therefore, the adsorbent material plays an important role in adsorption, since the effectiveness of both kinetics and equilibrium of adsorption is directly determined by the quality of the solid. Note however that this fact then generates a dilemma, since an adsorbent with a high capacity, but with slow kinetics is not a good choice, because the time that the adsorbate molecules take to reach the interior of the adsorbent is too long. On the other hand, adsorbents with a low capacity and rapid kinetics are also not a good choice, because a large amount of solid is needed to perform the adsorption process. Hence, a good adsorbent is the one that provides a good kinetics and has a good adsorption capacity, but simultaneously is easily regenerated. In order to meet these two requirements, it is necessary to take into account two aspects [16]:
a) The solid must have a relatively high surface area or a considerable microporous volume;
b) The solid must have a sufficiently large pore network so as to achieve transport of the adsorbate molecules to his inside.
In order to satisfy the requirements described above, a good adsorbent should arise from a combination of two characteristics: i) a small size pore; and ii) a reasonable porosity [16]. In this context, it is convenient to classify the pores according to their sizes. The classification recommended by IUPAC to delineate the pore size was developed based on nitrogen adsorption at 77K for a wide range of porous solids, giving then the following distribution:
a) Widths of exceeding 50nm pores are called macropores;
b) Pores with widths between 2nm and 50nm are called mesopores; c) Widths of pores with less than 2nm, are designated micropores.
There is then a concern about the study of the limits of the pores, since the mechanisms of filling of these pores are dependent on their shape, the properties of the adsorbent and the interactions between the adsorbent and the adsorbate [31].
15
The present work employed zeolite 5A and the metal-organic framework (MOF) MIL-53(Al) as adsorbents; the former is a common solid whereas the latter one is a newly developed porous material. Due to their high porosity, high adsorption capacity, and thermal
stability, the MOF’s materials have shown great potential for applications in gas storage, gas
separation, catalysis, and allied fields [34, 35, 36, 37, 38, 39].
2.4.1. 5A Zeolite
A class of porous solids, as widely used as the activated carbons, are zeolites. These materials can be natural or have a synthetic origin, although the latter source is preferred. There are many types of synthetic zeolites such as type A, X, Y, ZSM among others.
Although zeolites have been known for over 200 years, its recognition as a highly selective adsorbent was held just 50 years ago. Since then several hundred of new porous zeolites have been synthesized. This class of adsorbents can be considered as one of the most important and well established class of microporous adsorbents, wherein the porosity is intra-crystalline [16]. It is unquestionable, the importance that zeolites have shown in the development of adsorption technology. Three major areas of application of this material are:
a) Removal of trace impurities, or diluted from a gas; b) Bulk separation of gas mixtures;
c) Gas analysis
Category I refers to the traditional use of zeolitic adsorbents, are examples of this drying gas, desulfurization and removal of corrosive and toxic organic compounds through a contaminated gas. There are several industrial gases containing various kinds of impurities that are treated by adsorption in zeolites. It is due to this application that zeolites are commonly known as "molecular sieves".
Category II is the latest application in development for this type of adsorbent. The trend is then to separate gas mixtures, recovering and increasing the degree of purity of them so that they can be reused.
Finally, the most important example in category III, is gas chromatography, which is widely used as an analytical tool in research and process control [15, 40].
16
disadvantage, since it implies costs by the need to be performed at very high temperatures [8, 41].
Once known some general characteristics of the various types of zeolites, it is convenient to devote some attention to one of the materials used in this work, namely the zeolite 5A.
The basic unit of a zeolite structure is TO4 tetrahedron, where T is typically silicon or aluminium (or a phosphorus on aluminophosphate). In the case of type A zeolites, the typical composition of the unit cell is [Na12 {Al12Si12O48}.27H2O]8 and the ratio of Si:Al, always close to 1.0. There are several variants of type A zeolites (3A, 4A, 5A), these arise when the cation Na+ is exchanged for cations K+, Ca2+ or Mg2+, causing a significant effect on the adsorptive properties of the zeolite A. In Figure (2.3), it is possible to see the typical structure of a zeolite of type A, as well as a sample of zeolite used in this experimental work.
In the case of zeolite 5A, this occurs when the Na+ cations are exchanged for Ca2+, whereas the number of cations required is further reduced, thus leading to an increase of porous volume. It is then possible to conclude that the 5A zeolite is crystalline and highly porous, having a network of internal pores with approximately
4.3𝐸
−04𝜇𝑚
in size and with molecules dimensions relatively small [26, 42].Figure 2.3: Typical Structure of zeolite type A (left) and image of the sample of zeolite 5A, used in the
![Figure 3.1: Gravimetric measurements in controlled environments. Comparison of conventional instrument (left) and magnetic suspension balance (right) [58]](https://thumb-eu.123doks.com/thumbv2/123dok_br/16476231.732039/57.892.156.735.106.482/gravimetric-measurements-controlled-environments-comparison-conventional-instrument-suspension.webp)
![Figure 3.3: Simultaneous measurement of adsorption and density. Comparison of Zero Point (ZP), Measuring Point 1 (MP1) and Measuring Point 2 (MP2) positions [58]](https://thumb-eu.123doks.com/thumbv2/123dok_br/16476231.732039/59.892.207.685.667.1037/figure-simultaneous-measurement-adsorption-comparison-measuring-measuring-positions.webp)