*e-mail: [email protected]
Photo-Induced Dipole Relaxation Current in Natural Amethyst
Fabricio Trombini Russoa,b, Rosa Maria Fernandes Scalvib,
Luis Vicente de Andrade Scalvib,c*, Marcus Vinicius Gonçalves Vismaraa,c
aGraduate Program in Materials Science and Technology – POSMAT, Faculdade de Ciências – FC,
State University of São Paulo – UNESP, CEP 17033-360, Bauru, SP, Brazil
bDefects in Semiconductors and Dielectrics Group, Physics Department, Faculdade de Ciências – FC,
State University of São Paulo – UNESP, CEP 17033-360, Bauru, SP, Brazil
cAdvanced Materials Group, State University of São Paulo – UNESP, CEP 17033-360, Bauru, SP, Brazil
Received: Ouctober 14, 2011; Revised: April 06, 2012
Thermally stimulated depolarization current (TSDC) measurements were carried out for SiO2 in the amethyst form, aiming to investigate the relationship of observed current with relaxation phenomena related to quartz impurities. In addition to TSDC conventional dark procedure, photo-induced TSDC was also carried out, where the exciting light came from an Ar+ laser, tuned either at 488 nm or at 541 nm. X-ray diffraction and optical absorption measurements were used as complement for the interpretation of TSDC data. Optical absorption data, mainly in the range 400-700 nm, allow identifying the characteristic bands of amethyst as well as to relate them with TSDC and photo-induced TSDC data, leading to a relationship between absorption bands and light irradiation with selected wavelengths. These results allow determining how the formation of a TSDC band in the range 220-260 K, is affected by the light absorption, modifying the formation and the dipole orientation distribution in the samples. Results also help the verification of defects formed by Fe3+ or Fe4+ ions in the amethyst structure, as well as suggest that these defects, besides the participation in the amethyst structure as color centers, also play a role in the formation of TSDC bands, contributing for the observed effect of monochromatic light irradiation on these bands.
Keywords: relaxation current, amethyst, dipoles, TSDC
1. Introduction
Raw quartz is one of the main sources of materials for microelectronic and other high technology industries such as advanced glasses plants and optical fibers units, besides piezoelectric devices used in telecommunications1-4. Due to its large variety and geological origin, Brazilian quartz causes great scientific interest. Since the Second World War, Brazil has become one of the greatest suppliers of this raw material. The violet coloration of Amethyst is one of the most appreciated and prized of quartz. There are reports on Amethyst use since the birth of civilization, where this mineral comes from Egypt, Southeast Asia, and West Europe3. Although it presents a high economical relevance, there is little scientific background on the natural reserves5, and, thus, this material represents a great potential to be explored.
The impurity incorporation is directly related to the mechanism of growth and geological formation of the natural crystal and, its utilization as precursor of quartz-based technological devices is strongly dependent on the existent defects. Developing knowledge on the nature and properties of impurity defects in quartz is a great help towards the applicability of the raw stone6.
The main goal of this work is to apply the thermally stimulated depolarization current (TSDC) technique on Amethyst samples, in order to understand the rules of formation and charge of defects on the material properties. This technique has been widely used to investigation of dipole-like defects in several types of materials, such as ionic solids (Alkali halides films and bulk, for instance KCl doped with metallic impurities), polymers, oxides and semiconductors7-10. The basic principle of this technique is the polarization of dipole-like defects, whose directions are originally randomly distributed throughout the material, which are frozen down by temperature lowering, followed by the removal of the applied bias, which leads to a recorded electric current. In this communication, along with this technique, a photo-induced TSDC is also applied, in order to understand the dipole formation in Amethyst. X-rays diffractograms and optical absorption spectra are also presented, helping the interpretation of TSDC data.
2. Experimental
X-ray diffraction (XRD) data for amethyst samples were obtained with a RIGAKU diffractometer, model D/MAX-2100/PC, using CuKα radiation (1.5406 Å) and a Ni filter for elimination of Kβ radiation. It was used the X-ray powder diffraction technique and the scanning rate was 1°/min in the range 20° to 80°.
Optical absorption spectra were obtained in the range 200 to 900 nm, through a Varian spectrophotometer model 1 G.
For thermally stimulated depolarization current (TSDC) and photo-induced TSDC it was used a Janis cryostat coupled with a liquid nitrogen reservoir for cooling and a resistive element for heating. The perfect balance between these thermal actions, assured by a Lake Shore controller, allows a perfect control in the linear heating rate. The pressure for application of bias is lower than 10–6 torr, which was obtained with the help of a turbomolecular pump (Edwards). The sample polarization was done with a High Voltage Supply Keithley, model 248. The practical relationship: Vp = 1.38 × 10⁴ × e gives the adequate voltage to be applied, where Vp is the applied voltage, and e is the thickness (cm) of the sample, in the bias direction. For the sample thickness used in this work, it yields about 1500 V, which was the actual value applied in most of our experiments. The electric field generated from the application of this voltage was also evaluated, considering the sample dimensions.
Usually the voltage is applied for 5 to 10 minutes, which was done at a previously determined temperature, before finishing the sample cooling down process. The used heating rate for TSDC measurements was 5 K/min. For photo-induced TSDC, it was used a Ar+ laser of Spectra Physics, model 2017, which was tuned at 488 nm or 541 nm, depending on the measurement, and laser power was varied from 250 mW to 610 mW. Appropriate lenses and mirrors were used to direct the laser beam to the sample.
3. Results and Discussion
Figure 1 shows X-ray diffractogram for an Amethyst sample previous and after a thermal annealing (T.A.) at 1000 °C, for 30 minutes. For the thermally treated sample, the heating rate was 10 °C/min and the cooling down follows the natural exponential law. The labeled peaks refer to alpha quartz, according to file PDF 89-8934 of the ICDD/JCPDS11. The thermal annealing did not lead to peak shift, but to a slight intensity variation. Besides, the relative intensity of some peaks are varied, for instance the peak concerning the (110) direction increases, whereas the peak related to (112) direction decreases. It may be interpreted as a material texture variation. No other material structure was detected by the X-ray diffractogram, such as iron clusters, which means that this ion is dispersed in the Amethyst crystalline structure and, as widely known, is responsible for some of its properties.
Figure 2 shows optical absorption spectra of natural Amethyst samples in the form of a small uncut stone and also in the form o small plates, with thicknesses labeled in Figure 2. No thermal annealing was carried out for these samples. It is possible to distinguish absorption bands about 220, 355 and 550 nm. In the inset of Figure 2, the
range 400 to 700 nm is shown, in order to highlight the band around 550 nm (green-yellow). For the analyzed samples, it is easily seen that the absorption is directly proportional to the thickness, as expected, besides there is some influence of surface regularity and color. Then, the optical density depends on the concentration of Fe3+ and Fe4+ impurities, which are the ions responsible for the color center formation12,13. In the Amethyst structure, the Fe3+ ion is located at an interstitial position of quartz positive rhombohedra, being ionized to Fe4+, which is a defect in the structure, the color center. This defect is responsible for the absorption bands in the green-yellow range, allowing the transmittance of ultraviolet, blue and red wavelengths, giving birth to the violet Amethyst color10. Optical absorption spectra and electron resonance paramagnetic resonance (EPR) are the basis for the determination of the uncommon Fe4+ oxidation state14. There is some controversy concerning the Fe4+ location, which could be substitutional to Si4+[14], or interstitial12. Independent on the ion position there is a good agreement that Feis the mainresponsible for the Amethyst color, and that the absorption bands are characteristic of its influence. The bands reported
Figure 1. X-ray diffractogram of a natural Amethyst sample
previously and after a thermal annealing at 1000°C. Labeled directions refer to PDF-8934 file (alpha quartz).
Figure 2. Optical absorption spectra on natural amethyst for an
on Figure 2 are in good agreement with this attribute. Fe3+ impurities are present in low concentrations and have lesser influence on the color varieties of quartz, but it can be important precursors of color centers, for instance, when oxidized to Fe4+[13]. Analysis of other impurities, for instance Aluminum15, does not lead to a relationship with the observed absorption bands, enlarging the idea that most of absorption bands characteristics of Amethyst come from iron impurities16. This idea is associated with the similarities between color centers and iron optical transitions.
As it will be seen, results of thermally stimulated depolarization current (TSDC) reported here are optically influenced by excitation with laser lines, associated with the optical absorption bands. Photo-induced TSDC bands present a different behavior when the excitation line used is close to the absorption band about 550 nm, or when the sample is excited with the 488 nm line.
Concerning TSDC results, there is some shift on the location of the main band, because we are dealing with natural samples. However, all the bands are located between 200 and 270 K, and for the reported sample, its TSDC band is located around 225 K. In order to find out the best temperature to bias the amethyst sample, the TSDC procedure was repeated several times, changing the polarization temperature. Some of these results are summarized in Figure 3. For all of these four measurements, the capacitive discharge time (tdc) was 30 minutes, the temperature raising rate (b) was 5 K/min and the polarization voltage (Vp) was 1500 V. There are two curves practically overlapped, which correspond to measurements with a 1.1 mm thick sample, done with polarization at 295 K (room temperature), but varying the polarization time. Measurements shown with the other two curves correspond to a 1.3 mm thick sample, where a volumetric contribution is detected due to an increased current value. When the polarization was done at room temperature, there was freezing out of all sorts of impurities. The sample heating at fixed rate led to a current increase starting at the beginning of the band (about 170 K), but no decrease was observed and the current increased until room temperature. The polarization was also carried out at 220 and 250 K, as shown in Figure 3. The first one corresponds to the beginning of the band and the second one is an approximated value
where, when the polarization is done at room temperature, there is a tendency to ending the current growth. This last polarization temperature was chosen to verify if surface charge or impurities contribution had their effect separated from the main band. For all of these measurements, only the current growth was observed, although a slight tendency of band formation could be observed, mainly for polarization at 220 K, which means that it was observed a shoulder about 250 K, indicating the probable formation of the TSDC band, but no current decrease was observed. It reinforces the hypothesis of polarization of all sorts of dipolar impurities besides the Fe3+ and Fe4+ based dipoles. The overall result is that the main band is masked, and cannot be unequivocally identified. However, this result helps to determine a better temperature for the sample polarization. Biasing the sample at 170 K (beginning of the curve), leads to what is called “peak cleaning”, where secondary impurities and surface charge are already frozen at original positions and do not influence the current during temperature increasing. It is important to mention that when the temperature was decreased with the polarization applied for some time at 170 K, usually 10 minutes, the TSDC peak was higher and, then, this was the used procedure for the results reported in this paper. Considering that even for the polarized sample, the dipole direction distribution is a statistical function, this polarization time allows that the dipoles be statistically oriented by the electric field before the depolarization process, which takes place with temperature increasing.
Figure 4 presents TSDC results for natural Amethyst with distinct polarization voltage at 170K for 10 minutes. There is clear dependency between the magnitude of applied bias and depolarization current. This dependency leads to a linear relationship between the TSDC band peak and the applied voltage, as can be seen in the inset of Figure 4.
Figure 5 shows photo-induced TSDC, for the same sample of Figure 4. Illumination was done at 77 K for 5 minutes, after removing the electric polarization. As observed in Figure 5, the band is affected in its magnitude but not in its position. Measurements were taken using an Ar+ laser adjusted in two distinct wavelengths: 488 nm and 541 nm. The latter is very close to the absorption peak about 550 nm (Figure 2). Independent on the used line for
Figure 3. TSDC measurements obtained by polarizing the amethyst sample at different temperatures.
Figure 4. Formation of TSDC band and dependency with
excitation, the variation of laser power leads a decrease of the band intensity with laser power increase. For the same laser power (250 mW or 500 mW) the TSDC current peak is lower for excitation with 541 nm (lower energy) when compared with excitation with 488 nm. The effects of light incidence with these selected energies are evident, causing some perturbation on the polarized dipoles, which are metastably and statistically oriented by the electric field.
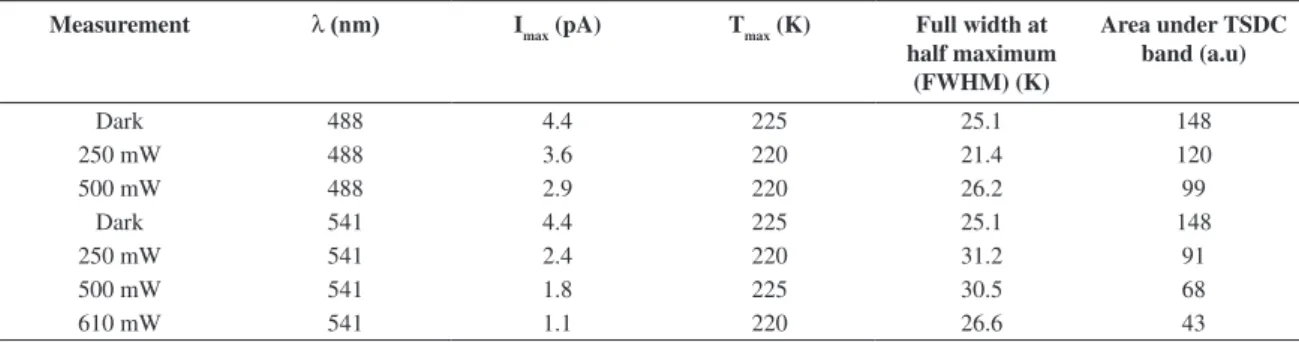
Table 1 shows the influence of laser power at wavelengths of 488 nm and 541 nm on TSDC peak current, and the area under the TSDC band, for fixed bias voltage of 1500 V (electric field of 1.15 V.m–1). The total charge Q released by the depolarization process is proportional to the number of dipoles (N) in the bulk17,18. As seen in Table 1 the light irradiation decreased the number of such dipoles. Some data listed in Figure 1, can be better visualized in Figure 6, where the TSDC peak is shown as function of laser power and the area under the TSDC curve is shown in the inset.
Considering φ as representing the average value of dipole inclination angle, measured to the direction of application of the electric field (which can be determined through a Boltzmann distribution)17, when the dipoles are randomly oriented throughout the sample, φ is about 90°, which means the dipoles are in thermal equilibrium. The electric field rotates these dipoles, taking them to a high energy position, which is metastably kept by the bias. Temperature decrease freezes the dipoles in biased positions and the temperature increase provides enough thermal energy for the dipoles overcome the activation barrier and return to its original position, randomly distributed throughout the Amethyst sample. The dipole potential energy (U) is related to the activation energy, which depends on the dipolar moment. In other words, for the maximum alignment of dipoles with the applied electric field, φ is zero and U will have its maximum value.
The monochromatic light interacts with the oriented dipoles, probably shifting its orientation distribution related to the electric field direction, changing the value of φ, and, thus the energy U. Then, the area under the TSDC band is decreased, because the charge displacement is lower, giving birth to a current of lower intensity. Table 1 also shows this effect, for instance, when the excitation line is kept at 488 nm, the area under the TSDC curve is reduced 19.1%, with power of 250 mW, and 32.9% for 500 mW, both compared to the dark value.
Comparing the TSDC curves shown in Figure 5, for illumination with the 541 nm line, the area reduction with laser power of 250 mW was 38.3%, which can also be verified in Table 1. It means a more pronounced reduction compared with illumination with 488 nm, even when the power is twice the used value in this case (500 mW). This is expected, because 541 nm is very close to the recorded absorption band of Amethyst (550 nm – Figure 2). The area
Figure 6. Photo-induced TSDC current peak as function of laser
power. Inset: Area under the TSDC band as function of laser power. In this figure, the straight lines are drawn only as a guide to the eyes.
Figure 5. TSDC data in the regular procedure and photo-induced
with an Ar+ laser, where two distinct laser lines and several laser
powers are used.
Table 1. TSDC current peak (Imax), temperature at Imax, FWHM and area under the TSDC band, for fixed bias voltage of 1500 V (electric field of 1.15 V.m–1), and variation of laser Power at 488 and 541 nm.
Measurement λ (nm) Imax (pA) Tmax (K) Full width at
half maximum (FWHM) (K)
Area under TSDC band (a.u)
Dark 488 4.4 225 25.1 148
250 mW 488 3.6 220 21.4 120
500 mW 488 2.9 220 26.2 99
Dark 541 4.4 225 25.1 148
250 mW 541 2.4 220 31.2 91
500 mW 541 1.8 225 30.5 68
slight relative variation of peak magnitude is detected for the sample submitted to thermal treatment. X-ray difractograms did not allow detecting impurities clusters.
The optical absorption spectra allowed distinguishing bands about 220, 355 and 550 nm, which are directly proportional to the thickness, surface regularity and color. This absorption bands are in good agreement with previous reported results concerning the Fe attributes, since the optical density depends on the concentration of Fe3+ and Fe4+ impurities. The Fe3+ ion is located at interstitial position of quartz positive rhombohedra, being ionized to Fe4+, becoming a color center, responsible for the absorption bands in the green-yellow range.
Concerning TSDC results, biasing the sample at the 170 K, secondary impurities and surface charge are already frozen at original positions and did not influence the current during temperature increasing. Then, a TSDC band was observed due to the dipoles orientation by the electric field, before the depolarization process, which takes place with temperature increasing. The effect of light on photo-induced TSDC bands was basically to destroy the distribution of polarized dipoles throughout the samples, decreasing the sample magnitude of TSDC bands. This current decrease may be summarized as dependent on two factors: laser power and wavelength. Excitation with wavelength (541 nm) close to absorption band (550 nm) leads to a much more effective destruction of the polarized dipoles, which contributes for the TSDC band, when compared to the laser excitation with wavelengths far from the absorption bands. In natural Amethyst, the Ar+ laser action does not contribute for the formation of any sort of dipoles, even for rather high operating power.
The results shown in this paper help the interpretation of photo-induced electrical characteristics of Amethyst, aiming the contribution of this raw material for technological innovation based on photo-interacting electric devices.
Acknowledgements
The authors thank Prof. Ligia O. Ruggiero and Prof. Americo Tabata for the help with the optical absorption and photo-induced TSDC measurements, respectively. Authors also thank Brazilian financial sources: CNPq and FAPESP. reduction with 541 nm laser line in comparison with the
non-irradiated TSDC band, for laser power of 500 mW and 610 mW is 54.0% and 71.1%, respectively.
On the other hand, the width at half maximum height (FWHM) does not lead to similar conclusion of the area under the curve, because no linear dependency with laser power or incident light energy is obtained, unlike the area under the curve. As can be seen in Table 1, FWHM may even increase for lower areas. It seems that higher current peaks cause a narrowing of the band, which means that the charge movement during the depolarization process is not related with the FWHM value.
When a different procedure was used with laser application, with the sample being irradiated since TP (170 K) until 77 K, the form of TSDC band was identical to the observed curves shown in Figure 5. It means that the laser does not promote dipolar disorientation when the applied bias is still present in the sample, suggesting that the electric field is much more relevant than the laser action on color absorption centers linked to iron impurities. Using the laser as a bias factor, instead the electric field, it did not lead to the formation of a TSDC band, and the current remains only with its background noise value during the whole temperature increase process, suggesting that at least for the incident energies used, the laser is not capable of cause any sort of dipole alignment.
In summary, it may be stated that photo-induced TSDC bands are dependent on two factors: laser power and wavelength. A combination of these two parameters causes a higher or lower influence on the TSDC curve. Excitation with wavelengths closer to absorption bands may lead to a much more effective destruction of the polarized dipole distribution, than when the laser is operated in wavelengths far from the absorption bands. In Amethyst, the Ar+ laser action does not contribute for the formation of any sort of dipoles, even for rather high operating power.
4. Conclusion
X-ray diffraction results reveal alpha quartz as the main structure of the natural stones of Brazilian Amethyst. This result is independent on thermal annealing, even though a
References
1. Brice JC. Crystals for quartz resonators. Reviews of Modern Physics. 1985; 57(1):105-146. http://dx.doi.org/10.1103/
RevModPhys.57.105
2. Guzzo PL, Iwasaki F and Iwasaki H. Al-related centers in relation to γ-irradiation in Response in natural quartz. Physics and Chemistry of Minerals. 1997; 24:254-263. http://dx.doi. org/10.1007/s002690050037
3. Guzzo PL. Rochas e Minerais Industriais: usos e especificações, parte 2. Centro de Tecnologia Mineral; 2008. cap. 31, p. 681-721.
4. Duarte LC, Juchen PL, Pulz GM, Brum TM, Chodur N, Liccardo A et al. Aplicações de Microscopia Eletrônica de Varredura (MEV) e Sistema de Energia Dispersiva (EDS) no Estudo de Gemas: exemplos brasileiros. Pesquisas em Geociências. 2003; 30(2):3-15.
5. Juchen PL, Brum TM, Fischer AC and Svisero DP. The amethyst from Alto Uruguai Mining District - Parana Basin, Brazil. In: Proceedings of the 18th General Meeting of the International Mineralogical Association; 2002; Edinburgh. Edinburgh; 2002. p. 18-146. Program with Abstracts. 6. Guzzo PL, De Miranda MR and Da Luz AB. Espectroscopia
infravermelha à baixa temperatura em quartzos e ametistas com altas concentrações de OH e H2O. Revista Escola de Minas. 2009; 62(3):349-356.
7. Scalvi RMF, Siu Li M, Ruggiero LO and Scalvi LVA. Light-Induced Electric Dipole relaxation in synthetic and natural alexandrite. Radiation Effects and Defects i n S o l i d s . 2001; 156(1-4):295-299. http://dx.doi.
8. Scalvi RMF, Siu Li M and Scalvi LVA. Annealing effects on optical properties of natural alexandrite. Journal of Physics: Condensed Matter. 2003; 15:7437-7443. http://dx.doi. org/10.1088/0953-8984/15/43/025
9. Scalvi LVA, Siu Li M and Ruggiero LO. Light-induced relaxing dipoles in n-type AlxGa1-xAs. Physical Review B. 1995; 51:13864-13867. http://dx.doi.org/10.1103/
PhysRevB.51.13864
10. Cortezão SU, Pontuschka WM and Blak AR. Depolarization currents (TSDC) and paramagnetic resonance (EPR) of iron in amethyst. Journal of Physics and Chemistry of Solids. 2003; 64:1151-1155. http://dx.doi.org/10.1016/ S0022-3697(03)00043-X
11. Powder Diffraction File: Inorganic. Swarthmore: Published by the JCPDS; 1983. v. 21.
12. Cohen AJ. Amethyst Color in Quartz, the Result of R a d i a t i o n P r o t e c t i o n I nvo l v i n g I r o n . A m e r i c a n Mineralogist 1985; 70:1180-1185.
13. Rossman GR. Colored Varieties of Silica Minerals. Reviews on Mineralogy, Mineralogy Society of America. 1994; 29:433-467.
14. Cox RT. Optical Absorption of the d4 ion Fe4 +
in pleochroic amethyst quartz. Journal of Physics C:
Solid State Physics. 1977; 10:4631-4643. http://dx.doi. org/10.1088/0022-3719/10/22/032
15. Mckeever SWS. Thermoluminescense of Solids. Cambridge
University Press; 1985. p. 187-189. http://dx.doi.org/10.1017/ CBO9780511564994
16. Cohen AJ and Hassan F. Ferrous and Ferric ions in Synthetic α-Quartz and Natural Amethyst. American Mineralogist 1974; 59:719-728.
17. Papathanassion AN, Sakellis I, Grammatikalis J, Sakkopoulos S, Vitoratos E and Dalas E. An insight into the localization of charge carriers in conducting polyaniline by analyzing thermally stimulated depolarization signals. Solid State Communications. 2003; 125(2):95-98. http://dx.doi.
org/10.1016/S0038-1098(02)00707-X