ISSN 0104-6632 Printed in Brazil
www.abeq.org.br/bjche
Vol. 32, No. 04, pp. 837 - 848, October - December, 2015 dx.doi.org/10.1590/0104-6632.20150324s00002232
Brazilian Journal
of Chemical
Engineering
OXIDATION OF PHENOL IN AQUEOUS
SOLUTION WITH COPPER OXIDE CATALYSTS
SUPPORTED ON
γ
-Al
2
O
3
, PILLARED CLAY AND
TiO
2
: COMPARISON OF THE PERFORMANCE AND
COSTS ASSOCIATED WITH EACH CATALYST
C. A. Pires
1*, A. C. C. dos Santos
1and E. Jordão
21
Chemical Reaction Engineering Laboratory, Department of Chemical Engineering, PPEQ, Escola Politécnica, UFBA, Rua Aristides Novis 2, 2º Andar, Federação, CEP: 40.210-910, Salvador - BA, Brasil.
Phone: + (55) (71) 3283 9814, Fax: + (55) (71) 3283 9809 E-mail: [email protected]
2
College of Chemical Engineering, Unicamp, Campinas - SP, Brazil.
(Submitted: August 17, 2012 ; Revised: November 30, 2014 ; Accepted: December 12, 2014)
Abstract - The Catalytic Wet Air Oxidation (CWAO) of phenol using copper oxide catalysts supported by γ
-Al2O3, TiO2, and pillared clay was evaluated to identify which of these catalysts was the most appropriate for
this reaction. The CuO/PILC, CuO/γ-Al2O3 and CuO/TiO2 catalysts were the most successful at removing
phenol and resulted in more than 96% conversion. Among these catalysts, CuO/γ-Al2O3 produced the largest
amount of CO2, the lowest amount of intermediate products and the lowest amount of copper leaching. These
results showed that the CuO/γ-Al2O3 catalyst was the best for the end of the reaction. However, the methods
used in this study did not allow us to identify the most appropriate reaction time (or catalyst). An alternative
approach for this problem was to quantify the costs for each reaction time. Using this approach, the CuO/γ-Al2O3
catalyst was the most economically favorable catalyst when it was used during the first hour of the reaction. Keywords: Phenol; Oxidation; CuO; Pillared clay; TiO2; Costs.
INTRODUCTION
The elimination of organic pollutants in wastewa-ter by oxidation is an important subject that deserves particular attention due to increasing amounts of in-dustrial and urban emissions and the increasing need to protect the environment.
Phenolic compounds form a class of chemical spe-cies that are commonly found in wastewaters from numerous industries. These compounds are danger-ous to living organisms due to their high levels of toxicity.
Conventional industrial effluent treatments are unable to reduce phenolic concentrations to
accept-able levels. Although biological treatment is increas-ingly effective due to the progress of microbiological studies, according to Nogueira (1998) and Kim and Ihm (2011), microbial intolerance to these com-pounds remains an issue. Quintanilla et al. (2010) rejected the possibility of sending effluents directly for biological treatment and noted the need for pre-treatment in an integrated process for increasing biodegradability.
838 C. A. Pires, A. C. C. dos Santos and E. Jordão
Brazilian Journal of Chemical Engineering
pharmaceutical industries. Gao et al. (2013) reported that the CWAO process is effective at eliminating organic and inorganic pollutants in wastewaters and that units have been installed in chemical, petro-chemical and pharmaceutical industries. According to Oliviero (2003), the CWAO process can treat many pollutants, including pollutants with low solu-bilities or those containing polymers and fatty acids. Kim and Ihm (2011) reported that the CWAO proc-ess at high prproc-essure (1 to 7 MPa) and high tempera-tures (423 to 563 K) can reduce pollutant concentra-tions, such as phenolic compounds. Thus, the CWAO process it is one of the most efficient methods for reducing the Total Organic Carbon (TOC) concentra-tions in wastewater (Luna et al., 2009).
According to Santos et al. (2005), the catalysts used in the CWAO process could be classified as being composed of noble metals (Ru, Pd, Pt), metal-lic oxides and their complexes (Cu, Zn, V, Mn/Ce, etc.). Copper oxide-based catalysts have been widely researched in the last 35 years due to their high activ-ity. However, the dissolution of copper catalysts in acidic environments is well known (Sadana and Katzer, 1974). In studies conducted by Pintar (1997), phenol was oxidized over a supported Zn-Cu-Co oxide catalyst, resulting in the dissolution of metals, including 20% Cu, 10% Zn and 15% Co. According to Pintar and Levec (1992a), these species can in-crease the global disappearance rate of phenol by 10% when they are dissolved in the liquid phase. Arena et al. (2003) revealed that dissolved copper ions from catalysts produce an important reaction exten-sion in the liquid phase that changes the heterogene-ous catalytic reaction into a homogeneheterogene-ous reaction and influences the oxidation rate of organic com-pounds and their oxidation routes. Among the materi-als studied, γ-Al2O3 is one of the best (Massa et al.,
2009). Other support materials, such as silica (Njiribeako et al., 1978), activated carbon (Brainer et al.,2014), pillared clay (Carriazo et al., 2005), TiO2
(Dükkancý and Gündüz, 2009), MCM-41 (Eimer, 2006), ZSM-5 (Valkaj et al., 2007), Ce and Ce-Zr oxides (Nousir et al., 2008), γ-Al2O3-CeO2 (Balzer et
al., 2014) and polymeric membranes (Molinari at al., 2009), are promising materials and are being increas-ingly used as catalytic oxidation supports.
Generally, γ-Al2O3, pillared clay and TiO2 have
been shown to be adequate for supporting copper oxide when applied to the phenol catalytic oxidation process. However, no studies have indicated which of these catalysts is best. Therefore, the aim of this study is to determine the relevant aspects that con-tribute to the classification of CuO/γ-Al2O3, CuO/PILC
and CuO/TiO2 catalysts in the CWAO of phenol.
This paper proposes a method that uses information about the costs involved in catalyst preparation, the removal of metals and the removal of organic inter-mediates to define the importance of these catalysts.
MATERIALS AND METHODS
Preparation of the Catalysts
The catalysts used in this study were prepared us-ing the impregnation method (Hamad, 2010) with a copper nitrate aqueous solution to obtain catalysts with 3% w/w copper oxide supported by TiO2
(Fluka), Al2O3 (Degussa) and Montmorillonite -
Alu-minum Pillared Clay (PILC) (Fluka). Using the fol-lowing procedure, 5 g of each catalyst were prepared. First, 0.549 g of copper precursor (Cu(NO3)2·2.5 H2O,
Sigma), was dissolved in 0.06 L of deionized water while maintaining the homogeneity of the solution using magnetic stirring. In another recipient, 4.55 g of the support material was added to 0.075 L of de-ionized water while maintaining the homogeneity of the solution using magnetic stirring. Then, the two solutions were poured into another glass vessel while maintaining the temperature at 393 K and stirring with a magnetic stirrer for 5 h. The resultant mud was dried in an oven at 393 K for 12 h. The solid matter obtained was ground, sieved and calcined at 673 K for 4 h at a heating rate of 274 K min–1 under air at a flow rate of 0.498 L min–1. In addition to these materials, commercial copper (II) oxide (Sigma) was used as a catalyst.
Catalyst Characterization
The copper (II) oxide content in the heterogene-ous catalysts was determined using an X-ray fluores-cence spectrometer XRF-1800 (Shimadzu).
Qualitative information regarding the sample com-position was obtained using Energy Dispersive X-ray Spectroscopy (EDX). In addition, a scanning elec-tronic microscope was used (model LEO 44Oi (LEO)) with a secondary electron detector for micrographs, a Si/Li detector (Oxford) for elemental microanalysis and a sputter coater (Polaron). The samples were coated with Au/Pd and the working temperature was 288 K.
Oxidation of Phenol in Aqueous Solution with Copper Oxide Catalysts Supported on γ-Al2O3, Pillared Clay and TiO2 839
The dissolution of copper(II) was analyzed using atomic absorption spectroscopy (Perkin Elmer Spec-trometer model AAnalyst 100). Three standards were used to construct the calibration curve for each ele-ment and distilled water was used as a blank. Ali-quots of the reaction mixture were vacuum filtered before atomic absorption spectroscopic analysis. Next, X-ray diffraction (XRD) measurements were carried out on a Shimadzu apparatus (XRD-6000) employing CuKα radiation from 5° < 2 < 80° with a scanning speed of 2° min–1 to investigate the crystal-line structures of the catalysts. The angle range and the temperature rate were similar to those used by Manivel et al. (2010), Hamed (2010) and Achma et al. (2008).
Experimental Set-Up
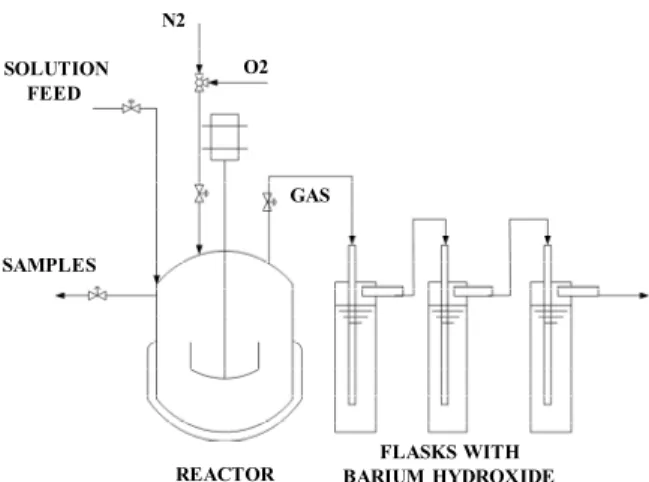
The experiments were carried out on a bench unit, which is illustrated in Figure 1. The reaction occurred inside a stainless steel reactor with a capacity of 0.399 L (Parr Instruments Co.). The reactor was linked to an agitator and a heating system, and the rotation and temperature were controlled by a Parr Instrument module (model 4842). The pressure control system was a model BRGDS (Autoclave Engineers).
SAMPLES SOLUTION
FEED
N2
O2
REACTOR GAS
FLASKS WITH BARIUM HYDROXIDE
Figure 1: Experimental set-up for the catalytic
oxi-dation studies.
The oxidation reaction was carried out in a batch slurry reactor that was operated in semi-continuous mode. First, the reactor was loaded with 0.180 L of distilled water and 0.2 g of catalyst. The system was closed and purged with N2 and O2 to
draw out any contaminants that could influence the reaction. The pressure of the reactor was adjusted to 2 x 10³ kPa. After the mixture solvent/catalyst had reached its working temperature (413 K), 0.02 L of a phenol solution was added at 50 g L–1, which resulted
in a reaction mixture with 5 g L–1 phenol (0.02% w/w) (according to Duprez et al., 1996). Next, the reaction was started, and samples were collected each hour until 5 hours of processing were completed.
Analytical Methods
The concentrations of the samples drawn from the reaction mixture were identified using gas chroma-tography. For this analysis, a TRACE GC (Thermo Quest) equipped with a NST150 capillary column (30 m; 0.25 mm DI; 0.25 μm) (Nano Separation Technologies), a FID detector and a quartz splitless liner with silanized glass were used to make the injector walls inert to the short chain carboxylic acids that formed during the course of the reaction. The chromatographic method was adjusted according to Aquino and Santiago-Silva (2006) with the injector and detector temperatures set at 523 and 573 K, re-spectively. Next, the oven was heated to 333 K and remained at this temperature for 1 min before in-creasing to 473 K at 5 K min–1, where it remained for 1 min. Next, the system was calibrated using acetic acid and phenol with phenol concentrations of 0.1 to 5 g L–1 and acetic acid concentrations of 0.003 to 0.03 g L–1. A calibration curve was constructed sepa-rately for each compound by plotting the peak area (y-axis) versus the concentration (x-axis). All curves were fit using a linear least-squares regression. The values obtained for the correlation coefficients were above 0.98 and the standard deviation was below 2.43%, which indicated that the method was linear in the studied concentration range.
The experimental error was calculated using the phenol concentrations at the end of the reactions. The average phenol concentration and the variance were calculated for each experimental test. The estimated weighted averages of the variances were obtained by using these variances and the degrees of freedom of each test. From these results, we obtained an experi-mental standard deviation of approximately 3.21% (which is also referred to as the standard error or experimental error) for the 95% confidence interval.
The CO2 produced by the phenol oxidation reaction
was indirectly identified through the production of BaCO3.
The gas generated from the oxidation reaction was continuously bubbled through 2 L of an aqueous solution containing 11 g L-1 of barium hydroxide and was stored in a serially arranged battery of washer flask. The BaCO3 formed was periodically collected
and filtered, dried and weighed. Next, the amount of CO2 was defined using stoichiometry. The Ba(OH)2
840 C. A. Pires, A. C. C. dos Santos and E. Jordão
Brazilian Journal of Chemical Engineering
balance and by considering that the initial phenol content was completely converted to CO2.
The intermediate products were estimated based on the carbon balance according to the mass of phenol after time t and the amount of CO2 generated
during the process.
RESULTS AND DISCUSSION
Characterization
The EDX technique was used to identify the chemical composition of each catalyst, and the re-sults of the analyses are shown in Figure 2.
a
b
c
Figure 2: The EDX patterns of (a) CuO-PILC, (b)
CuO/γ-Al2O3 and (c) CuO-TiO2.
The chemical compositions of the studied cata-lytic systems were typical of catalysts formed by copper oxides, particularly of those supported by pillared clay (Figure 2a), alumina (Figure 2b) and titanium dioxide (Figure 2c). Table 1 presents the
CuO content of each catalyst according to the XRF technique and their BET specific surface areas.
Table 1: Copper (II) oxide contents and specific areas of the catalysts.
Catalysts CuO (%W/W) BET (m2/g)
TiO2 - 8.1
CuO/TiO2 4.6 7.0
PILC - 114
CuO/PILC 3.1 38.4
Al2O3 - 198
CuO/- Al2O3 3.6 193
CuO - 8.5
From the results, it is clear that the surface areas of the supports are distinct, potentially due to the struc-tural characteristics of each material. A high surface area carrier is capable of accommodating a greater number of active sites, which would increase the pos-sibility of its efficient application in catalysis. How-ever, in most cases, a direct relationship exists be-tween the surface area and the catalyst performance due to the lack of homogeneity of the catalyst sur-face energy.
The value obtained for the surface area of the TiO2 support was low relative to the values obtained
for the surface area of the Al2O3 support. The
differ-ence in surface area occurred because TiO2 has few
pores and because particle agglomeration can occur in the pores, which further contributes to the reduc-tion of the specific surface area.
Furthermore, the presence of copper (II) oxide in the support structure potentially reduced the specific area due to the occupation of the pores by salt pre-cursors. The most pronounced reduction in the sur-face area occurred when the pillared clay was im-pregnated, which resulted in a 66% reduction relative to the pure pillared clay. This reduction can be ex-plained by observing the micropore volumes of each material (1.447 x 10⁻³ Lg–1 for pillared clay and 0.023 x 10⁻⁴ L g-1 for CuO/PILC). In addition, this result suggests that some Cu species may block the en-trance to the porous network and/or occupy the inner pores of the Al-PILC during the preparation process and make it inaccessible. Similar events were re-ported by Barrega-Vargas et al. (2005) and Marinkovic-Neducin et al. (2004).
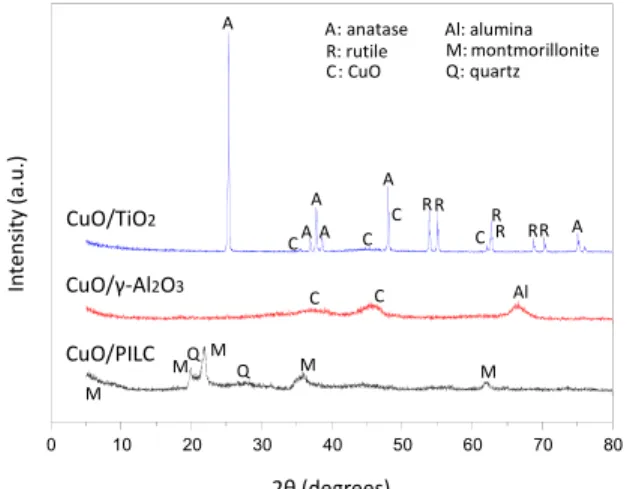
XRD was conducted to determine if any changes in the catalyst structures occurred, as shown in Figure 3.
The XRD patterns of the CuO/-TiO2 catalyst
re-vealed the presence of anatase and rutile and the mono-clinic crystal structure of CuO (Tenorite) (Yousef et al. (2012)).
The XRD pattern of the CuO/-Al2O3 catalyst
Oxidation of Phenol in Aqueous Solution with Copper Oxide Catalysts Supported on γ-Al2O3, Pillared Clay and TiO2 841
particles. The peaks at 38.4° and 48.4° represented the crystal faces of monoclinic CuO. The presence of alumina was confirmed by the peak at 66.7°, which was a reflection from the alumina support (Nandanwar and Chakraborty, 2012).
M: montmorillonite Q: quartz Al: alumina
C: CuO A: anatase R: rutile
0 10 20 30 40 50 60 70 80
CuO/TiO2
CuO/γ‐Al2O3
CuO/PILC
2θ(degrees)
In
tensit
y
(a.u.)
A
A A
A CRR RR A
R R A
C C C
C C Al
M
MQ MQ M M
Figure 3: XRD results for catalysts: CuO/TiO2,
CuO/-Al2O3 and CuO/PILC.
The XRD pattern of CuO/PILC showed peaks that were characteristic of clay and quartz (Wu et al., 2011). The peak at 9° was attributed to the basal reflection and represents the distance between the two clay layers, including the thickness of one of the layers. The peaks at 18° and 35° were attributed to the two-dimensional (hk) planes, which resulted from the diffraction of the random stacking of the layers. The peaks at 21° were ascribed to quartz (Q) impuri-ties in the clay. No characteristic peak of crystalline CuO was observed in these XRD patterns, which in-dicated that the copper species was well dispersed on the support (Li et al., 2011).
Additionally, the structures of the materials were preserved when compared with the XRD of the pure supports that were reported by Zhu et al. (2009) for TiO2, by Park et al. (2004) for γ-Al2O3, and by Su et
al. (2009) for pillared clay.
Catalytic Tests
Catalytic tests were carried out to identify which of the studied catalysts (CuO/γ-Al2O3, CuO/TiO2 and
CuO/PILC, Al2O3, TiO2, pillared clay and CuO)
were more suitable for the catalytic oxidation of phenol in water. The process variables in the experi-mental tests included a temperature of 413 K, total pressure of 2 x 10³ kPa, catalyst concentration of 1 g L–1, phenol concentration of 5 g L–1 and initial pH of approximately 5.
Oxidation of the Phenol
Figure 4 shows that the CuO/PILC, CuO/γ-Al2O3
and CuO/TiO2 catalysts were the most successful at
removing the phenol, which generated conversions of more than 96% in the first three hours after start-ing the reaction. The Al2O3 and pillared clay
cata-lysts were unable to remove the phenol, so the results are presented on the abscissa in Figure 4.
0 20 40 60 80 100 120
0 1 2 3 4 5
P
h
en
o
l c
o
nver
si
o
n
(%
)
Reaction time (h)
PILC
TiO2
Al2O3
CuO/PILC
CuO/Al2O3
CuO/TiO2
CuO
Figure 4: Variations in the phenol conversion as a
function of reaction time for the catalysts.
The absence of activity in the pillared clay di-verges from the findings of Carriazo et al. (2005), who recorded a conversion of above 90% two hours after starting the reaction. This result can be ex-plained by the low iron content of the material that was used in this work (0.7% w/w) relative to the material used by Carriazo et al. (2005) (6.06% w/w).
The CuO and TiO2 catalysts were active,
produc-ing a period of induction of approximately one hour. Most studies concluded that the reaction involved the generation of free radicals, which are responsible for the initial steps of phenol oxidation (Shibaeva et al., 1969; Miguélez et al., 1997). The curve generated by the TiO2 indicates that the phenol was slowly
elimi-nated, with a conversion rate of 58% in 5 h after starting the reaction. The oxidation reaction pro-duced by the CuO went through a period of high activity and reached a conversion of 97% in 3.5 h after the start of the reaction.
The CuO catalyst showed a higher activity, likely due to the formation of free radicals, as explained by Sadana and Katzer (1974). The operating conditions of the process potentially favored the formation of cuprous oxide or phenolic radicals on the catalyst surface.
The CuO/TiO2 and CuO catalysts showed similar
842 C. A. Pires, A. C. C. dos Santos and E. Jordão
Brazilian Journal of Chemical Engineering
resulted in a greater activity (Figure 4), most likely because the synergy between CuO and TiO2
de-creased the amount of energy that was required to excite the electrons in the conduction band to the valence band (as explained by Manivel et al. (2010)).
Table 2: Changes in the rate of reaction in the oxi-dation of phenol.
Rate of Reaction (mol/L h) Time (h) CuO/-Al2O3 CuO/PILC CuO/TiO2 CuO
1 4.99 4.49 0 0 0.5 4.99 4.49 0 0
1 4.99 4.49 1.06 0.53
1.5 0.29 0.75 4.27 2.45
2 0.29 0.75 4.27 2.45
2.5 0 0.08 0.54 2.45
3 0 0.08 0.54 2.45
3.5 0 0 0 0.31
4 0 0 0 0.31
5 0 0 0 0
Figure 5 shows the H2-TPR profiles of the CuO,
TiO2 and CuO/TiO2 samples.
100 200 300 400 500 600 700 800
TiO2/CuO
CuO
H2
c
ons
umpti
o
n
Temperature (°C)
TiO2
A B C
373 473 573 673 773 873 973 1073
H
2
C
o
ns
um
p
ti
o
n
Temperature (°K)
Figure 5: TPR profiles of CuO, TiO2 and CuO/TiO2
samples.
A single peak was observed at 325 °C for pure CuO. However, no peak was observed for pure TiO2,
which indicated that the reduction of TiO2 was very
difficult. For CuO/TiO2, three reduction peaks were
observed (A, B and C) at 213, 310 and 360 °C, re-spectively. According to Xiaoyuan et al. (2004), peak A likely resulted from the interaction of highly dis-persed CuO species with TiO2. In addition, peak B
likely resulted from oxide clusters with a structure that was similar to the structure of CuO (i.e., short-range order but not crystalline). The C peak poten-tially resulted from the CuO crystallites. According to Gaoa et al. (2011), compared with the crystalline CuO species, the dispersed copper oxide species are in close contact with the surface of TiO2, resulting in
a strong interaction between them and in the lowest
reduction temperature. Thus, it was suggested that the CuO species with high dispersion was an active site for phenol oxidation and that the improved cata-lytic activity was likely related to the highly dis-persed CuO species.
According to Akyurtlu et al. (1998), the profiles of conversion presented by the CuO and CuO/TiO2
systems indicated that no mass transfer limitations occurred between the gaseous phase and the liquid phase. For these authors, the induction period re-sulted from a very slow phase in the formation of hydroquinone and catechol, which suggested a mecha-nism of homogeneous-heterogeneous free radicals.
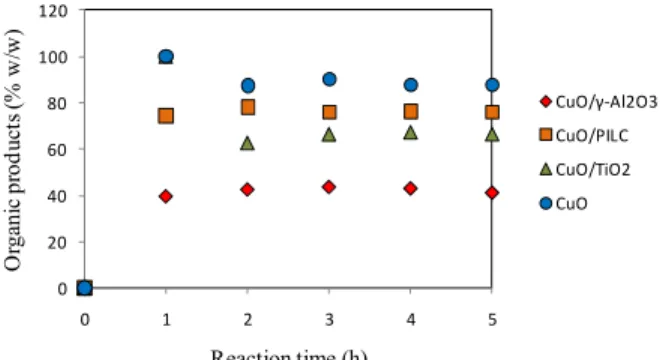
Figure 6 shows that more than 50% of the inter-mediate products formed during the reaction with CuO and CuO2/TiO2 were present in the reacting
mixtures. However, according to Figure 7, the CuO/TiO2 system produced 22.5% more CO2 than
CuO, which indicated a better activity for total oxi-dation.
0 20 40 60 80 100 120
0 1 2 3 4 5
O
rga
ni
c pr
od
u
ct
s
(%
w
/w
)
Reaction time (h)
CuO/γ‐Al2O3 CuO/PILC
CuO/TiO2
CuO
Figure 6: Changes in the concentrations of the
inter-mediate products during the oxidation of phenol.
0 10 20 30 40 50 60 70
0 1 2 3 4 5
C
ar
b
on d
iox
id
e
(%
w
/w
)
Reaction time (h)
CuO/γ‐Al2O3 CuO/PILC
CuO/TiO2
CuO
Figure 7: Changes in the carbon dioxide
concentra-tions during the oxidation of phenol.
The interactions of copper with the alumina and the pillared clay produced more active materials than the interactions of copper with TiO2, even when the
Oxidation of Phenol in Aqueous Solution with Copper Oxide Catalysts Supported on γ-Al2O3, Pillared Clay and TiO2 843
similar activities, with a slightly higher reaction ob-served for CuO/γ-Al2O3 for up to two hours of
proc-essing, as shown in Table 2. These catalysts were the most efficient at eliminating phenol and resulted in a conversion of approximately 80% 1 h after starting the reaction.
During the first hour of the reaction, the phenol was degraded quickly in the presence of the CuO/ -Al2O3 and CuO/PILC catalysts. The best CuO/
-Al2O3 activities for the degradation of phenol were
shared with the best activity for complete oxidation (to produce 50% w/w of CO2, as shown in Figure 7,
and lower concentrations of intermediate products (37% w/w), as shown in Figure 6). However, despite the fact that the degradation of phenol was high when using the CuO/PILC catalyst, the activity was not good enough for complete oxidation (21% w/w CO2) and the intermediate product degradation was
not good (67% w/w). This result can be explained by the greater available surface area in -Al2O3, as
shown in Table 1, and the greater mass of CuO that remained on the surface after leaching, as shown in Table 3. When analyzing the data using PILC, the surface area of CuO/PILC was much smaller than the surface area of the clay. In addition, the mass of cop-per that remained on the catalyst surface after leach-ing was the lowest. These results suggest that the CuO/PILC catalyst may provide better results, al-though the surface area was greatly reduced during the preparation phase (63% reduction) and the amount of copper leaching was very high (72%).
Dissolution of Copper
The dissolution of copper on the surface of the catalyst occurred when the catalyst was exposed to the hot and acidic aqueous media. According to Pin-tar and Levec (1992b), the exposure of the catalyst to the hot and acidic aqueous medium favored an in-crease in the copper solubility. The loss of this metal to the aqueous environment not only influences the stability of the catalyst, but also modifies the reac-tion mechanism by altering the phenol reacreac-tion rate and the rate that intermediates are generated due to oxidation (Santos et al., 2005). In addition, Pintar (2003) observed that the reaction characteristics were attributed to the copper in solution and that the in-crease in toxicity should be considered when using this metal as a catalyst. To investigate the increase in toxicity that results from the dissociation of copper from the catalysts used in this study, the copper con-tents in the reaction mixtures were analyzed and are presented in Table 3.
Table 3: Dissolution of copper on the catalyst sur-face 5 h after the beginning of the reaction.
Catalysts
Copper New
catalyst (g)
Solution Dissolution (% w/w) (g) mg/L
CuO/TiO2 0.0074 0.0048 24 64.9±2.35
CuO/PILC 0.0050 0.0036 18 72.0±2.35 CuO/-Al2O3 0.0058 0.0032 16 55.2±2.35
CuO 0.0048 0.0038 19 79.2±2.35
By analyzing the copper contents in the solutions, we observed that the metal concentrations for all cata-lytic systems were well above 1 mg/L, which is the concentration required by Brazilian law (CONAMA). The high concentration of copper in the aqueous solution can be explained by its low concentration on the surface of the new catalyst (3% w/w), as reported by Garcia et al. (2006). According to these authors, a small amount of copper is dispersed on the catalyst surface without causing any copper agglomerates, which facilitates the action in acid environments and causes increased leaching. When analyzing the per-centage of copper in the aqueous solution, we ob-served that the catalytic systems underwent extensive leaching based on the operational conditions that were used. The largest loss occurred when using the CuO/PILC catalyst, which resulted in a 72% loss of its original copper mass. However, the other catalysts also underwent intense leaching, with losses that exceeded 50%.
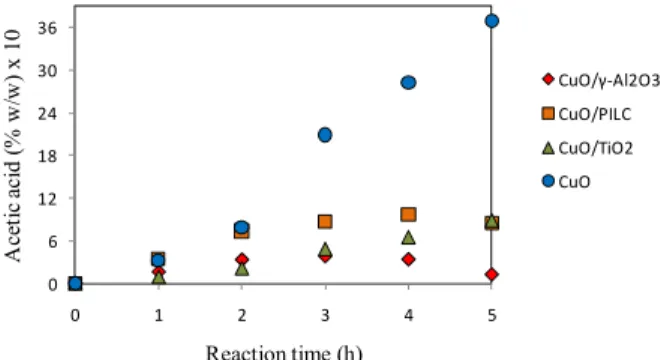
Table 3 can be compared with Figure 6 to explain the variations in the dissolved copper concentration. The influences of the catalysts on the production of the intermediate products follow the same order as copper dissolution (CuO > CuO/PILC > CuO/TiO2 >
CuO/-Al2O3). Thus, the amount of carboxylic acid
in the reaction mixture follows the same trend-line, which is confirmed by the production of acetic acid (shown in Figure 8).
0 6 12 18 24 30 36
0 1 2 3 4 5
Ac
et
ic
a
ci
d
(
%
w
/w)
x
1
0
Reaction time (h)
CuO/γ‐Al2O3 CuO/PILC
CuO/TiO2
CuO
Figure 8: Changes in the acetic acid concentrations
844 C. A. Pires, A. C. C. dos Santos and E. Jordão
Brazilian Journal of Chemical Engineering
The acidity of the reaction medium was largely generated by the carboxylic acids that existed in the reaction mixture. Greater acid concentrations corre-sponded with lower pH values in the reaction mix-ture and greater copper leaching. Thus, the increased leaching that occurred as the concentrations of the intermediate products increased in the medium can be explained.
COST OF THE REACTION
To choose the most suitable catalyst for the CWAO process, the catalytic activity results and the total cost of the process must be considered. In this study, the cost of the catalyst separation from the suspension at the end of the reaction, the fixed costs associated with the equipment, and the operational costs were considered to be similar for all catalytic systems and were labeled as FC. The FC cost was considered as a reference cost and was removed from the total cost. Thus, the total cost was the sum of the costs that varied with the reaction time and the costs of the fresh catalysts. All tests were performed using fresh catalyst, which is reflected in the cost. The advantages and disadvantages of using regenerated catalysts were not considered in this work.
The costs involved, such as the cost of producing fresh catalysts (CPC), the cost of removing metals from the liquid phase (CML) and the costs of dispos-ing of the organic products that were not degraded in the CWAO process must be considered. The cost of removing organic products from the reaction mixture (0.2 L) was labeled as EFC (the cost of removing the phenol) and CIP (the cost of disposing of the inter-mediate products). The costs related to the consump-tion of oxygen and nitrogen (CON) and electricity (CE) per 0.2 L of the reaction mixture were included because they were not the same for each maximum conversion. With these considerations, the total cost for each catalyst used per 0.2 L of the reaction mix-ture is given by using Equation (1).
CUT CPC CML EFC CIP CON CE (1)
Tables 4, 5 and 6 show the basic costs that were considered in this work. The cost of producing the catalysts (CPC) was calculated from the cost of the raw materials. The costs of removing the metals from the liquid phase (CML), the phenol (EFC) and the intermediate products (CIP) were defined as de-scribed by Santos (2002a). Santos (2002a) used data from the World Bank (1992), which shows the costs of removing contaminants from industrial effluents
(0.5 x 10⁻³ US$ at 2.0 x 10⁻³ g–1 of COD and 0.07 US$ at 0.175 g–1 of metal) considering a pollutant load removal of 80%. The cost of removing the COD and dissolved copper used in this work were higher than the ranges shown when considering the industrial wastewater treatment as the most critical.
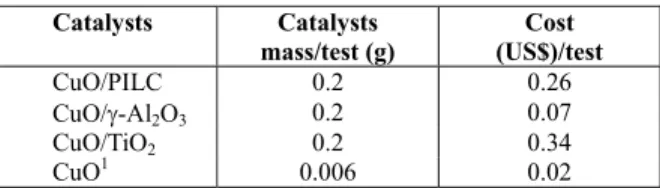
Table 4: Cost of preparing the catalysts.
Catalysts Catalysts mass/test (g)
Cost (US$)/test
CuO/PILC 0.2 0.26
CuO/-Al2O3 0.2 0.07
CuO/TiO2 0.2 0.34
CuO1 0.006 0.02
Note: 1CuO mass is 3% of the heterogeneous catalysts.
Equation (2) was used to determine the chemical oxygen demand (COD), i.e., the amount of oxygen required to completely oxidize the organic products. A similar equation was used by Santos et al. (2002b) to determine the COD of the intermediate products during the catalytic oxidation of phenol in the aqueous phase.
COD8 4X Y 2Z / 12X Y 16Z (2)
The terms X, Y and Z refer to the number of carbon, hydrogen and oxygen atoms in the organic product (CX HY OZ). The results from equation 2 are
shown in Table 5, and the COD of the intermediate product consists of the average COD of the major solution components, except for phenol, which has a much higher COD than the other components.
Table 5: Cost of treating wastewater containing organic products and copper.
Species g COD/ g organic
product
Cost (US$)
Copper - 0.0175/g of metal
Phenol 2.38 0.0020/g of COD Intermediates
Products
1.19 0.0020/g of COD
The costs of preparing the catalysts were the same for all of the tests that were performed and were greater than the cost of removing phenol, the inter-mediate species and the copper from the reaction mixture. Furthermore, the mass of each contaminant was small due to the reaction conditions. Conse-quently, the cost of removing the pollutants repre-sented a small portion of the total cost.
Oxidation of Phenol in Aqueous Solution with Copper Oxide Catalysts Supported on γ-Al2O3, Pillared Clay and TiO2 845
gases during the reaction and on their commercial values. The electricity cost was based on an average rate for Brazilian industries. According to the Brazilian Agency on electrical energy ANEEL (2014), a rate of US$ 0.11/kWh (kilowatt-hour) was considered in this study.”
Table 6: Accumulated costs of oxygen, nitrogen and electricity consumption.
Reaction time (h)
Cost (US$) Oxygen and nitrogen
Cost (US$) electricity
0 0.50 0.022
1 0.52 0.044
2 0.54 0.088
3 0.56 0.132
4 0.58 0.176
5 0.60 0.220
The cost of preparing the catalyst is important for studying any reaction process. However, this cost can hide details of the process that are important for choosing the catalyst and can go unnoticed, given the significance of this cost. Figure 9 shows the initial cost evaluations when only considering the costs of removing pollutants from the reaction mixture. The costs presented throughout the reaction increase in the following order: CuO/-Al2O3 < CuO/PILC <
CuO/TiO2 < CuO.
0 0.001 0.002 0.003 0.004 0.005 0.006 0.007 0.008
0 1 2 3 4 5
Cost (US
$
)
Reaction time (h)
CuO/γ‐Al2O3 CuO/PILC
CuO/TiO2
CuO
Figure 9: Process cost as a function of reaction time
for the catalysts proposed in this study, excluding the catalyst, electricity and oxygen costs.
The costs of the CuO and CuO/TiO2 catalysts
in-creased during the first hour of reaction because the reaction media has high concentrations of phenol and dissolved copper relative to the other catalysts. From the third hour until the end of the reaction, the cata-lyst costs remained constant because the system was already in a steady state (i.e., the system reached maximum conversion). Initially, all of the costs shown in equation 1 were low and did not appear to influence the total cost. However, these costs
in-creased in importance with the scaling up of the re-action system.
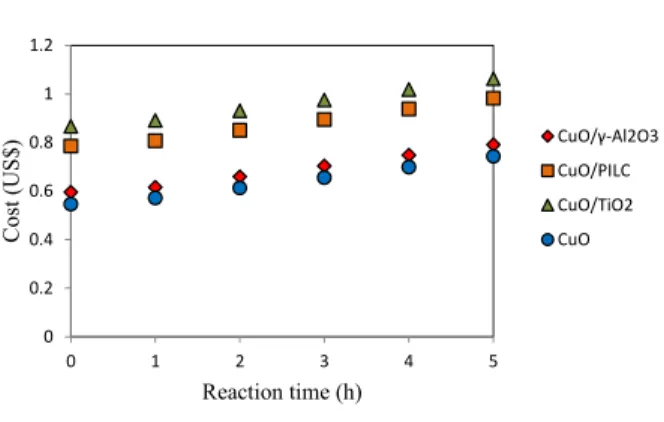
Figure 10 shows the total costs involved in proc-essing phenol (CUT).
0 0.2 0.4 0.6 0.8 1 1.2
0 1 2 3 4 5
Co
st
(
U
S$
)
Reaction time (h)
CuO/γ‐Al2O3 CuO/PILC
CuO/TiO2
CuO
Figure 10: Total reaction cost.
Changes were observed in the shape of the curves and as the catalyst costs increased (CuO < CuO/ -Al2O3 < CuO/PILC < CuO/TiO2). The change in the
behavior of the costs involved in the process can be explained by the cost of preparing the catalysts, whereas the costs of oxygen consumption and nitro-gen and energy are the same for every hour of the reaction. A comparison of the ordinates in Figure 9 with those in Figure 10 reveals that the cost of cata-lyst preparation is at least 78 times the cost of the disposal of the organic products and copper from the reaction mixture. Thus, it is important to consider the costs of the catalyst, the costs of electricity consump-tion and the costs of gas consumpconsump-tion (O2 and N2),
along with the conversion of the main parameters for selecting the most appropriate catalytic system for the oxidation of phenol.
The best catalytic system for the CWAO process for phenol should be chosen based on the low cost of the process and the high conversion rate of phenol. The conversion of CO2 was indirectly considered in
the intermediate costs of the organic products (i.e., CO2 was produced because the intermediate products
were consumed in the reaction). Figure 11 shows the cost data and the conversion of phenol for the CuO and CuO/-Al2O3 catalysts.
Information regarding the CuO/PILC and CuO/TiO2
catalysts was not considered because their lower costs for maximum conversions outweigh the higher costs of the CuO and CuO/-Al2O3 catalysts. The
conver-sion of phenol assigned to the CuO/-Al2O3 catalyst
846 C. A. Pires, A. C. C. dos Santos and E. Jordão
Brazilian Journal of Chemical Engineering
practically the same, 0.62 US$ and 0.65 US$, with a slight advantage for the CuO/-Al2O3 catalyst (0.62
US$). Namely, the two catalysts satisfy the oxidation process under these conversion conditions. However, if the desired conversion was approximately 0.99, the use of the CuO/-Al2O3 catalyst would satisfy
this condition within two hours of reaction at a cost of 0.66 US$ for each test run. In addition, the CuO catalyst would reach a conversion of approximately 0.98 within five hours of reaction at a cost of 0.74 US$ for each test run. For this last condition, the CuO/-Al2O3 catalyst is the most appropriate for the
CWAO process of phenol.
0 h 1 h 2 h 3 h 4 h 5 h CuO/γ‐Al2O3 (Cost) 60 62 66 70 75 79
CuO (Cost) 55 57 61 66 70 74 CuO/γ‐Al2O3 (Conversion) ‐ 93 99 99 99 99
CuO (Conversion) ‐ 4 52 90 97 98 ‐
20 40 60 80 100
120
‐
10
20 30
40 50
60
70
80 Phe
nol
c
onve
rs
ion
(%
)
C
o
st
(U
S
$
)
x
1
0
2
Figure 11: Conversion and total cost of the reaction.
Although the total costs appeared to be very simi-lar between the tests, the costs refer to a reaction mixture of 0.2 L. As the reaction volume increases, the difference between the costs also increases, mak-ing it evident that the CuO/-Al2O3 catalyst was the
best in terms of costs and efficiency.
CONCLUSIONS
The CuO/γ-Al2O3 catalyst appears to be the most
appropriate for removing phenol from industrial effluents when considering its costs for a similar efficiency. However, pillared clay supported copper oxide is a promising catalyst, mainly due to its high phenol conversion, despite undergoing a significant reduction in specific area during its preparation and despite undergoing high copper leaching into the liquid medium.
The surface area reduction could be minimized using another impregnation method (for example, amorphous-citrate route or deposition precipitation) to improve the binding capacity of the copper on the surface of the pillared clay. Therefore, the greater surface area of the catalyst could contribute to a greater number of active sites available for reaction.
The method used to calculate the costs of process-ing phenol in this work are simple and appropriate for identifying the most suitable catalytic system. For the studied reaction system, the costs were deter-mined throughout the reaction time, highlighting the optimal reaction time for each catalytic system. The results of this study showed that the oxidation of phenol is more economically favorable when using the CuO/γ-Al2O3 catalyst.
However, it is possible that the commercial value of the CuO/γ-Al2O3 catalyst is greater than the cost
of preparation shown in this work, which is the sum of the raw material costs. When the commercial prices of the catalyst are presented, perhaps another catalyst would be more suitable for the CWAO process of phenol.
NOTATION
CUT total cost
CPC cost of the production of catalysts CML cost of the removal of metals from the
liquid phase
EFC cost of the removal of phenol
CIP cost of disposing of intermediate products CON costs related to the consumption of oxygen
and nitrogen
CE costs related to the consumption of electricity
COD chemical oxygen demand PILC pillared clay
AOPs advanced oxidation processes
ACKNOWLEDGMENTS
The authors were financially supported by CAPES (PROCAD project No. 0228052). The authors wish to thank Dra. Soraia Brandão for assisting with the XRD analysis.
REFERENCES
Achma, R. B., Ghorbel, A., Sayadi, S., Dafinov, A. and Medina, F., A novel method of copper-exchanged aluminum-pillared clay preparation for olive oil mill wastewater treatment. Journal of Physics and Chemistry of Solids, 69, 1116-1120 (2008).
Oxidation of Phenol in Aqueous Solution with Copper Oxide Catalysts Supported on γ-Al2O3, Pillared Clay and TiO2 847
ANEEL, Available in: <http://www.aneel.gov.br/area. cfm?idArea=550> (Accessed on October 1, 2014). Aquino, F. T. and Santiago-Silva, M., Determination
of volatile fatty acids in municipal solid waste compost by gas chromatography with flame ioni-zation detection. Eclética Química, 31, 25-30 (2006). (In Portuguese).
Arena, F., Giovenco, R., Torre, T., Venuto, A., Par-maliana, A., Activity and resistance to leaching of Cu-based catalysts in the wet oxidation of phenol. Applied Catalysis B: Environmental, 45, 51-62 (2003).
Balzer, R., Probst, L. F. D., Drago, V., Schreiner, W. H. and Fajardo, H. V., Catalytic oxidation of vola-tile organic compounds (n-hexane, benzene, tolu-ene, o-xylene) promoted by cobalt catalysts sup-ported on γ-Al2O3-CeO2. Brazilian Journal of
Chemical Engineering, 31(3), 757-769 (2014). Barrega-Vargas, M., Valencias-Rios, J., Vicente, M.
A., Korilli, S. A. and Gil, A., Effect of the plati-num content on the microstructure and micropore size distribution of Pt/Alumina-Pilared. J. Phys. Chem., B, 1109, 23461-23465 (2005).
Brainer, J. E. N., Sales, D. C. S., Medeiros, E. B. M., Lima Filho, N. M. and Abreu, C. A. M., Wet oxi-dation of glycerol into fine organic acids: catalyst selection and kinetic evaluation. Brazilian Journal of Chemical Engineering, 31(4), 913-923 (2014). Carriazo, J., Guélou, E., Barrault, J., Tatibouet, J. M.,
Molina, R. and Moreno, S., Synthesis of pillared clays containing Al, Al-Fe or Al-Ce-Fe from a bentonite: Characterization and catalytic activity. Catalysis Today, 107, 126-132 (2005).
Dükkancý, M. and Gündüz, G., Catalytic wet air oxidation of butyric acid and maleic acid solu-tions over noble metal catalysts prepared on TiO2.
Catalysis Communications, 10, 913-919 (2009). Duprez, D., Delanoe, F., Barbier Jr. J., Isnard, P. and
Blanchard, G., Catalytic oxidation of organic com-pounds in aqueous media. Catalysis Today, 29, 317-322 (1996).
Eimer, G. A., Casuscelli, S. G., Ghione, G. E., Criv-ello, M. E. and Herrero, E. R., Synthesis, charac-terization and selective oxidation properties of Ti-containing mesoporous catalysts. Applied Cataly-sis A: General, 298, 232-242 (2006).
Gao, P., Li, N., Wang, A., Wang, X., Zhang, T., Perovskite LaMnO3 hollow nanospheres: The
synthesis and the application in catalytic wet air oxidation of phenol. Materials Letters, 92, 173-176 (2013).
Garcia, F. A., Braga, V. S., Dias, J. A. and Dias, S. C. L., Study of leaching of Cu (II) in the CuO/Nb2O5/ SiO2-Al2O3 catalysts after the esterification
reac-tion of acetic acid with ethanol. 29th Annual Meeting of the Brazilian Chemical Society, Águas de Lindóia, SP (2006). (In Portuguese). Hamed, M. N. H., Conversion of isopropanol over
treated CuO supported on γ-Al2O3. Journal of
Ap-plied Sciences Research, 6(8), 1247-1264 (2010). Kim, K. and Ihm, S., Heterogeneous catalytic wet air
oxidation of refractory organic pollutants in in-dustrial wastewaters: A review. Journal of Haz-ardous Materials, 186, 16-34, (2011).
Li, X., Lu, G., Qu, Z., Zhang, D., Liu, S., The role of titania pillar in copper-ion exchanged titania pil-lared clays for the selective catalytic reduction of NO by propylene. Applied Catalysis A: General, 398, 82-87 (2011).
Luna, A. J., Rojas, L. O. A., Melo, D. M. A., Bena-chour, M. and de Sousa, J. F., Total catalytic wet oxidation of phenol and its chlorinated derivates with MnO2/CeO2 catalyst in a slurry. Brazilian
Journal of Chemical Engineering, 26(3), 493-502 (2009).
Manivel, A., Naveenraj, S., Kumar, P. S. S. and An-andan, S., CuO-TiO2 nanocatalyst for
photodegra-dation of Acid Red 88 in aqueous solution. Sci-ence of Advanced Materials, 2, 51-57 (2010). Marinkovic-Neducin, R. P., Kiss, E. E., Cukic, T. Z.
and Obadovic, D. Z., Thermal behavior of Al, AlFe and AlCu-Pillared interlayered clay. Journal of Thermal Analysis and Calorimetry, 78, 307-321 (2004).
Massa, P., Ivorra, F., Haure, P., Cabello, F. M. and Fenoglio, R., Catalytic wet air oxidation of phe-nol aqueous solutions by 1% Ru/CeO2–Al2O3
catalysts prepared by different methods. Catalysis Communications, 8, 424-428 (2007).
Massa, P., Ivorra, F., Haure, P. and Fenoglio, R., Optimized wet-proofed CuO/Al2O3 catalysts for
the oxidation of phenol solutions: Enhancing catalytic stability. Catalysis Communications, 10, 1706-1710 (2009).
Miguélez, J. R. P., Bernal, J. L., Sanz, E. N. and de la Ossa, E. M., Kinetics of wet air oxidation of phe-nol. Chemical Engineering Journal, 67, 115-121 (1997).
Molinari, R., Poerio, T. and Argurio, P., Liquid-phase oxidation of benzene to phenol using CuO cata-lytic polymeric membranes. Desalination, 241, 22-28 (2009).
Nandanwar, S. U., Chakraborty, M., Synthesis of col-loidal CuO/-Al2O3 by microemulsion and its
cata-lytic reduction of aromatic nitro compounds. Chi-nese Journal of Catalysis, 33, 1532-1541 (2012). Njiribeako, A. I., Hudgins, R. R. and Silveston, P. L.,
848 C. A. Pires, A. C. C. dos Santos and E. Jordão
Brazilian Journal of Chemical Engineering
over copper oxide. Industrial Engineering Chem-istry Fundamentals, 17(3), 234-244 (1978). Nogueira, R. F. P., Heterogeneous photocatalysis and
its environmental applications. Química Nova, 21, 69-72 (1998).
Nousir, S., Keav, S., Barbier Jr. J., Bensitel, M., Brahmi, R. and Duprez, D., Deactivation phe-nomena during catalytic wet air oxidation (CWAO) of phenol over platinum catalysts supported on ceria and ceria–zirconia mixed oxides. Applied Catalysis B: Environmental, 84, 723-731 (2008). Oliviero, L., Barbier, J. and Duprez, D., Wet air
oxi-dation of nitrogen-containing organic compounds and ammonia in aqueous media. Applied Cataly-sis B: Environmental, 40, 163-184 (2003). Park, J. W., Jeang, J. H., Yoon, W. L., Park, Y. K. and
Rhee, Y. W., The co-promoted CuO-CeO2/γ-Al2O3
catalyst for the selective oxidation of CO in excess hydrogen. Applied Catalysis A: General, 274, 25-32 (2004).
Pintar, A. and Levec, J., Catalytic liquid-phase oxi-dation of refractory organics in waste water. Chemical Engineering Science, 47, 911, 2395-2400 (1992a).
Pintar, A. and Levec, J., Catalytic oxidation of organ-ics in aqueous solutions. Journal of Catalysis, 135, 345-357 (1992b).
Pintar, A., Bercic, G. and Levec, J., Catalytic liquid-phase oxidation of aqueous phenol solutions in a trickle-bed reactor. Chemical Engineering Sci-ence, 52, 4143-4153 (1997).
Pintar, A., Catalytic processes for the purification of drinking water and industrial effluents. Catalysis Today, 77, 451-465 (2003).
Quintanilla, A., Casas, J. A., Rodriguez, J. J., Hydro-gen peroxide-promoted-CWAO of phenol with activated carbon. Applied Catalysis B: Environ-mental, 93, 339-345 (2010).
Sadana, J. R. A. and Katzer, J., Involvement of free radicals in the aqueous-phase catalytic oxidation of phenol over copper oxide. Journal of Catalysis, 35, 140-152 (1974).
Santos, M. O. R. M., The Impact of Water Charging on the User’s Behavior. Ph. D. Thesis, Federal University of Rio de Janeiro, COPPE, Rio de Ja-neiro, RJ, p. 231 (2002a). (In Portuguese).
Santos, A., Yustos, P., Quintanilla, A., Rodriguez, S. and Garcia-Ochoa, F., Route of the catalytic oxi-dation of phenol in aqueous phase. Applied Ca-talysis B: Environmental, 39, 97-113 (2002b). Santos, A., Yustos, P., Quintanilla, A., Ruiz, G. and
Garcia-Ochoa, F., Study of the copper leaching in the wet oxidation of phenol with CuO-based cata-lysts: Causes and effects. Applied Catalysis B: Environmental, 61, 323-333 (2005).
Shibaeva, L. V., Metelitsa, D. I. and Denisov, E. T., Oxidation of phenol with molecular oxygen in aqueous solutions. I. The kinetics of the oxidation of phenol with O2. Kinetics and Catalysis, 10,
832-836 (1969).
Su, H., Zenh, S., Dong, H., Du, Y., Zhang, Y. and Hu, R., Pillared montmorillonite supported cobalt catalyst for the Ficher-Tropsch reaction. Applied Clay Science, 46, 3, 325-329 (2009).
Valkaj, K. M., Katovic, A. and Zrnčević, S., Investi-gation of the catalytic wet peroxide oxidation of phenol over different types of Cu/ZSM-5 catalyst. Journal of Hazardous Materials, 144, 663-667 (2007).
Wu, X. L., Zhao, D., Yang, S. T., Impact of solution chemistry conditions on the sorption behavior of Cu(II) on Lin'an montmorillonite. Desalination, 269, 84-91 (2011).
Yousef, A., Barakat, N. A. M., Amna, T., Al-Deyab, S. S., Hassan, M. S., Abdel-hay, A., Kim, H. Y., Inactivation of pathogenic Klebsiella pneumoniae by CuO/TiO2 nanofibers: A multifunctional
nano-material via one-step electrospinning. Ceramics International, 38, 4525-4532 (2012).
Zhu, J., Ahang, D., Bian, Z., Li, G., Huo, Y., Lu, Y. and Li, H., Aerosol-spraying synthesis of SiO2/ TiO2
nanocomposites and conversion to porous TiO2 and
single-crystalline TiOF2. Chem. Commum.,