ISSN 0104-6632 Printed in Brazil
www.abeq.org.br/bjche
Vol. 32, No. 04, pp. 805 - 819, October - December, 2015 dx.doi.org/10.1590/0104-6632.20150324s00003547
Brazilian Journal
of Chemical
Engineering
CONTINUOUS AND SEMICONTINUOUS
REACTION SYSTEMS FOR HIGH-SOLIDS
ENZYMATIC HYDROLYSIS OF
LIGNOCELLULOSICS
A. González Quiroga
1*, A. Bula Silvera
2, R. Vasquez Padilla
3,
A. C. da Costa
4and R. Maciel Filho
51
Department of Mechanical Engineering, Universidad del Norte, km 5 Vía Pto Colombia, Barranquilla, Colombia. Phone: (57) (5) 3509509, Ext. 3404, Fax (57) (5) 3509255
*
E-mail: [email protected] 2
Department of Mechanical Engineering, Universidad del Norte, km 5 Vía Pto Colombia, Barranquilla, Colombia. Phone: (57) (5) 3509509 Ext 4229, Fax (57) (5) 3509255
E-mail: [email protected]
3CSIRO Energy Technologies, PO Box 330, Newcastle, NSW 2300, Australia. Phone: (61) 249606293, E-mail: [email protected] 4
Laboratory of Fermentative and Enzymatic Process Engineering, School of Chemical Engineering, State University of Campinas, PO Box 6066, 13083-970, Campinas - SP, Brazil.
Phone: (19) 3521-3959, E-mail: [email protected] 5
Laboratory of Optimization, Design and Advanced Control, School of Chemical Engineering, State University of Campinas PO Box 6066, 13083-970, Campinas - SP, Brazil.
Phone: +(55) (19) 3521-3958, E-mail: [email protected]
(Submitted: June 4, 2014 ; Revised: January 2, 2015 ; Accepted: January 2, 2015)
Abstract - An attractive operation strategy for the enzymatic hydrolysis of lignocellulosics results from dividing the process into three stages with complementary goals: continuous enzyme adsorption at low-solids loading (5% w/w) with recycling of the liquid phase; continuous liquefaction at high-solids content (up to 20% w/w); and, finally, continuous or semicontinuous hydrolysis with supplementation of fresh enzymes. This paper presents a detailed modeling and simulation framework for the aforementioned operation strategies. The limiting micromixing situations of macrofluid and microfluid are used to predict conversions. The adsorption and liquefaction stages are modeled as a continuous stirred tank and a plug flow reactor, respectively. Two alternatives for the third stage are studied: a train of five cascading stirred tanks and a battery of batch reactors in parallel. Simulation results show that glucose concentrations greater than 100 g L-1 could be reached with both of the alternatives for the third stage.
Keywords: Reactor, High-solids; Continuous; Semicontinuous; Micromixing; Recycling.
INTRODUCTION
Modeling and simulation of reaction systems for chemicals and fuels production from lignocellulosics is a useful approach for exploring process configura-tions. Previous studies have highlighted the
pretreated to increase the enzyme accessibility and improve the digestibility of cellulose. The pretreated material is then hydrolyzed in the presence of en-zymes to produce sugars, mainly glucose and xylose. Despite some success at the pilot and demonstration scales, many questions must be resolved before the full potential of the technology will be realized (Modenbach and Nokes, 2013). Given the availabil-ity of validated kinetic models for the enzymatic hydrolysis of lignocellulosics (Kadam et al., 2004; Zheng et al., 2009), it is convenient to model and simulate large-scale operation strategies to provide feedback on further experimental work and economi-cal assessment. This paper focuses on the enzymatic hydrolysis step and proposes continuous and semi-continuous systems which address two current con-cerns: increasing solids loading while maintaining conversion and reducing enzyme loading. These are central issues to develop an economically feasible process.
Enzymatic hydrolysis of lignocellulosics has been typically carried out at 5-8% w/w solids to ensure a proper contact with enzymes. However, solids load-ings higher than 10% w/w are required to obtain cost-effective concentrations of sugars (Wingren et al., 2003). Due to the high water-holding capacity of solids, the reaction medium cannot be efficiently sheared and mixed at solids loadings higher than 10% w/w (Viamajala et al., 2009). In addition, con-version at increasing solids loadings exhibits a gen-eral decreasing trend (Kristensen et al., 2009). On the other hand, enzymes cost has been pointed out as one of the major costs of the biochemical conversion (Newman et al., 2013). As a solid-liquid enzyme-catalyzed reaction, the reaction rate is directly related to adsorbed enzyme. Again, a negative correlation between solids loading and adsorbed enzyme has been observed (Kristensen et al., 2009).
An alternative to increase solids loading has been the fed-batch operation, where solids and/or enzymes are added at different times. The fed-batch operation enables operatation at solids loadings higher than 10% w/w while overcoming mixing constrains (Ros-gaard et al., 2007; Wanderley et al., 2013; Zhao et al., 2013) and allows sugar concentrations up to four times greater than those of the equivalent batch reac-tion (Gupta et al., 2012). Two to four addireac-tions of solids have been reported and enzymes are added either all at the beginning of the reaction or at each solids feeding event (Gonzalez Quiroga et al., 2010-1). Operating in the fed-batch mode offers additional advantages such as lower instantaneous solids con-centration and lower apparent viscosities, which could be beneficial for enzyme adsorption. Hodge et
al. (2009) developed and validated a model-based fed-batch strategy to maintain the solids concentra-tion at manageable levels during the course of the re-action and reached cumulative substrate concentrations of 25%. Following the work of Hodge et al. (2009), Morales-Rodriguez et al. (2010) and Cavalcanti-Montaño et al. (2013) presented optimized feedback control strategies that further improve the fed-batch operation by reducing the consumption of enzymes.
Several studies have focused on recycling strate-gies of free (not adsorbed) and adsorbed enzyme to reduce the consumption of the enzymes of the hy-drolysis step. Results have shown a fresh substrate conversion of 67% after three rounds of recycle of solid residue and ultrafiltration retentate of the super-natant without extra fresh enzyme, provided that the lignin content of solids on a dry basis is lower than 5% w/w and the cumulative solids concentration is lower than 3% w/w (Qi et al., 2011; Rahikainen et al., 2013). However, optimal process conditions are not necessarily identical in processes with and with-out enzyme recycling (Lindedam et al., 2013). Ouyang et al. (2013) employed the enzyme bound on residual substrate as a more effective method for recovery, although another experimental study pointed out that there is no actual accumulation of enzyme activity with solids recycling (Pihlajaniemi et al., 2014). Rodrigues et al. (2014) found that ultrafiltration on a lab scale allowed the recovery of free enzyme with a recovery of 80% and highlighted the thermal stabil-ity of enzymes as essential for recycling.
A recent experimental study on the laboratory scale demonstrated that adding enzymes at low-solids loading (5% w/w), followed by filtering the mixture after short retention times (10 min) and supplementing the thickened pulp (solids after thickening 20% w/w) with fresh enzymes, results in conversions compara-ble to those with low-solids loading and final sugar concentrations higher than 100 g L-1(Xue et al., 2012). This operation strategy proved to be effective in aspects directly related to the economic feasibility of the biochemical route: high solids loading, high conversion and efficient enzyme utilization. When solids loading increased from 5% to 20% w/w under a conventional operation, final conversions decreased by 30% (Xue et al., 2012), as has been pointed out in previous research (Kristensen et al., 2009).
conver-sion of cellulose and hemicelluloses to reducing sugars is achieved. During the liquefaction stage, a significant drop in the apparent viscosity of the reac-tion medium occurs. Sjoede et al. (2013) reported that the apparent viscosity dropped from 100,000 to 2 Pa.s when 10% w/w of alkaline sulfited bagasse was hydrolyzed at 50 °C during 2 h (the enzyme used was acellerase, but the enzymatic activity was not reported). The liquefaction stage has been repre-sented by a train of 2 or 3 cascading CSTRs (Con-tinuous Stirred Tank Reactors) with distributed feed-ing of substrate and enzyme, and either a downward flow or an upward flow tower-type PFR (Plug Flow Reactor). On the other hand, the long-time reten-tion/reaction stage has been represented by a battery of batch in parallel, a train of cascading CSTRs and a PFR (See Table 1). A train of cascading CSTRs with distributed feeding of substrate and enzyme seeks to translate the fed-batch operation into a continuous basis. A simulation study by Gonzalez Quiroga et al. (2010a) pointed out that continuous distributed feed-ing has the potential to increase solids loadfeed-ing from 5% to 20% w/w with a decline in conversion of 15% and an increase in final glucose concentration from 27 to 92 g L-1.
In this paper a previously developed and validated kinetic model (Zheng et al., 2009) and the limiting micromixing situations of microfluid and macrofluid
(Gonzalez Quiroga et al., 2010a, 2010b) are used to explore the capabilities of continuous and semicon-tinuous reaction systems. The kinetic model of Zheng et al. (2009) is a semi-mechanistic three-reac-tion kinetic model intended for optimizathree-reac-tion, eco-nomical evaluation and process design. There are more kinetic models particularly useful either for developing and testing understanding at the level of substrate features and multiple enzyme activities (Zhang and Lynd, 2004) or for scale-up, design and process optimization (Sousa et al., 2011; Carvalho et al., 2013). On the other hand, micromixing refers to the contact among fluid elements at the microscopic or molecular scales and is characterized by the dy-namic environment renovation around each mole-cule. The state of microfluid prevails if the incoming material immediately comes into intimate contact with other fluid elements of all ages at the molecular level as in an ideal CSTR. Conversely, the state of macrofluid is kept if the incoming material is broken up into discrete clumps in which elements of differ-ent ages do not intermix at all while in the reaction system, and reactions proceed independently in each fluid element. The following section presents the modeling framework, which includes a summary of the kinetic model, a detailed explanation of the opera-tion strategies and the descripopera-tion of the mathemati-cal models.
Table 1: Summary of proposed continuous and semicontinuous reaction systems for enzymatic hydrolysis of lignocellulosics.
PROCESS REACTORS CONFIGURATION REF
SHF
PFR followed by a train of three to twelve cascading CSTRs
Harlick and Zheng, 2011
PFR followed by two trains of three to twelve cascading CSTRs
Two PFR in parallel followed by a train of three to twelve cascading CSTRs
SHF
A train of three cascading CSTRs
Sjoede et al., 2013 A train of three cascading CSTRs with liquid phase recycling from the third to
the first reactor, enzyme supplementation at the second reactor and liquid phase withdrawing at the outlet of the first reactor
A train of three cascading CSTRs with distributed feeding of enzyme and distributed withdrawing of liquid phase
SHF
A train of ten cascading CSTRs or a PFR, both with and without recycle Gonzalez Quiroga, 2009; Gonzalez Quiroga et al., 2010a, 2010b A train of ten cascading CSTRs with distributed feeding of substrate and
enzyme at the first two or three reactors
A train of three cascading CSTRs with distributed feeding of substrate and enzyme at the first two or three reactors, followed by a PFR
SSF Three trains of six cascading CSTRs Wooley et al.,
1999
SHF Train of five cascading CSTRs Aden et al.,
2002
SHF Tower type PFR (downward flow) followed by twelve batch in parallel Humbird et al., 2011
SSF Train of four STRs with intermittent feeding Shao et al.,
MODELING FRAMEWORK
Kinetic Model
The model is made up of two heterogeneous reac-tions for the breakdown of cellulose into cellobiose (G2) and glucose (G), and a homogeneous reaction for the breakdown of G2 into G. The multi-enzyme system is quantitatively represented by two enzyme concentrations, endoglucanase/cellobiohydrolase (EG/CBH), which catalyze the heterogeneous reac-tions, and β-glucosidase (BG), which catalyze the ho-mogeneous reaction. The model incorporates EG/CBH adsorption on C and lignin (L), and BG adsorption on L. Due to the adsorption of EG/CBH on both cellu-lose and lignin, the amount of EG/CBH adsorbed on cellulose is calculated as “EG/CBH adsorbed on substrate – EG/CBH adsorbed on lignin”. In addition, the kinetic model takes into account competitive in-hibition of EG/CBH and BG by G2 and G, and sub-strate reactivity (Zheng et al., 2009). Subsub-strate reac-tivity is a parameter that lumps the change of sub-strate structural features like crystallinity, degree of polymerization, accessibility to enzymes, etc.
The pretreated substrate (creeping wild ryegrass pretreated with dilute sulfuric acid) was composed of 53% w/w C and 38% w/w L on a dry basis. The model was fitted and validated under solids loadings from 4 to 12% w/w, EG/CBH loadings from 15 to 150 FPU(g C)-1, BG loadings from 15 to 150 CBU(g C)-1, background G2 of 10 g L-1 and background G of 30 and 60 g L-1.
Mass balances on C, G2, G, EG/CBH and BG were established as follow:
1 2
dC
r r
dt (1)
2
1 3
1.056 dG
r r
dt (2)
2 3
1.1116 1.053 dG
r r
dt (3)
1T 1f 1b
E E E (4)
2T 2f 2b
E E E (5)
where:
r1: heterogeneous reaction rate (C to G2) r2: heterogeneous reaction rate (C to G) r3: homogeneous reaction rate (G2 to G) t: elapsed time
E1: EG/CBH E2: BG
f: free enzyme in solution b: bound enzyme
The kinetic rate equations r1, r2 and r3 have been reported by Zheng et al. (2009). The quantities 1.056, 1.1116 and 1.053 stem from the differences in molecular weights between glucose, cellobiose and the equivalent monomer of cellulose.
Operation Strategies
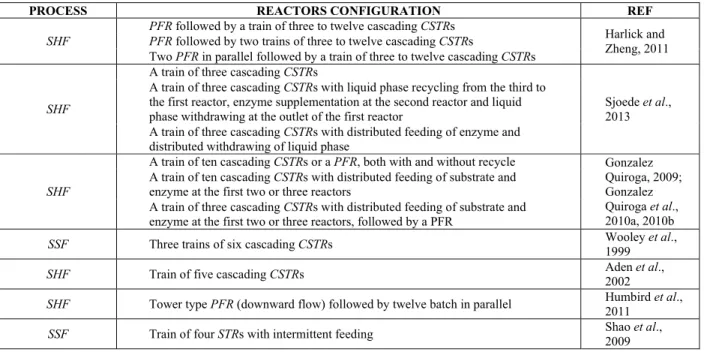
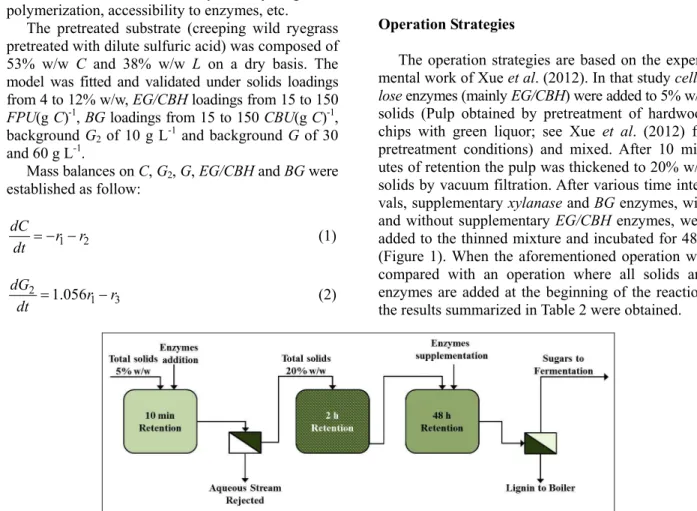
The operation strategies are based on the experi-mental work of Xue et al. (2012). In that study cellu-lose enzymes (mainly EG/CBH) were added to 5% w/w solids (Pulp obtained by pretreatment of hardwood chips with green liquor; see Xue et al. (2012) for pretreatment conditions) and mixed. After 10 min-utes of retention the pulp was thickened to 20% w/w solids by vacuum filtration. After various time inter-vals, supplementary xylanase and BG enzymes, with and without supplementary EG/CBH enzymes, were added to the thinned mixture and incubated for 48 h (Figure 1). When the aforementioned operation was compared with an operation where all solids and enzymes are added at the beginning of the reaction, the results summarized in Table 2 were obtained.
Table 2: Sugar yields and sugar concentrations for the schemes evaluated by Xue et al. (2012). Cellulase loading 20 FPU(g-substrate*)-1 and total reaction time 50 h.
Operation procedure Yield
%
Sugars concentration [g L-1] 1) 5% w/w solids and all the enzymes added at the beginning 64 26 2) 20% w/w solids and all the enzymes added at the beginning 44 84 3) All substrate and cellulase added at the beginning. Slurry thickened to 20% w/w
after 10 min. Xylanase and BG supplemented after 8 h 59 114
4) All substrate and part of the cellulase added at the beginning. Slurry thickened to
20% w/w after 10 min. Cellulase, xylanase and BG supplemented after 2 h 63 121 *
Glucan 61.1%; Xylan 15.0%; Acid insoluble L 20.0% and Acid soluble L 2.9%. % w/w on a dry basis
According to the study of Xue et al. (2012) the key for increasing solids content while maintaining con-version is to mix a fraction of EG/CBH enzymes at low-solids loading, thicken to high-solids content, and allow the adsorbed EG/CBH enzymes to perform the liquefaction. After the liquefaction process there is an abundant continuous liquid phase, which en-ables a thorough mixing of supplementary enzymes in the heterogeneous system. Instead of operating under the two subsystems concept summarized in Table 1 (liquefaction at high-solids loading followed by long-time retention/reaction), the results of Xue et al. (2012) suggest a three subsystems approach: (1) adsorption at low-solids loading, (2) liquefaction and (3) long-time retention/reaction.
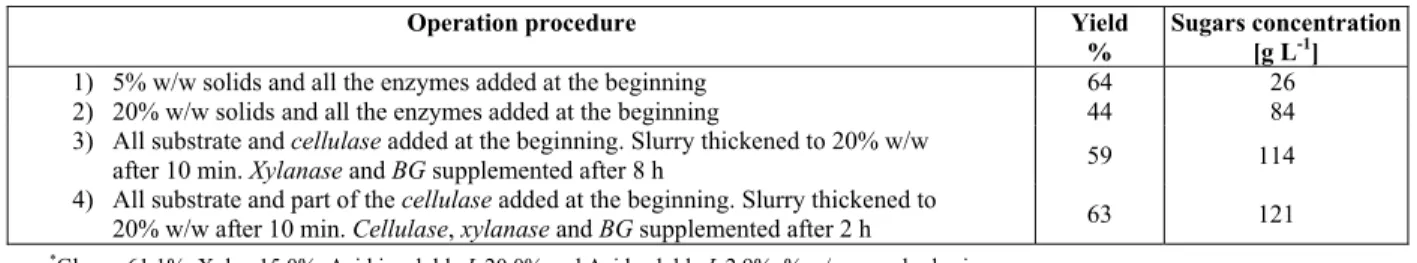
The current operation strategies seek to translate the Xue et al. (2012) bench-scale experiment into a continuous or semicontinuous operation at a model-ing and simulation level. Additional considerations are the recycling of the liquid phase and an alterna-tive for enzyme supplementation (Figure 2). The simulation assumes that pretreated solids and en-zymes (EG/CBH or EG/CBH+BG) are continuously mixed at low-solids loading (5% w/w) in a well-stirred tank called Adsorber-Reactor (AR) with a mean retention time (τAR) of 0.2 h. The purpose of the AR is to provide an environment with abundant free aqueous phase favorable to enzyme adsorption. The stream leaving the AR contains water-swollen partially depolymerized solids with adsorbed enzyme and liquid phase with dissolved G2, G and free en-zymes. After pressing in a Mechanical Separator (MS), the liquid phase with dissolved G2, G and en-zymes is recycled to the AR and the thickened pulp is liquefied in a tower-type plug flow reactor (PFR) with a mean retention time (τP) of 2 h. The recycle ratio (RR) relates the volumetric flow sent back to the AR and the volumetric flow sent to the PFR. Finally, the liquefied slurry is conveyed to a train of cascading continuous stirred tank reactors (CSTRs) where additional enzymes (EG/CBH or EG/CBH+BG) are supplemented in the first reactor (Figure 2(a)), or
a battery of batch reactors in parallel where addi-tional enzymes are supplemented in each reactor (Figure 2(b)). The battery of batch in parallel was proposed in the last NREL (National Renewable Energy Laboratory) technical report (Humbird et al., 2011).
Reactor Modeling
The following general assumptions were neces-sary for modeling: isothermal reactors, steady state, well mixed tanks in the macroscopic sense, plug flow in the tower-type reactor and simultaneous ad-sorption/reaction in the AR. To study the effect of thickening after enzyme adsorption, the concentra-tion of solids after thickening (SAT) ranged from 5 to 20% w/w. A train of five cascading CSTRs was con-sidered to explore the performance of the continuous system. Residence times per reactor (τR) along the cascade of equal size CSTRs ranged from 10 h to 50 h. Incubation times up to 180 h were simulated for the battery of batch in parallel.
The limiting micromixing situations of microfluid and macrofluid were used for predicting conversion (Gonzalez Quiroga et al., 2010a, 2010b). For the en-zymatic hydrolysis of lignocellulosics, a micromix-ing behavior close to macrofluid was found in a CSTR for the residence times required to achieve cellulose conversions from 0.50 to 0.85 (South et al., 1995). A gradual evolution from macrofluid to microfluid may be expected as the solids structure collapses and the apparent viscosity of the slurry decreases.
(a)
(b)
Figure 2: Schemes of the reaction systems proposed. Enzyme adsorption, thick-ening and liquid phase recycling, followed by a tower-type plug flow reactor and: (a) a train of cascading continuous stirred reactors, or (b) a battery of batch reac-tors in parallel.
Macrofluid Model
For a well-mixed train of cascading CSTRs, the residence time distribution (RTD) function E is given by (Levenspiel, 1999):
( 1)
exp ( 1)!
nr nr
t t
E nr
(6)
where t is the reaction time, nr the number of reac-tors and τ the residence time per reactor. The RTD function at the outlet of the AR (EAR) is given by:
1 exp
AR
AR AR
t E
(7)
The RTD function at the outlet of CSTR i of the cascade (Ei) is given by:
( 1)
exp ( 1)!
i
i nr
i nr
R
i R
t t
E nr
(8)
where nri is the CSTR i of the cascade.
C, G2 and G concentrations at the outlet of reactor i (Ci, G2i and Gi, respectively) are expressed in terms
of the kinetic model and the corresponding RTD functions as follows:
0
t
i i
C
CE dt (9)2 2
0
t
i i
G
G E dt (10)0
t
i i
Note that C, G2 and G on the right side of
Equa-tions (9), (10), and (11) are the time-dependent con-centrations of cellulose, cellobiose and glucose that are predicted by the kinetic model. On the other hand, Ci, G2i and Gi are the predicted concentrations of
cel-lulose, cellobiose and glucose at the outlet of the reactor i, which are discrete values and depend on both the kinetic model and the corresponding RTD.
Each RTD function was numerically evaluated, and the maximal value of Δt (Δt≈dt) that guarantees a minimal value of 0.9999 for each RTD time integral was used for the numerical evaluation of Equations (9) to (11). The numerical values of C, G2 and G for evaluating Equations (9) to (11) were obtained by numerical integration of the linear differential equa-tion system represented by Equaequa-tions (1) to (3).
Microfluid Model
For CSTR i in the cascade, mass balances on C, G2 and G are expressed respectively as follows:
1 (1 2) 0
i i R
C C r r (12)
2 1i 2i R(1.0561 3) 0
G G r r (13)
1 (1.11162 1.053 )3 0
i i R
G G r r (14)
Batch Model
For a batch reactor, the mass balances of C, G2 and G are expressed in the integral form as follows:
1 2
0( )
t
C
r r dt (15)2 1 3
0
(1.056 )
t
G
r r dt (16)2 3
0
(1.1116 1.053 )
t
G
r r dt (17)PFR Model
Roche et al. (2009) found that the intrinsic solids density throughout the enzymatic hydrolysis of lig-nocellulosics is constant at 1400 g L-1. Hodge et al. (2009) reported a correlation for the density of the liquid phase which includes the concentration of sugars. According with these findings the calculated density of the slurry at the beginning of the liquefac-tion stage is 1080 g L-1and the density of the slurry at the end of the liquefaction results in 1074 g L-1. Constant density of the slurry in the PFR was
as-sumed so the reactor is described by the same set of equations of the batch model (Equations (15)-(17)), where t in the batch is equivalent to τP in the PFR. The numerical solution of the three models was ob-tained by means of Compaq Visual Fortran® 6.6.
RESULTS AND DISCUSSION
Results in Figures 3-7 show that, for a given resi-dence time, cellulose conversion (XC) and G concen-trations predicted by the macrofluid model are greater than those predicted by the microfluid model. As expected, the predictions of both micromixing models, macrofluid and microfluid, get closer to each other as the residence time increases. The dif-ferences between the predictions are significant along the train of cascading CSTRs. In the first reac-tor of the cascade, experimental evidence suggests a micromixing behavior close to macrofluid (South et al., 1995). For intermediate reactors, a gradual evo-lution from macrofluid to microfluid may be ex-pected as the solids structure collapses, releasing liquid phase, and the apparent viscosity of the slurry decreases. The current study assumes ideal flow patterns; however, to take further advantage of the micromixing models the real RTD of the reaction systems must be obtained.
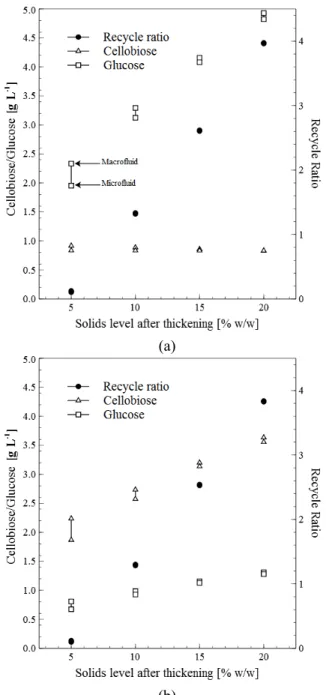
Figure 3 shows the RR, G2 and G concentrations at the outlet of the AR as a function of SAT. At this point, a peak of adsorption of BG/CBH enzymes on cellulose and lignin is expected. Without BG addi-tion, the results show a fast release of G2 and a slow release of G (Figure 3(a)). If BG is simultaneously added, a peak of adsorption of BG on lignin and a sig-nificant breakdown of G2 into G is expected (Figure 3(b)). No significant differences were found for RR with and without BG addition in the AR. The adsorp-tion model assumes that EG/CBH enzymes adsorb not only on cellulose, but also on lignin, and BG adsorbs on lignin (Zheng et al., 2009). Enzyme adsorbs on the surface of the substrate, occupying some of the sites available, and only enzyme adsorbed on cellulose is able to catalyze the heterogeneous reactions.
According to Xue et al. (2012), to prevent BG losses by unproductive adsorption on lignin it should be added after the liquefaction stage. However, the sites on the surface of lignin that would be occupied by BG are likely to be occupied by CBH, leading to unproductive adsorption in any case. It has also been reported that BG adsorption on lignin depends on the type of BG enzyme and that this adsorption is not always unproductive (Haven et al., 2013). Besides, additives such as bovine albumin and ethylenglycol can partially prevent the adsorption of BG on lignin (Haven et al., 2013). Further experimental results are needed to assess the optimal location for BG addi-tion, so in this work the addition of BG in the AR is also considered.
After leaving the AR there is a mechanical separa-tion from which part of the liquid phase is recycled to the AR and the thickened solids with part of the liquid phase are conveyed to the tower-type PFR. As the main residence time in the AR was fixed for any RR, its volume is not constant but varies proportion-ally to (1+RR). By recycling liquid hydrolysate from the reaction medium of longer reaction times, signifi-cant concentrations of enzyme inhibitors (G2 and G) are recirculated. The inhibitory effect of G2 and G could be partially alleviated by recycling at early retention times. In the batch laboratory experiments reported by Xue et al. (2012), the retention time for enzyme adsorption was set as 0.17 h and the liquid stream with dissolved sugars and cellulose enzymes leaving the mechanical separation was rejected. The current work suggests recycling this stream to avoid sugar or enzyme losses even at greater retention times in the AR. Further research should be done to set the mean residence time in the AR because mix-ing times are strongly dependent on solids loadmix-ing and AR volume.
(a)
(b)
Figure 3: G2, G and RR at the outlet of the AR as a function of the solids level after thickening. (a) EG/CBH 7.5 FPU(g-substrate)-1 + BG 15 CBU(g-substrate)-1. (b) EG/CBH 7.5 FPU(g-substrate)-1.
16 g L-1 could be considered too high. This result provides further support for operating with BG addi-tion in the AR, which resulted in a G2 peak of 3.3 g L-1. By operating with split addition of BG, a G2 peak between 3.3 and 16 gl-1 would be expected, so the G2 peak could be a good indicator for adjusting the loading of BG.
(a)
(b)
Figure 4: G2 profiles with and without BG addition in the AR and a solids level after thickening of 20% w/w. (a) Continuous reaction system with τR=30 h; (b) Semicontinuous reaction system.
For a train of cascading CSTRs with a mean resi-dence time of 30 h, there were no significant differ-ences in G2 concentrations between the cases with
and without BG from the second reactor of the cas-cade, and G2 concentrations below 1 gl-1 were ob-tained at the outlet of the third reactor. Similar results were observed for the battery of batch in parallel after 10 and 60 h of reaction, respectively.
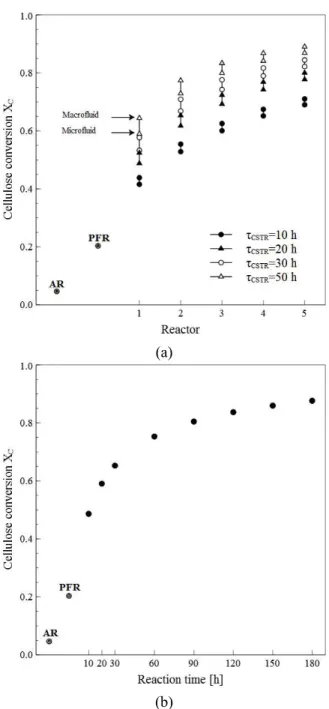
Cellulose conversions for the reaction systems are depicted in Figure 5. Note that these results apply for the pretreated substrate (creeping wild ryegrass pre-treated with dilute sulfuric acid) used for fitting the kinetic model.
(a)
(b)
Differences in solids type and pretreatment proc-ess could lead to significant differences in both final conversions and conversion profiles. However, the modeling and simulation framework presented here remains useful even if a more detailed kinetic model were to be used. For the train of five cascading CSTRs it is manifest that a τR of 10 h is insufficient to reach conversions greater than 0.7. Values of τR between 20 and 30 h seems to offer a balance be-tween conversion and residence time. A cellulose conversion of 0.8 could be reached after 80 h in the battery of batch in parallel; similar conversions could be attained in a train of 4 cascading CSTRs with a mean residence time per reactor of 30 h.
The last NREL technical report (Humbird et al., 2011) assumes a PFR with a residence time of 24 h followed by a battery of batch in parallel with a re-tention time of 60 h to reach a final cellulose conver-sion of 0.9. From Figure 5 it is evident that, for the current pretreated substrate and enzyme loadings, such conversion could not be attained even in a batch with reaction times greater than 150 h. Conversions greater than 0.8 could lead to prohibitive residence or reaction times, but from an economical point of view a minimal G concentration at the outlet of the enzymatic hydrolysis stage has to be guaranteed.
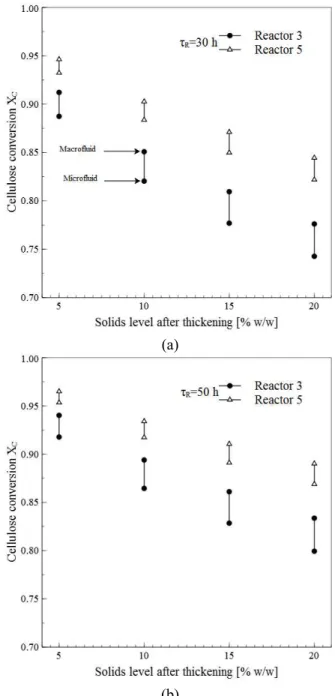
According to the results of Xue et al. (2012), one of the main features of the current reaction systems would be a significant increase in solids loading with final conversions similar to those achieved at low-solids loading. As an initial low-solids loading of 20% w/w falls outside of the experimental validation interval, it is not possible to obtain results for an operation under such initial conditions. Figure 6 shows the ef-fect of SAT on cellulose conversion for the continuous system at the outlets of the third and fifth reactors of the cascade. An operation with SAT=20% w/w and τR=30 h showed reductions in conversion of 19% and 13% in the third and fifth reactor when compared with an operation with SAT=5% w/w (Figure 6(a)). Likewise, an operation with τR=50 h showed reduc-tions in conversion of 14% and 9% in the third and fifth reactor. Contrary to the expectations raised by the experimental work of Xue et al. (2012), there are substantial differences between conversions at increas-ing SAT, although the differences tend to be less sig-nificant at greater retention/reaction times (> 150 h).
There are a number of reasons for the results of Figures 6 and 7. First of all, the substrate and the pretreatment process of the study of Xue et al. (2012) and those of the kinetic model (Zheng et al., 2009) used here are different. Also, the EG/CBH loading used for Xue et al. (2012) was 20 FPU(g-substrate)-1, whereas the one set in the current study
was 15 FPU(g-substrate)-1. Enzyme loading has a significant and complex impact on process econom-ics and a conservative value was preferred. Deter-mining an economical enzyme loading requires the optimization of various parameters (such as tempera-ture, solids loading, residence/retention time, etc.) which is beyond the purposes of the current study.
(a)
(b)
Figure 6: Effect of the solids level after thickening on cellulose conversion for the continuous system. (a) τR=30 h and (b) τR=50 h.
those of 5% w/w. Finally, Xue et al. (2012) supple-mented xylanase enzymes after liquefaction, but their action is not included in the current kinetic model. It is important to highlight that, when a solid loading of 20% w/w was added all at once (procedure 2 of Table 1), a reduction of 43% in sugar yield was ob-served when compared with the operation with split addition of enzyme (Procedure 4 of Table 1). In this sense, a continuous or semicontinuous operation with split addition of enzyme as proposed here offers advantages in terms of cellulose conversion.
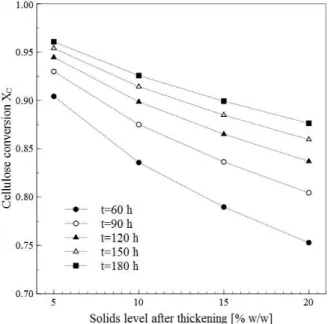
Figure 7: Effect of the solids level after thickening on cellulose conversion for the semicontinuous sys-tem at different reaction times.
A critical economical issue for the enzymatic hy-drolysis of lignocellulosic biomass is the final glu-cose concentration. It has been stated that the ethanol concentration in the broth entering distillation should be greater than 40 g L-1 (Wingren et al., 2003). As-suming an ethanol yield of 0.48 g(g G)-1, a G con-centration of at least 83 g L-1 would be required to reach this target. G concentrations in Figure 8 were calculated as the average between the macrofluid and the microfluid model predictions. Figure 8(a) shows that, depending on τR, cascades with different num-bers of CSTRs fit the aforementioned cutoff. For instance, with τR=10 h it is not possible to attain a G concentration of 83 g L-1, whereas with τR=30 h 2 CSTRs are required. On the other hand, reaction times of 60 h are enough for attaining the mentioned G concentration in the semicontinuous system (Figure 8(b), see the dotted line for the abovementioned cutoff in glucose concentration).
(a)
(b)
Figure 8: Glucose concentrations for a solid level after thickening of 20% w/w. (a) Continuous and (b) semicontinuous reaction system.
experimentally. The split addition of enzymes im-plies enzyme adsorption on a partially hydrolyzed substrate in the presence of significant G and G2 concentrations. Adsorption isotherms under these conditions should be obtained to improve the calcu-lation of adsorbed enzyme after the PFR. Secondly, it would be desirable to include xylanase adsorption, xylan hydrolysis and enzyme inhibition by xylose in the kinetic model. Finally, the kinetic model used in this work accounts for substrate reactivity; however, enzyme deactivation is not taken into account. The kinetic model accounts for the adsorption of BG/CBG on C and L, which is a unique feature among the pub-lished models; a global adsorbed enzyme deactivation rate could further improve the predictions.
While the results of the present simulation study are encouraging, the experimental validation is cru-cial. A recent bench-scale study (Brethauer et al., 2014) reports the continuous simultaneous sacchari-fication and fermentation of dilute acid-pretreated corn stover (2% w/w) in a train of three agitated vessels. Productivity at identical total residence times was 12% higher for operation with 3 CSTRs than for a single CSTR. To our best knowledge this study is the first step towards the validation of con-tinuous operation strategies like the one presented in this paper. Brethauer et al. (2014) concluded that the simulation results in one of our previous papers (González Quiroga et al., 2010a) pointed in the same direction as their experimental results. On the other hand, the work of Xue et al. (2009) supports the importance of the liquefaction stage, although ex-perimental studies on the liquefaction of the thick-ened slurry in a PFR should be carried out.
To validate the modeling framework and the pro-posed operation strategy, the experimental work on enzyme adsorption at low solids loading should be continuous and with recycle of hydrolysate. The substrate concentration should be kept at 5% w/w by adjusting the feeding rate of fresh substrate. For ferent residence times in the AR, which imply dif-ferent recycle ratios and reaction volumes in the AR, the effect of enzyme loading, split addition of en-zymes and enzyme inhibition by final product could be clarified. While the optimization of enzyme load-ing and enzyme feedload-ing mode are the most important results, the feasibility of operating with recycle ratios higher than 3.5 needs to be proved. For these adsorp-tion experiments the EG/CBH loading should vary between 5 to 15 FPU(g-substrate)-1, while BG should be either absent or at a loading of 15 CBU(g-substrate)-1. Note that enzymes would be supplemented after the liquefaction stage to final equivalent loadings between 10 to 30 FPU(g-substrate)-1 and 15 CBU(g-substrate)-1.
Experimental research is essential to set the resi-dence time of the material in the liquefaction stage. The most important variable in this stage is the mini-mum apparent viscosity of the material that allows mixing in conventional tanks. The interested reader is referred to Humbird et al. (2011) for the technical aspects of the measurement of apparent viscosity of the slurry. As previously stated, the residence time of this stage is strongly dependent on the enzyme load-ing, the efficiency of the previous adsorption stage, the nature of the substrate and the pretreatment method. For these liquefaction experiments, the EG/CBH and BG loadings vary according to the setting of the previous adsorption stage. A semi-em-pirical correlation between conversion, insoluble solids concentration, yield stress and apparent vis-cosity in the liquefaction stage is essential to connect kinetics and rheology, which allow controlling the operation. Regarding this last aspect, the work of Hodge et al. (2009) constitutes a good starting point for planning the experimentation.
A question that remains is whether to use ous or semicontinuous operation. In general, continu-ous processing is the preferred mode of operation for the production of commodity chemicals because of reduced labor cost, improved process control and uniform product quality. On the other hand, a semi-continuous operation provides for greater flexibility and lower investment costs, and could be preferred for pilot plant research (Peters et al., 2003). As reac-tion systems are constrained by the required reacreac-tion volumes, a compromise between solids loading, con-version and final glucose concentration of the system has to be sought. This compromise could imply that the conversions greater than 0.85 assumed in previ-ous economic evaluations of the technology (Hum-bird et al., 2011) are not realistic.
CONCLUSIONS
The current modeling and simulation frame-work remains useful even if a more detailed kinetic model is to be used. Differences in raw material and/or the pretreatment process imply the fitting of the cur-rent kinetic model with the new set of experimental data.
Experimental work is essential to elucidate rele-vant aspects such as reutilization of recycle enzyme by readsorption on fresh substrate and BG addition in the adsorption stage. Future kinetic models should incorporate xylanase adsorption, xylan hydrolysis and a global adsorbed enzyme deactivation rate.
For detailed design purposes it is imperative to link kinetics and rheology. Semi-empirical relations to connect the progress of the enzymatic hydrolysis with insoluble solids concentration and yield stress should be developed. Besides, the RTD of the reac-tion systems, especially for the PFR, are required to take further advantage of the micromixing models.
The current simulation framework can be ex-tended from SHF to SSF.
NOMENCLATURE
AR Adsorber-Reactor BG - glucosidase enzyme C Cellulose [g L-1]
CBH Cellobiohydrolase enzyme CBU Cellobiase Unit
CSTR Continuous Stirred Tank Reactor E Residence time distribution function E1 EG/CBH [g-protein.L-1]
E2 BG [g-protein.L-1] EG Endoglucanase enzyme FPU Filter Paper Unit G Glucose [g L-1] G2 Cellobiose [g L-1] L Lignin [g L-1] MS Mechanical Separator Nr Number of reactors
NREL National Renewable Energy Laboratory PFR Plug Flow Reactor
r1 Heterogeneous reaction rate (C to G2) [g h-1] r2 Heterogeneous reaction rate (C to G) [g h-1] r3 Homogeneous reaction rate (G2 to G) [g h-1] RR Recycle ratio
RTD Residence Time Distribution S Solids [% w/w]
SHF Separated Hydrolysis and Fermentation
SSF Simultaneous Saccharification and Fermentation
STR Stirred Tank Reactor t Elapsed time [s] X Conversion
Greek Symbols
A variety of glucosidase enzyme
Change
Residence time [h]
Subscripts
AT After thickening B Bound
F Free (in solution)
I Identifier of CSTR i in the cascade P PFR reactor
R CSTR reactor T Total
REFERENCES
Aden, A., Ruth, M., Ibsen, K., Jechura, J., Neeves, K., Sheehan, J. and Wallace, B., Lignocellulosic biomass to ethanol process design and economics utilizing co-current dilute acid prehydrolysis and enzymatic hydrolysis for corn stover. No. NREL/ TP-510-32438 (2002).
Borchert, A. and Buchholz, K., Enzymatic hydrolysis of cellulosic materials. Process Biochem., 22, 173-180 (1987).
Brethauer, S., Studer, M. H. and Wyman, C. E., Ap-plication of a slurry feeder to 1 and 3 stage con-tinuous simultaneous saccharification and fer-mentation of dilute acid pretreated corn stover. Bioresource Technol., 170, 470-476 (2014). Carvalho, M. L., Sousa Jr. R., Rodríguez-Zúñiga, U.
F., Suarez, C. A. G., Rodrigues, D. S., Giordano, R. C. and Giordano, R. L. C., Kinetic study of the enzymatic hydrolysis of sugarcane bagasse. Braz. J. Chem. Eng., 30(3), 437-447 (2013).
Cavalcanti-Montano, I. D., Suarez, C. A. G., Rodríguez-Zúñiga, U. F., Giordano, R. L. C., Giordano, R. C. and Sousa Jr. R., Optimal bioreactor operational policies for the enzymatic hydrolysis of sugarcane bagasse. Bioenerg. Res., 6(2), 776-785 (2013). Gonzalez Quiroga, A., Costa, A. and Maciel Filho,
R., Analysis of conversion and operation strate-gies for enzymatic hydrolysis of lignocellulosic biomass in a series of CSTRs with distributed feeding. Bioprocess. Biosyst. Eng., 33, 901-910 (2010a).
Gonzalez Quiroga, A., Costa, A. and Maciel Filho, R., Modelamiento y simulación de una serie de CSTR's con alimentación distribuida para la hidró-lisis enzimática de bagazo de caña. Revista ION, 23(1), 13-19 (2010b). (In Spanish).
Gonzalez Quiroga, A., Martínez, E. L., Costa, A. C. and Maciel Filho, R., A computational fluid dy-namic study on the behaviour of sugarcane ba-gasse suspension in pipe and baffled pipe. pp. 161-168. In: Méndez-Vilas (Eds). Materials and Processes for Energy: Communicating Current Research and Technological Developments. For-matex Research Center (2013).
Gupta, R., Kumar, S., Gomes, J. and Kuhad, R. C., Kinetic study of batch and fed-batch enzymatic saccharification of pretreated substrate and subse-quent fermentation to ethanol. Biotechnol. Biofu-els, 5, 16 (2012).
Haven, M. Ø. and Jørgensen, H., Adsorption of β -glucosidases in two commercial preparations onto pretreated biomass and lignin. Biotech. Biofuels, 6(1), 165-179 (2013).
Harlick, P. J. and Zheng, W., Process for improving the hydrolysis of cellulose in high consistency sys-tems. U.S. Patent Application, 13/216,368 (2011). Hodge, D. B., Karim, M. N., Schell, D. J. and
McMillan, J. D., Model-based fed-batch for high-solids enzymatic cellulose hydrolysis. Appl. Bio-chem. Biotechnol., 152, 88-107 (2009).
Humbird, D., Davis, R. and Tao, L., Process design and economics for biochemical conversion of lig-nocellulosic biomass to ethanol. Nº NREL/TP-5100-47764 (2011).
Idrees, M., Adnan, A., Bokhari, A. and Qureshi, F. A., Production of fermentable sugars by com-bined chemo-enzymatic hydrolysis of cellulosic material for bioethanol production. Braz. J. Chem. Eng., 31(2), 355-363 (2014).
Jørgensen, H., Kristensen, J. B. and Felby, C., Enzy-matic conversion of lignocellulose into ferment-able sugars: Challenges and opportunities. Biofu-els Bioprod. Biorefin., 1(2), 119-134 (2007). Kadam, K. L., Rydholm, E. C., McMillan, J. D.,
Development and validation of a kinetic model for enzymatic saccharification of lignocellulosic biomass. Biotechnol. Prog., 20(3), 698-705 (2004).
Kristensen, J. B., Felby, C. and Jørgensen H., Deter-mining yields in high solids enzymatic hydrolysis of biomass. Appl. Biochem. Biotechnol., 156(1-3), 127-132 (2009).
Levenspiel, O., Chemical Reaction Engineering. 3rd Ed., pp. 257-261, Wiley, NY USA (1999).
Lindedam, J., Østergaard Haven, M., Chylenski, P., Jørgensen, H. and Felby, C., Recycling cellulases for cellulosic ethanol production at industrial rele-vant conditions: Potential and temperature depend-ency at high solid processes. Bioresource Technol., 148, 180-188 (2013).
Martínez, E. L., Gonzalez Quiroga, A., Jardini, A. L. and Maciel Filho, R., Computational fluid dy-namics simulation of the water–sugar cane bagasse suspension in pipe with internal static mixer. Comp. Aided. Chem. Eng., 26, 683-688 (2009). Modenbach, A. A. and Nokes, S. E., Enzymatic
hy-drolysis of biomass at high-solids loadings – A review. Biomass Bioenergy, 56, 526-544 (2013). Mora, S. and Banerjee, S., Economics of the
hy-drolysis of cellulosic sludge to glucose. Bioprocess Biosyst. Eng., 36(8), 1039-1042 (2013).
Morales-Rodríguez, R., Capron, M., Huusom, J. K. and Sin, G., Controlled fed-batch operation for improving cellulose hydrolysis in 2G bioethanol production. In: 20th Eur. Symp. Comput. Aided Process Eng., ESCAPE20 (2010).
Newman, R. H., Vaidya, A. A., Imroz Sohel, M. and Jack, M. W., Optimizing the enzyme loading and incubation time in enzymatic hydrolysis of ligno-cellulosic substrates. Bioresource Technol., 129, 33-38 (2013).
Ouyang, J., Liu, B., Zhang, M., Zheng, Z. and Yu, H., Enzymatic hydrolysis, adsorption, and recy-cling during hydrolysis of bagasse sulfite pulp. Bioresource Technol., 146, 288-293 (2013). Peters, M. S., Timmerhaus, K. D. and West, R. E.,
Plant Design and Economics for Chemical Engi-neers. 5th Ed., New York, McGraw-Hill (2003). Pihlajaniemi, V., Sipponen, S., Sipponen, M. H.,
Pastinen, O. and Laakso, S., Enzymatic sacchari-fication of pretreated wheat straw: Comparison of solids-recycling, sequential hydrolysis and batch hydrolysis. Bioresource Technol., 153, 15-22 (2014).
Qi, B., Chen, X., Su, Y. and Wan, Y., Enzyme adsorption and recycling during hydrolysis of wheat straw lignocellulose. Bioresource Technol., 102(3), 2881-2889 (2011).
Rahikainen, J. L., Martin-Sampedro, R., Heikkinen, H., Rovio, S., Marjamaa, K., Tamminen, T., Rojas, O. J. and Kruus, K., Inhibitory effect of lignin during cellulose bioconversion: The effect of lig-nin chemistry on non-productive enzyme adsorp-tion. Bioresource Technol., 133, 270-278 (2013). Roche, C. M., Dibble, C. J., Knutsen, J. S., Stickel, J.
J. and Liberatore, M. W., Particle concentration and yield stress of biomass slurries during enzy-matic hydrolysis at high-solids loadings. Biotech-nol. Bioeng., 104(2), 290-300 (2009).
Shao, X., Lynd, L., Wyman, C. and Bakker, A., Ki-netic modeling of cellulosic biomass to ethanol via simultaneous saccharification and fermenta-tion: Part I. Accommodation of intermittent feed-ing and analysis of staged reactors. Biotechnol. Bioeng., 102(1), 59-65 (2009).
Sjoede, A., Froelander, A., Lersch, M., Roedsrud, G., Hals, K. and Kloeften, A., Lignocellulosic biomass conversion. U.S. Patent No. 20,130,217,074 (2013). Sousa Jr, R., Carvalho, M. L., Giordano, R. L. C. and
Giordano, R. C., Recent trends in the modeling of cellulose hydrolysis. Braz. J. Chem. Eng., 28(4), 545-564 (2011).
South, C. R., Hogsett, D. A. L. and Lynd, L. R., Mod-eling simultaneous saccharification and fermenta-tion of lignocellulose to ethanol in batch and con-tinuous reactors. Enzyme Microb. Technol., 17(9), 797-803 (1995).
Rosgaard, L., Andric, P., Dam-Johansen, K., Peder-sen, S. and Meyer, A. S., Effects of substrate load-ing on enzymatic hydrolysis and viscosity of pre-treated barley straw. Appl. Biochem. Biotechnol., 143(1), 27-40 (2007).
Viamajala, S., McMillan, J. D., Schell, D. J. and Elander R. T., Rheology of corn stover slurries at high solids concentrations–effects of saccharifica-tion and particle size. Bioresour. Technol., 100(2), 925-934 (2009).
Wanderley, M. C., Martín, C., Rocha, G. J. M. and Gouveia, E. R., Increase in ethanol production from sugarcane bagasse based on combined
pre-treatments and fed-batch enzymatic hydrolysis. Bioresource Technol., 128, 448-453 (2013). Wingren, A., Galbe, M. and Zacchi, G.,
Techno-eco-nomic evaluation of producing ethanol from soft-wood: Comparison of SSF and SHF and identifi-cation of bottlenecks. Biotechnol. Prog., 19(4), 1109-1117 (2003).
Wooley, R., Ruth, M., Sheehan, J., Ibsen, K., Majdeski, H. and Galvez A., Lignocellulosic biomass to etha-nol process design and economics utilizing co-current dilute acid prehydrolysis and enzymatic hydrolysis current and futuristic scenarios. No. NREL/TP-580-26157 (1999).
Xue, Y., Jameel, H., Phillips, R. and Chang, H. M., Split addition of enzymes in enzymatic hydrolysis at high solids concentration to increase sugar con-centration for bioethanol production. J. Ind. Eng. Chem., 18(2), 707-714 (2012).
Zhang, Y. H. P. and Lynd, L. R., Toward an aggre-gated understanding of enzymatic hydrolysis of cellulose: Noncomplexed cellulase systems. Bio-technol. Bioeng., 88(7), 797-824 (2004).
Zhao, X., Dong, L., Chen, L. and Liu, D., Batch and multi-step fed-batch enzymatic saccharification of Formiline-pretreated sugarcane bagasse at high solid loadings for high sugar and ethanol titers. Bioresource Technol., 135, 350-356 (2013). Zheng, Y., Pan, Z., Zhang, R. and Jenkins, B. M.,