ISSN 0104-6632 Printed in Brazil
www.abeq.org.br/bjche
Vol. 32, No. 04, pp. 875 - 893, October - December, 2015 dx.doi.org/10.1590/0104-6632.20150324s00003584
*To whom correspondence should be addressed
Brazilian Journal
of Chemical
Engineering
SELECTIVE CATALYTIC REDUCTION (SCR) OF NO
BY AMMONIA OVER V
2
O
5
/TiO
2
CATALYST IN A
CATALYTIC FILTER MEDIUM AND HONEYCOMB
REACTOR: A KINETIC MODELING STUDY
M. Nahavandi
Department of Chemical and Materials Engineering, University of Idaho, Moscow, ID 83844, USA. Phone: (+1) 208 596 7659
E-mail: [email protected]
(Submitted: June 19, 2014 ; Revised: January 11, 2015 ; Accepted: February 2, 2015)
Abstract - The present study addresses a numerical modeling and simulation based on the available knowledge of SCR kinetics for prediction of NO conversion over a V2O5/TiO2 catalyst through a catalytic
filter medium and honeycomb reactor. After introducing the NH3-SCR system with specific operational
criteria, a reactor model was developed to evaluate the effect of various operating parameters such as flue gas temperature, velocity, NH3/NO molar ratio, etc., on the SCR process. Computational investigations were
performed based on the proposed model and optimum operational conditions were identified. Simulation results indicate that SCR performance is substantially under the effects of reactant concentration and operating temperature, so that the concentration of unreacted ammonia emitted from reactor discharge (ammonia slip) increases significantly at NH3/NO ratios of more than 1.14 and operating temperatures less
than 360 ºC and 300 ºC, respectively, in the catalytic filter medium and honeycomb reactor. The results also show that there are three sections in NO conversion variation versus changing temperature and the required
conversion with a maximum of almost 87% and low level of ammonia slip can be achieved at the NH3/NO
ratio of 1 and temperature range of 240–360 ºC in both reactors.
Keywords:Exhaust fume cleaning; Selective Catalytic Reduction (SCR); NH3-SCR System; Ammonia slip;
NO conversion; Catalytic filter medium; Honeycomb reactor.
INTRODUCTION
The concentration of anthropogenic and toxic pollutants in the atmosphere has increased rapidly throughout the last decades, which is basically due to the combustion of fossil fuels and biomass. In recent years, the problem of air pollution caused by toxic gases such as NOx and SOx, has become ecologically
serious. Nitrogen oxides (NOx) are a group of air
pollutants, including nitrogen oxide, nitrogen dioxide and nitrous oxide, considered as very dangerous, since they contribute to the greenhouse effect and partici-pate in photochemical reactions that lead to acid rain,
tropospheric ozone and respiratory problems in hu-mans (Vega et al., 2011). So, the reduction of NOx
from stationary and mobile sources has become an important concern of industrialized countries, due to an increased attention to environmental pollution and to the demand for sustainable energy development. Hence, the elimination of gaseous pollutants and particles from high temperature gases is often re-quired in waste incineration and thermal power plants. There are two sources of NOx. One of them
ammo-Brazilian Journal of Chemical Engineering nia oxidation from the decompositions of proteins).
The other is the combustion of fossil fuels (especially in vehicles) that is the main cause of emissions (Nova et al., 2006).
Several techniques seem to be feasible for NOx
abatement, such as cooled EGR, common rail fuel injection, LNT, LNC, and SCR DeNOx systems
(Ciardelli et al., 2007). Three major ones are lean NOx traps (LNT), ammonia- or urea- Selective
Cata-lytic Reduction (NH3-SCR) and Hydrocarbons
Se-lective Catalytic Reduction (HC-SCR). The control of NOx emissions from stationary sources includes
techniques of modification of the combustion stage (primary measures) and treatment of the effluent gases (secondary measures). The primary measures, which are extensively applied, guarantee NOx
reduc-tion levels of the order of 50 to 60%: this may not fit the most stringent legislations of many countries. Among the secondary measures, a well-established technology is represented by the ammonia selective catalytic reduction process (NH3-SCR). This method,
which was established in the 1970s, has been used mainly for stationary sources and still is the major strategy for the reduction of NO, industrially, due to its high efficiency and the ability of ammonia to react selectively with NOx to form nitrogen (N2) and
water (H2O), together with the resistance to
poison-ing and agpoison-ing of the applied catalysts (Vega et al., 2011).
Also, in term of the SCR catalyst, the application of a V2O5/TiO2 catalyst in the SCR process is very
effective. This catalyst could be widely used in Euro IV/V engines without filters and, due to the resistance of V2O5-based formulations to sulfur poisoning, it
can also be the preferred SCR catalyst choice for various applications (Yun and Kim, 2013; Kobayashi et al., 2004).
So far, a number of investigations have been re-ported on the selective catalytic reduction of NO by NH3 as a reductant (reducing agent) over
Vanadia-based catalysts to improve the reduction perfor-mance. Winkler et al. (2003) developed a one-di-mensional numerical model for chemical reactions to describe the DeNOx behavior of a current
commer-cial SCR catalyst by considering both standard and fast SCR reactions with the oxidation of NH3. They
also carried out a parametric study by changing the concentrations of various components such as NO, NH3 etc. to find the effects on SCR performance
using FTIR spectrometry and computational investi-gation. The heterogeneous chemical reactions taking place on the catalytic surface are also taken into ac-count based on the Langmuir-Hinshelwood (LH) mechanism, while the NH3 storage phenomena are
adopted through the Dubinin-Radushkevich adsorp-tion isotherm (Tsinoglou and Koltsakis, 2007). To evaluate the DeNOx performance, Gieshoff et al.
(2000) carried out studies and changed parameters such as the NH3/NOx and the NO2/NOx ratios over a
V2O5 catalyst. Also, in an effort to improve the NOx
conversion efficiency, several investigations have been performed using parameters such as space ve-locity, the temperature of the SCR catalyst, and the volume of oxidation catalyst, at different raw NOx
concentrations (Nam, 2007). Lietti et al. (1997) per-formed numerical investigations to determine the DeNOx behavior over a V2O5 SCR catalyst by
chang-ing various parameters such as NH3 concentration,
the temperature of the SCR catalyst, and NH3/NO
ra-tio. Furthermore, Nova et al. (2006; 2009) conducted a kinetic modeling of SCR reactions over a Vanadia-based catalysts for heavy duty diesel applications.
Even so, there are few investigations concerning NH3-SCR of NO over Vanadia-based catalysts in a
catalytic filter and honeycomb reactor. These multi-functional reactors for the simultaneous filtration and selective catalytic reduction (SCR) of NOx in high-temperature gas cleaning are of industrial interest since they allow substitution of two or more process units with a single reactor, where all the operations of interest are executed simultaneously. They have been suggested to save energy, space and cost and are capable of carrying out, besides the chemical reac-tions, other funcreac-tions, such as separation or heat exchange. Schaub et al. (2003) studied NH3-SCR of
nitric oxide (NO) over V2O5/TiO2 in a catalytic filter
using numerical kinetic modeling. They found that NO conversion of 60-80% is possible on the time scales of gas flow through the catalytic filter medium for temperatures around 250-350 °C. They also de-veloped their model to indirectly reach some sort of validation for a SCR honeycomb reactor. Zurcher et al. (2008) experimentally investigated NH3-SCR of
NO over two catalyst configurations namely ceramic candle and ceramic sponges, impregnated with V2O5/
TiO2/WO3-based catalysts, in a fixed-bed reactor and
individually. Results showed that the highest conver-sion values at 300 °C for both configurations in a fixed-bed reactor were generally lower in multifunc-tional reactors. Hubner et al. (1996) carried out an experimental investigation on NH3-SCR of NO with
honey-Selective Catalytic Reduction (SCR) of NO by Ammonia Over V2O5/TiO2 Catalyst in a Catalytic Filter Medium and Honeycomb Reactor 877
Brazilian Journal of Chemical Engineering Vol. 32, No. 04, pp. 875 - 893, October - December, 2015 comb catalysts. In the most recent study, Nahavandi
(2014) performed a numerical investigation of the enhancing effect of the electrohydrodynamics (EHD) technique on NH3-SCR of NO over V2O5/TiO2 in a
hollow cylindrical catalyst. Based on the obtained results, the maximum enhancement of almost 4.2-fold could be achieved for NO conversion by appli-cation of this technique in this type of catalyst.
However, limited experimental and numerical data have been reported in the literature on a cata-lytic filter medium and honeycomb reactor. In this article, the selective catalytic reduction (SCR) of NO by NH3 over a V2O5/TiO2 catalyst, together with
simultaneous effects of geometrical and operational parameters as well as contour plots of reacting flow in both of these reactors, are thoroughly investigated in a wide range of operating conditions by means of Computational Fluid Dynamics (CFD). The primary objective of this study is to numerically identify the most appropriate operational conditions in which the maximum SCR performance for NO reduction can be achieved, which has not been done so far on these scales and operating ranges in any other publication.
CHEMICAL REACTIONS
The NH3-SCR reduction of NO over a V2O5/TiO2
catalyst can be described by a reaction network that involves two parallel reactions. The desired reaction is the conversion of NO to N2 according to Equation
(1), while NH3 oxidation with O2, based on Equation
(2) is an undesired reaction which leads to lower NO conversion and becomes more significant at higher temperatures. The reduction of NOxis considered to
be faster compared to NO, so that NOx typically
consists of up to 95% NO, especially at high temper-atures. Therefore, NO2 is not included in the present
study (Schaub et al., 2003).
3 2 2 2
4NO4NH O 4N 6H O (1)
3 2 2 2
4NH 3O 2N 6H O (2)
NH3-SCR SYSTEM
The NH3-SCR System is generally comprised of
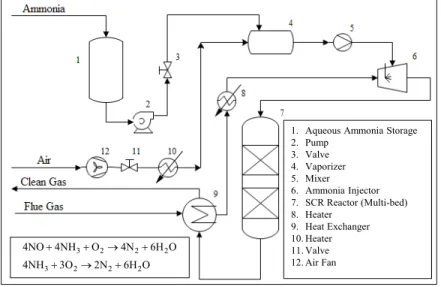
an aqueous ammonia storage, air supplier, heater, heat exchanger, vaporizer, mixer, injector and SCR reactor. A typical diagram for a NH3-SCR system is
illustrated in Figure 1. As shown, aqueous ammonia is pumped into the vaporizer before being mixed with hot air. Then, gaseous ammonia as a reducing agent (reductant) is injected into flue gas that is preheated in the heat exchanger. After that, the gas mixture flows into the SCR reactor. Then, discharged clean gas flows into the heat exchanger to release its heat to input flue gas. In the SCR process, a gaseous re-ductant is typically pure anhydrous ammonia, aqueous ammonia or urea. The chemical reactions that occur in NH3-SCR systems are shown in Equation (1) and
(2) where the first one is the desired reaction. The SCR process requires a precise control of the ammo-nia injection rate. An insufficient injection may result in unacceptably low NOx conversions. An injection
rate that is too high results in release of undesirable ammonia to the atmosphere. These ammonia emis-sions from SCR systems are known as ammonia slip. The ammonia slip increases at higher NH3/NOx
ra-tios. The stoichiometric NH3/NOx ratio in the SCR
system is about 1. Ratios higher than 1 significantly
1. Aqueous Ammonia Storage 2. Pump
3. Valve 4. Vaporizer 5. Mixer 6. Ammonia Injector 7. SCR Reactor (Multi-bed) 8. Heater
9. Heat Exchanger 10. Heater 11. Valve 12. Air Fan
3 2 2 2
3 2 2 2
4NO 4NH O 4N 6H O
4NH 3O 2N 6H O
Brazilian Journal of Chemical Engineering increase the ammonia slip (Baukal Jr, 2013). In a
practical SCR system, ammonia is typically injected to produce a NH3/NOx molar ratio of 1.05–1.1 to
achieve a NOx conversion of 80–90% with an
ammo-nia slip of about 10 ppm of unreacted ammoammo-nia in gases leaving the reactor. The NOx removal
effi-ciency depends on the flue gas temperature, the mo-lar ratio of ammonia to NOx, and the flue gas
resi-dence time in the catalyst bed (Neuffer and Laney, 2007). As discussed later, the ammonia slip decreases by increasing temperature, while the NOx conversion
in a SCR catalyst may either increase or decrease with temperature, depending on the particular tem-perature range and catalyst system. Also, in the fol-lowing, the effect of NH3/NOx ratio on NO
conver-sion is shown in different operating conditions and in the both kinds of SCR reactors.
MODELING AND SIMULATION
Model Definition
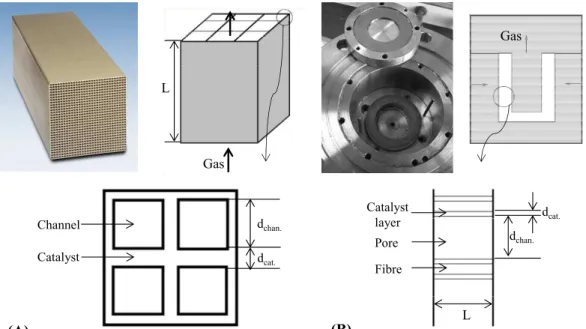
The respective models of a honeycomb reactor and an idealized catalytic filter, as commonly used today, are shown respectively in Figure 2 (A) and (B). The geometrical features, together with catalyst
proper-ties used in different operating conditions for the simulation of both reactor models, are reported in Table 1.
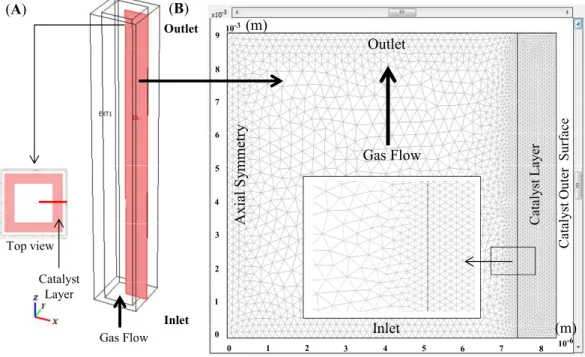
In these models, the catalytic filter like the honey-comb reactor is assumed to have many narrow quasi-pipe channels in its catalytic porous medium. So, an orthogonal rectangular field as the longitudinal cross-section of one proposed channel along the fluid flow was taken into consideration. Figure 3 (A) shows the proposed channel and its interior catalyst layer, to-gether with the rectangular cross-section. In order to see the entire geometry in one domain, as the length of the channel is much longer than its width, the channel`s length was scaled down 103-fold. As can be seen from Figure 3 (B), due to symmetric condi-tion of flow across the channel, the symmetry bound-ary condition was set to the left boundbound-ary. Also, wall and symmetry boundary conditions were set to the right boundary of the catalytic filter and honeycomb reactor, respectively. Two other boundary conditions at the bottom and top of the channel represent the input and output of reacting flow, respectively, with proposed reactant concentrations and gas velocity at the inlet and convective concentrations with no vis-cous stress at the outlet, under isothermal conditions. The respective boundary conditions are presented in Table 2.
Gas L
Gas
(A)
dchan.
dcat.
Catalyst Channel
(B)
Catalyst layer Pore
Fibre
dchan.
L
dcat.
Selective Catalytic Reduction (SCR) of NO by Ammonia Over V2O5/TiO2 Catalyst in a Catalytic Filter Medium and Honeycomb Reactor 879
Brazilian Journal of Chemical Engineering Vol. 32, No. 04, pp. 875 - 893, October - December, 2015
Table 1: The properties of the catalytic filter and honeycomb reactor for catalyst model simulation.
Operational Parameters SCR honeycomb Catalytic filter
(rigid or fibre material) Geometry
Filter medium thickness (L) m 0.7- 1.4 - 3 0.009 - 0.02
dchan mm 3 - 12 0.015
dcat mm 0.5 - 1.5
(wall thickness)
0.001
(layer thickness) Catalyst Properties
Catalyst V2O5/TiO2 porous
homogeneous solid
V2O5+ other components
impregnated support
V2O5 content wt.% 1 - 3.45 0.5- 10.4
Porosity (p) vol.% 64 - 82.5 95
Permeability (k ) p m2 10-8 a 10-8 a
Operating condition
Temperature (T) ºC 200 - 420 160 - 420
GHSV h-1 5000 - 15000 -
30000
3000- 5000- 8000 - 11000
O2 Inlet concentration (CO2) vol. % 7.6 7.6
NH3 Inlet concentration (CNH3) ppm 100 - 600 200 - 700
NO Inlet concentration (CNO) ppm 350 - 500 350 - 500
Source: Schaub et al. (2003).
a
Extrapolated for p 82.5 from the respective results (Seong, 2012).
Inlet Gas Flow Top view
Catalyst Layer
Outlet (m)
Ax
ia
l S
y
mme
tr
y
Gas Flow 10-3
9
Outlet 8
7
6
5
4
3
2
1
0
0 1 2 3 4 5 6 7 8 10
-6 (m) Inlet
C
ataly
st
La
y
er
Ca
ta
ly
st
O
u
te
r
S
urfac
e
(A) (B)
Figure 3: The model geometry consists of gas flow beside the catalyst layer: (A) geometrical shape; (B) grid plot.
Table 2: Boundary conditions.
Setting
Variables inleta outlet catalyst outer surface symmetry
catalytic filter honeycomb
u 2
in
2 u (1 s ) η
u+( u) T
n=0 0 axial sym. axial sym. x=0c cj_in n.
Dc c =0j
n.
Dc cj c uj
0 axial sym. axial sym. x=0T Tin n k T 0 n k T 0 axial sym. axial sym. x=0
a
Brazilian Journal of Chemical Engineering
Subdomain Equations
The stationary incompressible Navier–Stokes tion for catalyst-free channels and the Brinkman equa-tion for catalyst porous medium, together with their continuity equations for momentum balance, were used
in addition to convection-conduction heat transfer and convection-diffusion mass transfer equations to de-scribe a steady-state laminar flow of reacting gas through the catalytic filter medium and honeycomb reactor, which were solved simultaneously. These equa-tions are illustrated in Equaequa-tions (3) – (6), respectively.
Navier–Stokes equation (Catalyst pore space)
T
ρ(U )U pI + η U + ( U) 0
u u u u v
u v 2 P 0
x z x x z z x
v v v u v
u v 2 P 0
x z x x z z z
(3) Continuity equation u v 0 x z
(3a)
Brinkman equation (Catalyst layer)
T
p p
p p p
p
η 1 2η
U pI + η U + ( U) ( )( U)I 0
k ε 3
η 1 u 2η u v 1 u v
u 2 ( ) P 0
k x ε x 3 x z z ε z x
η k p p
1 v u 1 v 2η u v
v 2 ( ) P 0
x ε x z z ε z 3 x z
(4) Energy balance
p pρC U T= k T
T T T T
ρC u v k k 0
x y x x y y
(5)
Component mass balance
3 3 3 3
2 2
i c i i
NO NO NO NO
c c 1
NH NH NH NH
c c 1 2
O O O
c
U C = D C R
C C C C
u v D D 4R
x y x x y y
C C C C
u v D D 4 R R
x y x x y y
C C C
u v D
x y x
2 22 2 2 2
O
c 1 2
H O H O H O H O
c c 1 2
C
D R 3R
x y y
C C C C
u v D D 6 R R
x y x x y y
Selective Catalytic Reduction (SCR) of NO by Ammonia Over V2O5/TiO2 Catalyst in a Catalytic Filter Medium and Honeycomb Reactor 881
Brazilian Journal of Chemical Engineering Vol. 32, No. 04, pp. 875 - 893, October - December, 2015 Furthermore, thermodynamic data for the energy
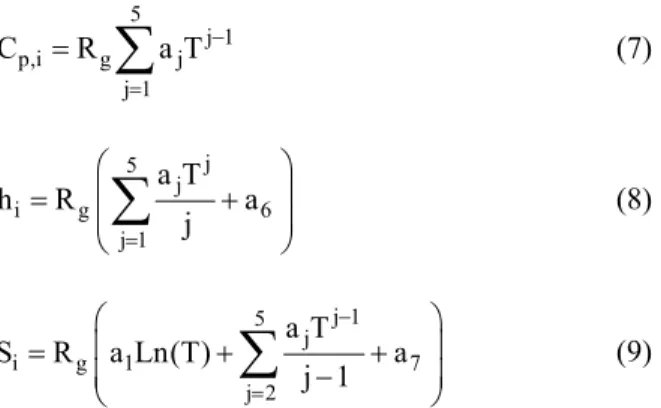
balance equations were calculated based on the polynomial expressions shown in Equation (7) – (9) (Gordon and McBride, 1972).
5 j 1
p,i g j
j 1
C R a T
(7)j 5
j
i g 6
j 1 a T
h R a
j
(8) j 1 5 ji g 1 7
j 2 a T
S R a Ln(T) a
j 1
(9)A set of seven coefficients per species was taken as input for the above polynomials for different tem-perature intervals (GRI-Mech). In addition to thermo-dynamic properties, transport properties were used for simulation of the space-dependent reactor model. Transport properties such as binary diffusivities, viscosity, and thermal conductivity were defined as the functions of temperature, pressure, and composi-tion using kinetic gas theory for the reacting gas mixture. In this regard, the diffusivities and gas vis-cosity are calculated based on Equations (10) and (11), respectively (Dhanushkodi et al., 2008).
3 c
3 3
A B A B
A B D
D 2.695 10
T (M M ) / (2 10 M M ) p (10) 3 6 2 V T(1 10 M)
2.699 10
(11)
Solution Methodology
In this study, the system of partial differential equations (PDEs) was solved by Comsol Multiphysics software using the finite element method (FEM), where Lagrange-quadratic interpolation elements were used to form the finite element interpolation functions. In order to solve the system of equations, the fully coupled stationary solver with Direct (UMFPACK) module as a linear solution method starts from an initial guess and applies Newton-Raphson iterations until the solution has converged. Hence, the maximum iteration number and relative
tolerance of 25 and 1 × 10⁻⁶, respectively, were set as operational solver parameters for the nonlinear set-ting of automatic linearity module with Damped Newton to solve the possible nonlinear system of equations. Furthermore, Elimination was chosen for Constraint handling method and no type of scaling was considered for automatic solution form, which was adequate to guarantee the steady solution of the proposed model.
Mesh
Free meshes with triangular (advancing front) elements were used to mesh the two-dimensional space in which gas has an upward laminar flow be-side the catalyst layer. It should be noted that free meshes are ones that are adaptive in the case of dif-ferent geometries. Triangular elements with maxi-mum element size of 0.2 mm applied in the catalyst layer are smaller than the bulk elements with maxi-mum element size of 0.5 mm as a result of chemical reaction being done in this narrow catalytic space, which needs to have a more accurate solution. Also, a maximum element size scaling factor of 0.3 was chosen to have a smaller mesh beside the boundaries. In order to avoid possible errors resulting from dis-continuity of flow pattern between two subdomains with different mesh sizes, the element growth rate was set to 1.2. As we can see in Figure 3 (B), mesh size increases with distance from the catalyst layer to the subdomain interior. Moreover, the mesh curva-ture factor, mesh curvacurva-ture cutoff and resolution of narrow region were taken to be 0.25, 0.0003 and 1, respectively, to have more stable solution.
Grid Independence Analysis
In order to investigate the independency of grids from the solution of problem, the conversion of NO versus different mesh sizes was depicted, which has been shown in Figure 4.
Brazilian Journal of Chemical Engineering As shown, mesh size through the catalyst layer
varied between 0.05 mm and 0.4 mm. As we can see, by increasing the mesh size, NO conversion fell due to the lack of accuracy with coarser meshes and re-mained approximately steady for mesh sizes less than 0.2 mm, which in turn indicates the inde-pendency of elements for the numerical solution.
Model Validation
In order to evaluate the validation of simulation data, the simulated conversion values of NO in the catalytic filter medium were compared with empiri-cal results obtained from published experiments. The following reaction rate expressions were considered for kinetic calculation of two paralleled reactions (Equations (1) and (2)) in the simulation setup (Schaub et al., 2003):
3 3
NH
1 1 NO
NH aC R =k C
1+aC (12)
3
2 2 NH
R =k C (13)
where,
j j j0
g E k =k exp
R T
(14)
0
g A
a=a exp .
R T
(15)
The values of the constant parameters used in Equations (14) and (15) are presented in Table 3. As we can see in Figure 5, the simulated values of NO conversion agree well with the experimental data with a maximum average deviation of about 1%.
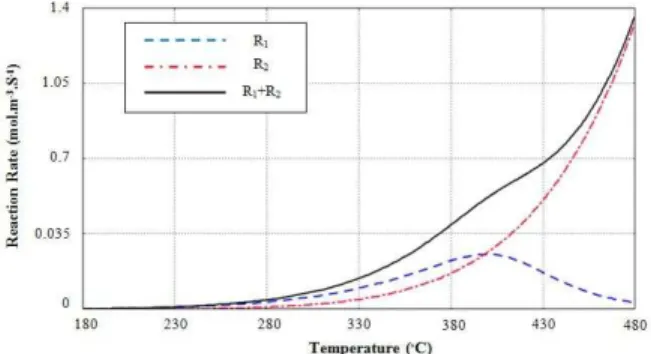
In order to evaluate the kinetic behavior of reac-tions, both reaction rates at different temperatures were calculated for equal NO and NH3 inlet
concen-tration values according to Equations (12) and (13) and are shown in Figure 6. The maximum point in R1
reflects the fact that, although for temperatures less than 400 ºC, R1 is more than R2, athigher
tempera-tures R2 has higher values. Since our goal is to gain
more NO reduction, this figure indicates that having high temperature does not always favor more NO conversion. But, it is not the main reason that lures us into investigation of SCR of NO as the concentra-tions of reactants vary unequally during these com-petitive reactions. As we can see in the following sections, the consumption of NH3 is the primary key
factor which influences NO conversion along the gas flow through both catalytic reactors. We also see the effect of various parameters on NO reduction with respect to NH3 conversion.
Table 3: Parameter values in the rate equations.
E1=60 kJ/ mol k20=6.8×10⁷ s-1
E2=85 kJ/ mol A=-243 kJ/ mol
k10=1×10⁶ s-1 a0=2.68 × 10⁻¹⁷ m3/mol Source: (Schaub et al., 2003).
Figure 5: The validation of simulation data with experimental results from catalytic filter candle ex-periments using ceramic material in a bench-scale test facility (CNO_in=CNH3_in= 350 ppm, CO2_in=7.6
vol.%, GHSV=11000 h-1, ueff= 0.047 – 0.073 m/s).
Reprinted (adapted) with permission from Nahavandi
(2014). Copyright (2014) American Chemical Society.
Figure 6: Calculated values of reaction rates R1 and
R2 for inlet concentration values, conditions: see
Figure 5.
SIMULATION RESULTS
Selective Catalytic Reduction (SCR) of NO by Ammonia Over V2O5/TiO2 Catalyst in a Catalytic Filter Medium and Honeycomb Reactor 883
Brazilian Journal of Chemical Engineering Vol. 32, No. 04, pp. 875 - 893, October - December, 2015 operational conditions. Hence, the influence of
oper-ating parameters was investigated individually to identify the extent to which they could be effective on SCR performance.
Effect of Temperature
As indicated, temperature has a strong effect on the rate of two SCR reactions owing to its impact on reaction rate constants obeying the Arrhenius law. The simple expectation is that more NO conversion occurs at higher temperature. However, this is no longer the case even for temperatures less than 400 ºC, as shown by the intersection of two reaction curves
in Figure 6. Since two competitive SCR reactions are parallel and ammonia is being consumed simultane-ously in both R1 and R2, different NO conversions
are obtained at different operating temperatures as a result of the decreasing concentration of NH3 along
the reactor. Figure 7 (A), (B) and (C) show the varia-tion of NO and NH3 concentrations along the reactor
at three different temperatures. Figure 7 (D) shows the variation of their concentration along the cross-section shown in Figure 7 (A) for different operating temperatures. As we can see in Figure 7 (D1) and
(D2), by raising the temperature to 360 ºC, NO and
NH3 concentrations plummet, so that no ammonia is
left by the end of the channel.
(A1) NO Concentration
T=300 ºC
Cr
o
ss
S
ec
ti
o
n
NH3Concentration
(A2)
T=300 ºC
Cro
ss
Sec
tio
n
(B1)
T=360 ºC
(B2)
T=360 ºC
(C1)
T=420 ºC
(C2)
Brazilian Journal of Chemical Engineering
T=380 ºC T=400 ºC T=420 ºC
Cross Section length (m)
Co
nc
en
tr
a
ti
o
n
CNO
(mo
l/
m
3) T=300 ºCT=320 ºC
T=340 ºC T=360 ºC
(D1)
Cross Section length (m)
Concent
rat
ion
CNH3
(mo
l/
m
3)
(D2)
Figure 7: Effect of temperature; Variation of NO and NH3 concentration through the catalytic filter
(A, B, C) and along the cross section (D) for different applied temperatures, conditions: see Figure 5.
Therefore, at 360 ºC, NO has a maximum conver-sion and its concentration falls to a low of 0.0045 (mol/m3) or its minimum value. Nevertheless, some-thing different happens for temperatures up to 360 ºC when the rate of the first reaction (R1) falls, leading
to a greater NO outlet concentration at higher tem-peratures. In contrast, NH3 is consumed more rapidly
according to R2, but as R1 slows down, its
concentra-tion does not change significantly for temperatures up to 360 ºC. This trend can be seen in Figure 8 (A1).
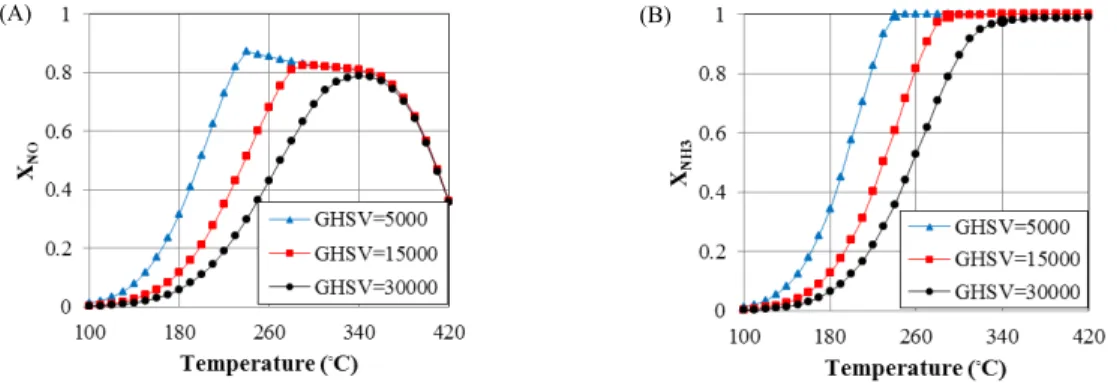
As shown, by increasing temperature, all trends with different gas velocities rise and, after a maximum, they begin to fall. Focusing on maximum area can reveal more details about what really happens, Figure 8 (B1). As illustrated, all curves have a descending
trend after ammonia is used up completely through the channel, Figure 8 (B2). Then they all converge
into one single curve at 370 ºC, namely the falling point and decrease with a faster descending rate. Actually, there are two areas ahead of the maximum point; the former is due to depletion of NH3 until
reaching 370 ºC and the latter is due to the fall in R1
that causes all curves to plunge with a single steep trend. The reason why NO conversion declines moder-ately with the increase of temperature after full con-sumption of ammonia (Maximum Point of each curve) until reaching the falling point (370 ºC) is the fact that, by using up all ammonia before reaching the end of channel, less catalyst volume is used for catalytic reactions and so less NO is converted. This does not happen when the length of the reactor is adequately long and, as we can see later in the case of the honeycomb reactor, NO conversion is less sensitive to this fact and the curve levels off after the maximum point. As shown in Figure 8 (A1), after full
consumption of NH3 at the maximum point, the
greater the temperature, the lower the conversion. Therefore, one can split up the reactor operating temperature range into three sections in which differ-ent conversions of NO occur: NO is reduced along the reactor until all NH3 is completely consumed
(First Section); after that, both reactions stop and the rest of the reactor will remain untouched and so is ineffective. By raising the temperature, less and less of the reactor takes part in SCR of NO, resulting in a moderately lower conversion (Second Section). Then, at higher temperatures, the reaction rate of NO (R1) decreases and NO conversion plunges steeply
(Third Section). These sections can be equivalent to the three parts of each NO conversion curve shown in Figure 8 (B1) and (B2). As seen, the second section
of each curve is shortened by increasing the gas ve-locity and it has lower values; therefore, gas veve-locity has its own effect on NO conversion.
Effect of Gas Velocity
As mentioned, NO conversion varies upon chang-ing the temperature, but there are some parameters which can influence this variation. Gas Hourly Space Velocity (GHSV) is one of these factors since it can change the residence time of reacting components in chemical reactors and so change their conversions. As usual, reducing the residence time by raising the gas velocity, the reactants` conversion should de-crease. Hence, the conversion of NO and NH3 drops
Selective Catalytic Reduction (SCR) of NO by Ammonia Over V2O5/TiO2 Catalyst in a Catalytic Filter Medium and Honeycomb Reactor 885
Brazilian Journal of Chemical Engineering Vol. 32, No. 04, pp. 875 - 893, October - December, 2015 fail to change the reactant conversion owing to a lack
of kinetic driving force. On the other hand, at high temperatures the second reaction rate (R2) increases
while the first one (R1) decreases, which results in
the lack of NH3 and a plummet in NO conversion; so
again the GHSV has no major effect on conversion. Therefore, gas velocity in parallel with temperature controls the value of conversion. As we can see in Figure 8 (A1) and (A2), the change of GHSV for
tem-peratures less than 190 ºC and molre than 360 ºC makes relatively no difference. In contrast, beside the maximum point, where NO conversion peaked at around 0.7 and NH3 reached the value of 90% for a
GHSV of 3000, gas velocity has the most significant influence on changing the conversions. As shown in Figure 8 (B1), at a temperature of 330 ºC, upon
rais-ing the GHSV from 3000 to 11000, the maximum NO conversion drops by up to 15%. Applying higher temperatures bridges the gap between curves and makes them converge into one single curve. Added to this, another important point is that, upon increas-ing the gas velocity, the maximum conversion de-clines and occurs at higher temperature. The reason why it occurs at higher temperature is that an in-creased gas velocity reduces the possibility of com-plete NH3 consumption by the end of the reactor, so
the NO conversion diminishes. Although the increase
in temperature increases reaction rates that can neu-tralize to some extent the effect of the increase in gas velocity, as residence time decreases and the major part of the inlet gas goes through the empty space of the reactor faster than through the catalyst porous layer, a lower NO conversion is obtained.
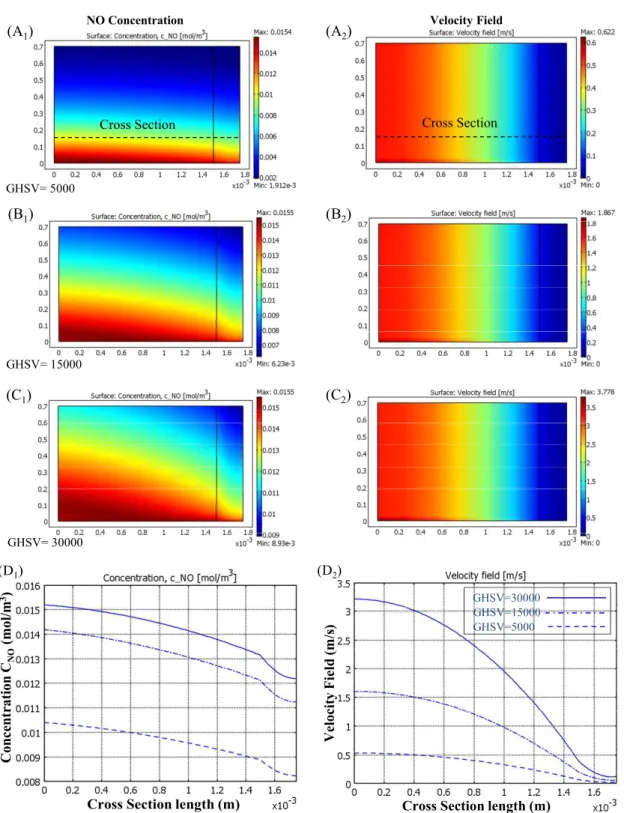
This phenomenon can be seen more obviously in Figure 9 (D2), which shows the gas velocity field
through the honeycomb reactor along the cross section in Figure 9 (A). As shown, gas exits the reactor through empty free space more significantly when it has higher velocities, which is followed by a lower NO conversion that results in higher output concentrations, Figure 9 (D1). This figure also shows the GHSV
influ-ence on the variation of gas flow velocity field and NO concentration as contour plots. As seen, the gas flow through free space is greater under the effect of ve-locity variation than in the catalyst porous layer. The velocity field has a reverse parabolic trend for flow through the catalyst porous space in comparison with the inner free space of the reactor due to its continuous boundary condition at the interface between the porous medium and free space, which causes the curves to have negative first and second derivatives. In compari-son, the catalyst layer has a negative first and a posi-tive second derivaposi-tive due to the no slip boundary condition on the right hand side of catalyst layer.
(A1) (A2)
(B1) (B2)
Figure 8: Evaluation of the effect of GHSV on conversion versus the gas temperature in the catalytic filter, CNO_in=CNH3_in= 350 ppm, CO2_in=7.6 vol.%, εp=0.95, k108m2, dchan=0.015 mm, dcat=0.001 mm,
Brazilian Journal of Chemical Engineering
NO Concentration (A1)
GHSV= 5000
Cross Section
(A2)
Velocity Field
Cross Section
(B1)
GHSV= 15000
(B2)
(C1)
GHSV= 30000
(C2)
(D1)
Co
nc
en
tr
a
ti
o
n
C
NO
(m
o
l/
m
3)
Cross Section length (m)
V
e
loci
ty
F
iel
d (m
/s
)
Cross Section length (m)
GHSV=30000 GHSV=15000 GHSV=5000
(D2)
Figure 9: Effect of Gas Velocity; Variation of NO concentration (left column) and velocity field (right column) through the honeycomb reactor (A, B, C) and along the cross section (D) for different applied GHSV, CNO_in=CNH3_in= 350 ppm, CO2_in=7.6 vol.%, εp=0.95, k108 m2, dchan=3 mm, dcat=0.5 mm,
Selective Catalytic Reduction (SCR) of NO by Ammonia Over V2O5/TiO2 Catalyst in a Catalytic Filter Medium and Honeycomb Reactor 887
Brazilian Journal of Chemical Engineering Vol. 32, No. 04, pp. 875 - 893, October - December, 2015 The honeycomb reactor also undergoes changes
similar to the catalytic filter regarding gas velocities. Once again, upon full consumption of ammonia, NO conversion with different GHSVs starts to decrease and, at higher temperatures, they converge into one descending curve. But, in this case, there is a special difference in the descending trend of NO conversion. As we can see in Figure 10 (A), NO conversions for temperatures from 240 ºC and 280 ºC to 340 ºC, respectively for low GHSVs of 5000 and 15000 are relatively level. As mentioned earlier, the reason for the moderate falling trend after maximum point is that, at higher temperatures, NH3 is used up closer to
the inlet of the reactor, so the chemical reactions occurs in less catalyst space and therefore conversion decreases. Here, because the length of the honey-comb reactor is much longer than its width, around two orders of magnitude, at low GHSVs the NO conversion levels off with less effect from catalyst usage space and a lengthening of the second section of the curve after the maximum point. Afterward, all curves converge into one steep falling trend due to the decline of R1. This fact can also be seen in the
next section where the concentration influences on the conversion is considered.
Effect of Inlet Concentration
The concentration of gas toxic pollutants is one of the most crucial factors in selection of the best opera-tional condition for contaminant elimination. So, in this section, we examine the SCR of NO under the effect of different NH3 and NO concentrations at
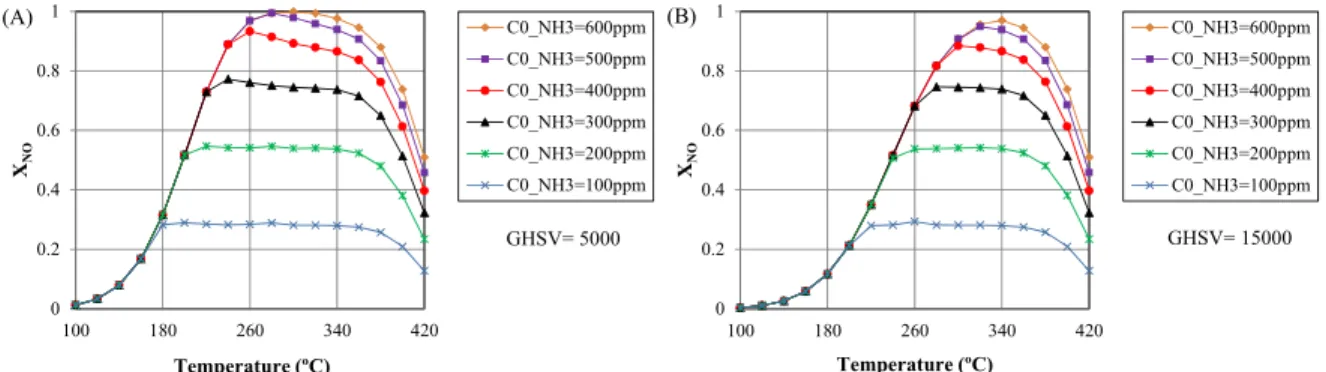
various operating temperatures in the catalytic filter and honeycomb reactor. As mentioned earlier, there are three sections of NO conversion regarding gas temperature. Here, as seen in Figure 11, with a de-crease of NH3 concentration, NO conversion
gener-ally diminishes, so that the maximum conversion
plunges and shifts towards lower temperatures; this causes the second section to lengthen and level off at a relatively similar value. Moreover, despite the changes in ammonia concentration, the falling point does not change and still occurs at 340 ºC because, as mentioned earlier, it consists of R1 which relies on
the operating temperature according to the Arrhenius Law for the reaction rate constant. Upon raising the ammonia inlet concentration, NO conversion in-creases, more significantly for temperatures between 180 and 340 ºC, Meanwhile the maximum point matches the falling point and the maximum operat-ing conversion is reached. In contrast, at higher tem-peratures, R1 begins to decrease andconversion is less
and less affected by raising the NH3 concentration.
In order to evaluate the effect of concentration on conversion more precisely, the variation of NH3 and
NO concentrations along the cross section through the honeycomb reactor has been calculated with the low NH3 inlet concentration of 200 ppm as shown in
Figure 12. This figure reveals more facts about the fluctuating trends of reactant conversion versus changing temperature. As shown, the NO outlet con-centration decreases upon increasing the temperature up to 260 ºC. By raising the temperature to 300 ºC and 340 ºC, NO and NH3 final concentrations do not
change to a similar output value, although this hap-pens at a shorter distance of 0.4 m for these tempera-tures than that of 0.6 m for 260 ºC. On the other hand, for temperatures of 380 ºC and 420 ºC, the NO out-put concentration increases due to a smaller R1. Even
so, their falling trends level off once again at 0.4 m from the inlet of the reactor. As indicated earlier, raising the temperature decreases the ammonia slip, while NO concentration may either increase or de-crease with temperature. This issue can be clearly seen in Figure (12). Thus, as the operating tempera-ture rises, the concentration of outlet ammonia de-creases significantly.
(A) (B)
Brazilian Journal of Chemical Engineering 0
0.2 0.4 0.6 0.8 1
100 180 260 340 420
XNO
Temperature (ºC)
C0_NH3=600ppm C0_NH3=500ppm C0_NH3=400ppm C0_NH3=300ppm C0_NH3=200ppm C0_NH3=100ppm GHSV= 5000 (A)
0 0.2 0.4 0.6 0.8 1
100 180 260 340 420
XNO
Temperature (ºC)
C0_NH3=600ppm C0_NH3=500ppm C0_NH3=400ppm C0_NH3=300ppm C0_NH3=200ppm C0_NH3=100ppm GHSV= 15000 (B)
Figure 11: Effect of NH3 inlet concentration on NO conversion in the honeycomb reactor, CNO_in= 350
ppm, other conditions: see Figure 9.
(A1)
Cr
oss Se
ct
io
n
Concentration, CNO(mol/m3) (A2) Concentration, CNH3(mol/m3)
Cross
Section
Concentration, CNO(mol/m3)
Cross Section length (m) (B1)
T=340 ºC T=260 ºC T=220 ºC T=300 ºC T=380 ºC T=420 ºC .
(B2) Concentration, C
NH3(mol/m3)
Cross Section length (m)
Figure 12: Variation of NO and NH3 concentrations along the honeycomb reactor, CNO_in= 350 ppm,
CNH3 in= 200 ppm, GHSV=15000, other conditions: see Figure 9.
There is also a similar trend in the catalytic filter reactor, but with relatively small differences owing to the short length of this kind of reactor, which re-sults in no level trend in the second section after the maximum conversion. As shown in Figure 13, all conversions, particularly with low ammonia con-centrations, present descending trends after the maximum point and start to plummet more steeply at the falling point of 370 ºC. This figure also shows how we can obtain similar conversions with lower temperature and NH3 inlet concentration to obtain
an optimum SCR for NO. For example, an 80% conversion can be achieved at 350 ºC with 400 ppm NH3 rather than using 700 ppm of ammonia at
around 398 ºC.
More NO conversion is not always achieved by raising the NH3 concentration because the reaction
rate (R1) controls its increase, especially at
Selective Catalytic Reduction (SCR) of NO by Ammonia Over V2O5/TiO2 Catalyst in a Catalytic Filter Medium and Honeycomb Reactor 889
Brazilian Journal of Chemical Engineering Vol. 32, No. 04, pp. 875 - 893, October - December, 2015 similar value for all ammonia inlet concentrations.
At higher temperatures, as the reaction rate increases, more conversion is gained by adding NH3 inlet
con-centration. After the falling point, since R1 begins to
decrease at higher temperatures, less NO conversion can be obtained by raising ammonia. As we can see in Figure 13, for an NH3 inlet concentration of 700 ppm
at 370 ºC the maximum conversion of 0.88 is gained upon raising its concentration even further, the maximum conversion does not increase remarkably, so that it matches the maximum point of NH3 inlet
concentration of 600 ppm. So, upon raising the am-monia concentration, the maximum point for each curve tends to reach the falling point until they cover each other. At this point, the maximum con-version for the reactor under specified conditions is obtained.
Figure 13: Effect of NH3 inlet concentration on NO
conversion in the catalytic filter, CNO_in= 350 ppm,
GHSV=3000, other conditions; see Figure 8.
As mentioned earlier, the SCR process requires accurate control of the ammonia injection rate in the form of the NH3/NO ratio, so that the application of
ratios greater than 1 considerably increases the
am-monia slip. In order to show the most appropriate operating conditions, the variation of NO conversion versus the NH3/NO ratio in the catalytic filter at
dif-ferent operating temperatures is shown in Figure 14 (A). As we can see, by raising the NH3/NO ratio at
temperatures higher than 380 ºC, NO conversion in-creases, while it levels off at lower temperatures especially at NH3/NO ratios higher than 1.14, which
implies more of the increase in ammonia slip. More-over, the variation of NO conversion versus the NO/NH3 ratio is shown in Figure 14 (B). As seen,
by increasing the NO/NH3 ratio, NO conversion
de-creases more sharply at lower temperatures. There-fore, the increase of NO concentration rather than ammonia, particularly at low operating tempera-tures, considerably diminishes the SCR efficiency. Figure 15 (A) and (B) also present similar trends for the honeycomb reactor.
Effect of Channel and Catalyst Layer Width
As mentioned earlier, a large amount of the input gas in the reactor passes through vacant space with higher bulk velocity than the little amount that passes through the porous medium of the catalyst layer, Figure 10 (D). So, the widths of the channel and catalyst layers play a crucial role in the level at which a catalytic reactor can be effective in reduc-tion of reacting components. Conceivably, the effect of channel width strongly depends on gas velocity through the reactor, which is known as GHSV. As shown in Figure 16, at low gas velocities the width does not make a considerable difference in NO con-version and so at a GHSV about 2500 all curves converge with each other. Conversely, at higher GHSVs, the channel and catalyst layer widths are more decisive.
(A) (B)
Figure 14: Effect of NO and NH3 inlet concentrations on NO conversion at different temperatures in the
Brazilian Journal of Chemical Engineering
(A) (B)
Figure 15: Effect of NO and NH3 inlet concentrations on NO conversion at different temperatures in the
honeycomb reactor, GHSV=5000, (A) CNO=350 ppm, (B) CNH3=350 ppm, other conditions: see Figure 9.
Overall, the trends with different channel and cata-lyst layer widths are a decrease upon raising the GHSV. Nevertheless, the NH3-SCR of NO in
channels with narrower widths and wider catalyst layers is less affected by an increase in gas velocity, although the effect of channel width outweighs the influence of catalyst layer thickness. As we can see in Figure 16, by increasing GHSV, NO conversion plunges more rapidly in the channel width of 12 mm than at narrow channel widths of 3, 6 and 9 mm, although in each case NO conversion for the thicker catalyst layer has higher values.
Effect of Reactor Length
Reactant conversion through a catalytic reactor is, to a large extent, under the effect of gas velocity. Hence the residence time of reactants can be changed by applying different lengths of reactor and the length of the reactor channel leads to different conversions for a specific GHSV. This is more obvi-ous at higher GHSVs and lower residence times, where full conversion of reactant is not obtained and is more sensitive to the length of channel. In contrast, by increasing the residence time due to a decrease of gas velocity, the effect of channel length on conversion diminishes, as shown in Figure 17. A low GHSV around 2000, all curves for different lengths of reactor channels converge into a one horizontal line owing to the full conversion of NO before reaching the end of the reactor. By increasing the GHSV, all conversion curves start to decrease, but at different points due to the different channel lengths.
Where NO reacts thoroughly is at 0.7, 1.4 and 3 m of the reactor channel, respectively, for GHSVs of 2000, 6000 and 12000. However, the residence time
is not the only effect caused by channel length since the curves descend with different slopes. As indicated earlier in Figure 10, a large proportion of the input reacting gas exits from the reactor with a low possibility of catalyst engagement due to a higher flow rate in the free space than in the catalyst layer. This can be intensified more significantly at short channel lengths and, as shown in Figure 17, NO conversion begins to fall steeply at low GHSV of 2000 for a channel length of 0.7 m. This happens with much lower descending slopes for channel lengths of 1.4 and 3 m at GHSVs of 6000 and 12000, respectively. As shown, the honeycomb reactor with channel length of 3 m has the minimum effect of free space, so it presents a linear falling trend with an increase in GHSV. Its gas flow is known as a uni-form plug flow, generally.
Effectiveness of Operating Variables
Although each of the operating parameters has its own effect on SCR performance, it is important to identify variables that can most effectively influ-ence the NO conversion, which is the primary aim of this study. In this regard, the maximum variations of NO conversion due to the variation of different operating variables are presented in Table 4. As seen, NO conversion increases 0.85 and 0.74 as the temperature rises from 100 ºC to 240 ºC and from 160 ºC to 340 ºC, respectively, in the honeycomb re-actor and catalytic filter medium. NO conversion can also be substantially altered by more than 0.7, through an NH3/NO ratio variation from 0.29 to
Selective Catalytic Reduction (SCR) of NO by Ammonia Over V2O5/TiO2 Catalyst in a Catalytic Filter Medium and Honeycomb Reactor 891
Brazilian Journal of Chemical Engineering Vol. 32, No. 04, pp. 875 - 893, October - December, 2015
Figure 16: Effect of channel and catalyst layer width on NO conversion in the honeycomb reactor, T=300 ºC, dchan=3 mm, dcat=0.5 mm, other
condi-tions: see Figure 9.
Figure 17: Effect of reactor channel length on NO conversion in the honeycomb reactor, T=300 ºC, dchan=9 mm, dcat=0.5 mm, other conditions: see
Figure 9.
Table 4: The maximum variation of NO conversion for different operating parameters.
Variables Catalytic Filter Honeycomb Reactor
Operating range ΔXmax. Operating range ΔXmax.
T 160 ºC to 340 ºC
(CNO=CNH3=350 ppm)
0.7425 100 ºC to 240 ºC
(CNO=CNH3=350 ppm)
0.8585
GHSV 3000 to 11000
(CNO=CNH3=350 ppm)
̶
0.1535 5000 to 30000
(CNO=CNH3=350 ppm)
̶
0.5767
CNH3/ CNO 0.29 to 4.57
(CNO=350 ppm)
0.7109 0.29 to 4.57
(CNO=350 ppm)
0.7215
Dchannel - - 3 to 12 mm
(Dcat.=1.5)
̶
0.59
Dcat. - - 0.5 to 1.5 mm
(Dchannel=3 mm)
0.10
L 0.009 to 0.02 m
(Dcat.=0.001, Dchannel=0.015 mm)
0.1257 0.7 to 3 m
(Dcat.=0.5, Dchannel=9 mm)
0.461
CONCLUSIONS
SCR performance depends on the temperature and reactant concentration of the flue gas mixture that flows into the SCR reactor. NO conversion increases upon raising the NH3/NO ratio at
rela-tively high operating temperatures, while it remains constant at low temperatures with a high level of ammonia slip emitted from the reactor discharge. Although the ammonia slip can be reduced by in-creasing the temperature, the NO conversion in a SCR catalyst may either increase or decrease, de-pending on the particular temperature range and the type of catalyst. Based on the simulation results, optimum SCR performance for NO reduction with minimum ammonia slip in both the catalytic filter medium and the honeycomb reactor could be achieved by applying an NH3/NO molar ratio of
about 1.14 in certain operational conditions, which conforms to the experimental data obtained for this ratio in NH3-SCR catalysts.
NOMENCLATURE
A Frequency factor i
C Concentration (mol/m3) p
C Heat capacity at constant pressure
(J/(kg.K)) i
p
C Species’ heat capacity (J/(mol.K) c
D Diffusion coefficient (m2/s) j
E Activation energy (J/mol) g gravitational acceleration (m/s2)
i
h Species’ molar enthalpy (J/mol) I Unit vector
k Thermal conductivity (W/m.K) i
k Reaction rate constant p
k Permeability (m2) L Catalyst length (m)
A
M Molar weight of A (kg/mol) B
Brazilian Journal of Chemical Engineering
n Normal unit vector p Pressure (Pa)
R Reaction rate (mol/(m3.s)) g
R Universal gas constant: 8.31441 (J/(mol. K)) i
s Species’ molar entropy (J/(mol.K) T Temperature (K)
U Velocity (m/s)
X Conversion
Greek Letters
p
ε Porosity
η Dynamic viscosity (Pa.s) Fluid density (kg/m3
)
Characteristic length of the Lennard-Jones interaction potential: 10−10 (m)
A
Molecular diameter of A (m)
B
Molecular diameter of B (m)
D
Collision integral
V
Collision integral
Abbreviations
SCR Selective Catalytic Reduction DeNOx NOx removal
GHSV Gas Hourly Space Velocity
UMFPACK Unsymmetric MultiFrontal method
REFERENCES
Baukal Jr, C. E., Ed. The John Zink Hamworthy Combustion Handbook: Applications, CRC Press, Boca Raton, FL (2013).
Ciardelli, C., Nova, I., Tronconi, E., Chatterjee, D., Bandl-Konrad, B., Weibel, M., Krutzsch, B., Re-activity of NO/NO2 -NH3 SCR system for diesel
exhaust aftertreatment: identification of the reac-tion network as a funcreac-tion of temperature and NO2 feed content. Applied Catalysis B:
Environ-mental, 80-90 (2007).
Dhanushkodi, S. R., Mahinpey, N. and Wilson, M., Kinetic and 2D reactor modeling for simulation of the catalytic reduction of NOx in the monolith
honeycomb reactor. Process Saf. Environ. Prot., 303-309 (2008).
Gieshoff, J., Schäfer-Sindlinger, A., Spurk, P. C., Van Den Tillaart, J. A. A., and Garr, G., Improved SCR systems for heavy-duty applications. SAE Transactions, 109, 73-80 (2000).
Gordon, S. and McBride, B. J., Computer program for calculation of complex chemical equilibrium compositions. NASA (1972).
GRI-Mech 3.0: http://www.me.berkeley.edu/gri-mech/. Hubner, K., Pape, A. and Weber, E. A., Simultaneous removal of gaseous and particulate components from gases by catalytically activated ceramic fil-ters. Conf. Proc. High Temp. Gas Cleaning, 267-277 (1996).
Kobayashi, Y., Tajima, N., Nakano, H. and Hirao, K., Selective catalytic reduction of nitric oxide by ammonia: The activation mechanism. The Journal of Physical Chemistry, B, 108, 12264-12266 (2004). Lietti, L., Nova, I., Camurri, S., Tronconi, E. and
Forzatti, P., Dynamics of the SCR‐DeNOx
reac-tion by the transient‐response method. AIChE Journal, 43, 2559-2570 (1997).
Nahavandi, M., Selective catalytic reduction of nitric oxide by ammonia over V2O5/TiO2 in a hollow
cylindrical catalyst under enhancing effect of elec-trohydrodynamics: A kinetic modeling study. In-dustrial & Engineering Chemistry Research, 53, 12673-12688 (2014).
Nam, J. G., Static characteristics of a urea-SCR sys-tem for NOx reduction in diesel engines.
Interna-tional Journal of Automotive Technology, 8, 283-288 (2007).
Neuffer, B. and Laney, M., Alternative Control Tech-niques Document Update: NOx Emissions from
New Cement Kilns. US Environmental Protection Agency, Office of Air Quality Planning and Standards, Sector Policies and Programs Division (2007).
Nova, I., Beretta, A., Groppi, G., Lietti, L., Tronconi, E. and Forzatti, P., Monolithic Catalysts for NOx
Removal from Stationary Sources. Structured Catalyst and Reactors. Marcel Dekker, New York, 171-214 (2006).
Nova, I., Ciardelli, C., Tronconi, E., Chatterjee, D. and Bandl‐Konrad, B., NH3‐SCR of NO over a
V‐based catalyst: Low‐T redox kinetics with NH3
inhibition. AIChE Journal, 52, 3222-3233 (2006). Nova, I., Ciardelli, C., Tronconi, E., Chatterjee, D.
and Weibel, M., Unifying redox kinetics for stand-ard and fast NH3‐SCR over a V2O5‐WO3/TiO2
catalyst. AIChE Journal, 55, 1514-1529 (2009). Roduit, B., Baiker, A., Bettoni, F., Baldyga, J. and
Wokaun, A., 3‐D modeling of SCR of NOx by
NH3 on vanadia honeycomb catalysts. AIChE
Journal, 44, 2731-2744 (1998).
Schaub, G., Unruh, D., Wang, J. and Turek, T., Ki-netic analysis of selective catalytic NOx reduction
Selective Catalytic Reduction (SCR) of NO by Ammonia Over V2O5/TiO2 Catalyst in a Catalytic Filter Medium and Honeycomb Reactor 893
Brazilian Journal of Chemical Engineering Vol. 32, No. 04, pp. 875 - 893, October - December, 2015 and Processing: Process Intensification, 42,
365-371 (2003).
Seong, H. J., Selective Catalytic Reduction (SCR) of NO by NH3 in a Fixed-bed Reactor; M. S.
Disser-tation. The Pennsylvania State University, Penn-sylvania (2012).
Tsinoglou, D. and Koltsakis, G., Modelling of the selective catalytic NOx reduction in diesel exhaust
including ammonia storage. Proceedings of the Institution of Mechanical Engineers, Part D: Journal of Automobile Engineering, 221, 117-133 (2007). Vega, E. M., García, S. O., Sanz, F. V. D., Ammonia
selective catalytic reduction of NO in a mono-lithic reverse flow reactor. Chemical Engineering, 24 (2011).
Winkler, C., Flörchinger, P., Patil, M. D., Gieshoff, J., Spurk, P. and Pfeifer, M., Modeling of SCR denox catalyst: Looking at the impact of sub-strate attributes. SAE Transactions, 112, 691-699 (2003).
Yun, B. K. and Kim, M. Y., Modeling the selective catalytic reduction of NOx by ammonia over a
vanadia-based catalyst from heavy duty diesel exhaust gases. Applied Thermal Engineering, 50, 152-158 (2013).
Zürcher, S., Hackel, M. and Schaub, G., Kinetics of selective catalytic NOx reduction in a novel