Introduction
In radiography, the light ield-indicator is generally incorporated in the X-ray equipment to predict the aperture and dimensions of the irradiated ield. Characteristics of this light ield, such as illumination and contrast are typically evaluated according to international standard requirements (International…, 2009) to ensure the lowest possible discrepancies between the light and the X-ray ields. Therefore, the maintenance of an illuminance of at least 100 lux, in a uniform ield with the minimum deined contrast level (International…, 2009) to deine ield edges is important for safety reasons, as the edges
are strongly related to X-ray irradiated area limits and accuracy. Although a methodology based on the ratio of inner and outer illumination in the edge region is provided to determine the acceptable contrast of the light ield, the deinition of its edge is not unambiguously given, and the concept of contrast lacks precise deinition in international standards.
Light-ield indicator type tests
IEC standards are provided for type tests of a wide range of medical electrical equipment used in diagnostic imaging, such as ultrasonography, magnetic resonance and diagnostic X-ray equipment. For the most part, these standards are intended for the basic safety of the equipment and include not only a scope mainly related to electrical, mechanical, thermal and other speciic risks, but also essential performance tests for each medical equipment category. These standards are used for certiication processes all over the world, and are the principal guides for projects, laboratory type tests and production assurance of safety and performance.
A light ield-indicator described by these standards (International…, 2009), is understood to be the device in radiological equipment that delineates the irradiated
Automated and observer based light ield indicator edge evaluation in
diagnostic X-ray equipment
Márcio Bottaro
1*, Balázs Vince Nagy
2,3, Fernanda Cristina Salvador Soares
1, Danilo Cabral Rosendo
11 Institute of Energy and Environment, University of São Paulo, São Paulo, SP, Brazil. 2 Vision Laboratory, Institute of Psychology, University of São Paulo, São Paulo, SP, Brazil.
3 Department of Mechatronics, Optics and Engineering Informatics, Budapest University of Technology and Economics, Budapest,
Hungary.
Abstract Introduction: To analyze edge detection and optical contrast calculation of light ield-indicators used in X-ray via automated- and observer-based methods, and comparison with current standard approaches, which do not give exact deinition for light ield edge determination. Methods: Automated light sensor array was used to measure the penumbra zone of the edge in the standard X-ray equipment, while trained and naïve human observers were asked to mark the light ield edge according to their own determination. Different interpretations of the contrast were then calculated and compared. Results: In contrast to automated measurements of edge deinition and detection, measurements by human observers showed large inter-observer variation independent of their training with X-ray equipment. Different contrast calculations considering the different edge deinitions gave very different contrast values. Conclusion: As the main conclusion, we propose a more exact edge deinition of the X-ray light ield, corresponding well to the average human observer’s edge determination. The new edge deinition method with automated systems would reduce human variability in edge determination. Such errors could potentially affect the approval of X-ray equipment, and also increase the radiation dose. The automated measurement based on human observers’ edge deinition and the corresponding contrast calculation may lead to a more precise light ield calibration, which enables reduced irradiation doses on radiology patients.
Keywords Diagnostic X-ray, Light ield indicator, Edge determination, Radiation protection, X-ray equipment type test.
This is an Open Access article distributed under the terms of the Creative Commons Attribution License, which permits unrestricted use, distribution, and reproduction in any medium, provided the original work is properly cited.
How to cite this article: Bottaro M, Nagy BV, Soares FCS, Rosendo
DC. Automated and observer based light field indicator edge evaluation in diagnostic X-ray equipment. Res Biomed Eng. 2017; 33(2):130-137. DOI: 10.1590/2446-4740.07116
*Corresponding author: Institute of Energy and Environment,
University of São Paulo – USP, Av. Prof. Luciano Gualberto, 1289, Butantã, CEP 05508-010, São Paulo, SP, Brazil. E-mail: marcio@ iee.usp.br
ield with a visible light ield before the more powerful X-ray radiation is applied for medical use. It is therefore, part of the beam limiting device in all diagnostic X-ray equipment, and is normally composed of a lamp with a timer control and a mirror that intercepts the X-ray beam. The same jaws embedded in the X-ray beam-limiting device are used by the light-ield to adjust the irradiation area.
In conventional diagnostic X-ray systems, the light ield is normally an illuminated rectangle with two central axes that enable centering and size control of the X-ray ield. The adjustment of the light ield area in most equipment is manually controlled, and thus, the size of the irradiated area is mainly deined by the operator. Since errors in the determination of those areas (e.g. light ield control uncertainties, incorrect relationship of control marking and ield aperture, jaws misalignments, etc.) are directly related to radiation protection risks, international standards state some type tests regarding illuminance, optical contrast and discrepancies between the light and the X-ray ields.
According to IEC standard 60601-2-54 (International…, 2009), the contrast at the edge of the light ield should be determined by the ratio of the illuminance 3 mm from the edge of the light ield towards the center of the ield, and the illuminance 3 mm from the edge away from the center of the ield. The acceptable contrast values are 3 for mobile equipment and 4 in other categories. The measurement aperture required is 1 mm. For these conditions, the average illuminance provided by the light ield-indicator in the light ield should be above 100 lux or above 160 lux (21CFR1020.31, Food and Drug Administration – FDA) (Food…, 2015) at a 1 m distance. However, this method lacks the exact deinition of the edge of the light ield, which is required to perform optical contrast and discrepancy tests. Moreover, the IEC standard deines the exact position of the X-ray ield’s edge at 25% of the maximum irradiation value, yet the technical basis of this is neither clear nor referenced.
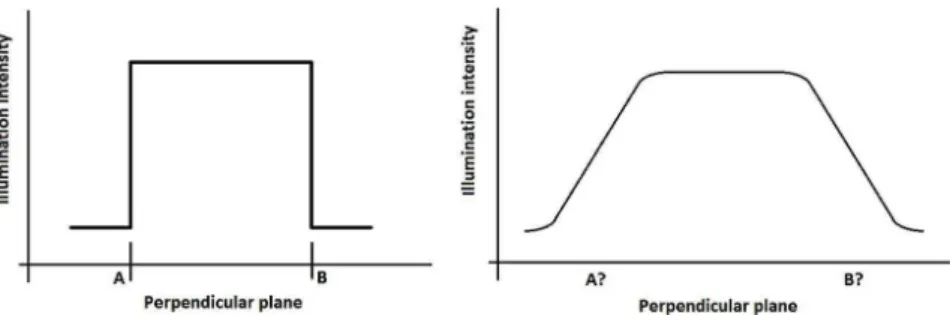
In an ideal situation, the light ield should have very well deined edges with a proile similar to that in Figure 1; left proile. However, due to the characteristics of the beam limiting device, the light ield has no such
ideally deined edges, but a more realistic proile, as shown in Figure 1; right proile.
A transition region with changing illuminance values describes these edges, making it dificult to deine the contrast required by the relevant IEC standard, since this considers a well-deined edge position for the contrast measurement. Our research aimed to analyze how dificult it is for the observers to deine the edge position and how this can affect the resulting contrast values. This transition zone between the dark and light portions of the ield is called the ‘penumbra zone’. The illuminance level related to the contrast requirements in the IEC 60601-2-54 (International…, 2009) suggests a relatively small penumbra zone (less than 6 mm), as it is understood that edge contrast would always be determined with reference points 3 mm towards the center of the illuminated area and 3 mm away from it. In practice, what we observe is that this is not true and penumbra zones normally go beyond 6 mm. Most medical physicists and practitioners usually determine the ield edges, and also the radiation ield edges in X-ray images, as a virtual line at approx. 50% of intensity inside the penumbra zone (Balderson et al., 2011). This is demonstrated in literature for radiotherapy (Balderson et al., 2011; Kron and Ferguson, 2000; Woo and McParland, 2001) but not mentioned for diagnostic purposes. Although the 50% value is the most common reference to determine light ield edges, therapists of radiotherapy procedures tend to choose a faint edge in the light ield, which might contribute to higher irradiated regions and consequently, higher doses, especially in therapy procedures (Kron and Ferguson, 2000). These studies (Balderson et al., 2011; Kron and Ferguson, 2000) also conirm the importance of analyzing the direct effects of irradiated area determination on the Dose Area Product.
In summary, if the penumbra region is suficiently narrow, it would be easy to deine for the human eyes. In contrast, a broader penumbra zone would be more dificult to determine by eye, even for an expert technician, physicist or physician. Therefore, the goal of this study was to verify and compare automated and human-based procedures of determining the light ield edges, and to deine an acceptable width value for the penumbra zone.
Figure 1. Left: Ideal light ield edge’s intensity proile, where A and B show the exact light ield edges in one cross section of the light ield.
Methods
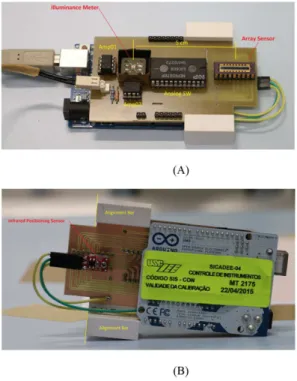
For the purpose of the instrumental light ield edge determination, a measuring system was developed at the IEE/USP Medical Electrical Equipment Laboratory consisting of a photodiode array sensor with 16 elements of 1 mm linear dimensions of sensor area and an integrated illuminance meter. Both of these components were connected to pre-ampliiers to provide adequate electrical signals to the Analog to Digital Converter (ADC) of an ARDUINO MEGA microcontroller board (Figure 2). The photodiode array sensor was connected to a 16-channel Analog Switch Integrated Circuit (IC) to provide a single analog output, improving the ARDUINO ADC sampling rate.
The array sensor was mounted on a circuit board with its central array placed in a convenient distance of 5 cm from the illuminance meter. This distance allows the illuminance sensor to be positioned in the central illuminated area of each four quadrants of the light ield during edge measurements within normal apertures in diagnostic practice (18 x 24 cm, providing quadrants of 9 x 12 cm), as illuminace is measured at each edge to attend the requirements of IEC 60601-2-54 (International…, 2009). Such sensor positioning also allows the illuminance measurement in an alternative aperture of 13 x 13 cm used in the present work for validation purposes.
The measuring system board is coupled into an ARDUINO MEGA microcontroller system, which communicates with a microcomputer and a control and analyzing software (Figure 3) developed using the LabVIEW software (National Instruments, Austin, TX). This software receives all analogical data from the photodiode array and from the illuminance sensor and performs calculations according to the methodology described in IEC 60601-2-54 (International…, 2009), and also provides an output ile with edge proile data for further calculations.
To validate the illuminance meter and photodiode array sensor the system was previously calibrated with a Photometric Bench equipped with a Secondary Standard Incandescent Lamp (FLUXO) for luminous intensity, connected to an OPTRONICS power supply, and a standard illuminance meter (LMT S1000). Calibration was performed at 1 m distance of the Secondary Standard Lamp to reproduce the IEC 60601-2-54 (International…, 2009) measuring setup. Calibration of the photodiode array was performed from 10 to 200 lux to provide edge variations normally found in practical tests, and from 50 to 800 lux, as IEC standard requirements are restricted to a minimal value of 100 lux. Calibration factors were applied into the LabVIEW software for measuring corrections during tests.
The shield board was also equipped with alignment bars and an infrared sensor, aligned with the center of the photodiode array, to enable precise positioning in
Figure 2. Self developed light ield edge detecting system. (A) Top view
with illuminance meter and its pre-ampliier Amp01 and Array sensor with its Analog Switching IC and pre-ampliier Amp02; (B) Bottom view with Infrared Positioning Sensor and Alignment Bars indications.
manual procedures of edge determination as described below (Figure 2B).
To generate the light ield, a conventional diagnostic X-ray equipment was used, which is equipped with a RALCO R302/A beam limiting device, in compliance with IEC 60601-2-54 standard (International…, 2009). Two ield sizes (illuminated areas) were deined: 18x24 cm and 13x13 cm at a 1 m distance. The ield had a distribution in four quadrants and eight edges (edges - from A to H in Figure 3).
Automated measurement procedure
The automated process was performed in a dark room (illuminance lower than 1 lux), where the measuring system was positioned out of the illuminated area, away from the center, moving it towards the center, or moving from the center towards the non-illuminated region, at each of the eight edges for both light ield sizes. The LabVIEW software determined the ideal position range for the measurement by irst identifying constant maximal illuminance within 10% variation (deined as the standard deviation of the illuminance values over their average) at a 3 mm wide zone in the brighter side of the penumbra zone. Second, a 3 mm wide zone with illuminance values of 10% and less of the maximal illuminance was selected at the darker side of the penumbra zone (see Figure 1). The acceptance value was set to the variation coeficient of 10% at the darker side because with lower values, edges were not always determined within the sensor’s available length due to non-uniformities in the illumination ield. For values higher than 10%, edges were considered well inside the penumbra zone, which was visually noticeable.
After registering the edge proile, different decisions can be made for the determination of the exact edge position, as this is not deined by the relevant standards: i) The irst measurement point in the edge proile reaching 10% of the average maximal illuminance or less was selected and the edge was deined at equal distance between this and the neighboring measurement point that had illuminance higher than the 10% (Figure 4 – Nº 1); ii) The edge can be considered as the whole penumbra zone, meaning that the 3 mm distances was measured at the lower 10% and at the higher constant maximal illuminance regions; iii) One could also deine the edge at the 50% illuminance of the penumbra zone (Figure 4 – Nº 3); iv) Following the recommendations for the X-ray radiation ield edges in IEC 60601-2-54, the 25% of the maximum value could be considered as well (Figure 4 – Nº 4). The resulting contrast values were calculated as the ratio of the lower and the higher illuminances at a 3 mm distance from the edge in both directions.
Manual measurement procedure
Twenty-eight observers with no visual problems and good or corrected visual acuity (based on personal interview) participated in the manual tests of identifying the edges of the illuminated areas on a millimeter paper for each light ield and edge. Of the 28 observers, 17 work actively with clinical X-ray equipment, either in the operational ield or in quality control (i.e. “trained” observers). Among them, eight were experts on X-ray type tests and diagnostic quality control assessment at IEE/USP. Thus, 11 observers were “naive” to the task. The tests were carried out in accordance with the Declaration of Helsinki for experiments involving
Figure 4. Possible edge deinitions of the light ield and the related illuminance measurement locations for contrast calculation. Vertical lines with
humans, and informed consent was obtained from all participants.
The participants stayed in the dark room for a few minutes, during which they were instructed about the task. Their task was to mark the edges of the light ield according to their observation and personal deinition, without giving any hints about speciic edge deinition. After marking all eight edges with a thin black pen, the measuring device was positioned on top of the markings to measure the transition. The procedure was repeated for both light ield sizes in a random order.
Results
Automated edge evaluation
Using the self-developed measurement equipment, we evaluated the detection of eight different edges of two illuminated areas (18x24 cm and 13x13 cm). The evaluation was repeated ive times with repeated adjustment to the size of the illuminated areas.
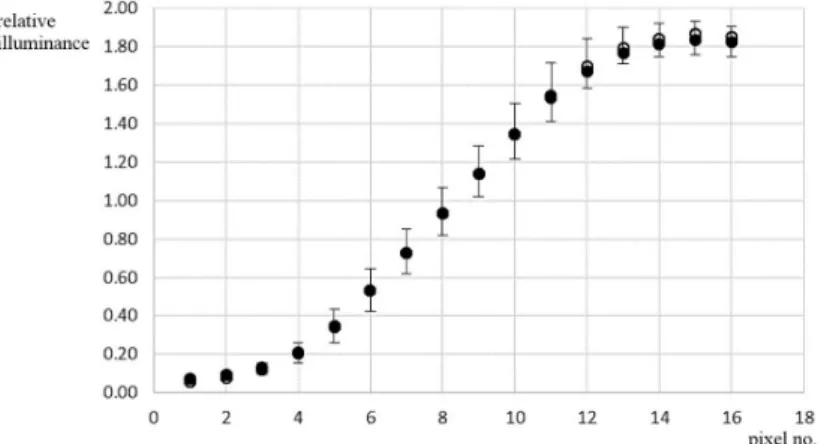
Figure 5 shows the average and standard deviation of the results (n = 40) for both areas. It indicates that there was practically no difference between the two (p >> 0.05 for all detectors with Student’s t-test comparison). At the same time, the standard deviation of the measured values was slightly smaller for the area of 18x24 (0.08 ± 0.04) than for the area of 13x13 (0.10 ± 0.05). This was most likely due to differences in the size adjustment performed by the same technician on the scale of the equipment. Manual evaluation of the illuminated area edges
The manual marking results for the 13x13 area, showed on average, similar patterns to the 18x24 area. However, the general edge determination at the 13x13 light ield was done closer to the light ield than in the case of the 18x24 area (Figure 6).
The individually marked edges by the 28 observers showed that three (no. 2, 7 and 13) of the 28 observers (one with expertise on X-ray equipment and two without) had marked the edges around the 50% illuminance level in both light ield sizes. On the other hand, 25 observers indicated the edge close to the dark region. There were relatively large inter-individual variations in the exact edge determination, but the individual deinition of the edge in the penumbra zone stayed the same for all observers when marking the eight edges in both light ield sizes.
For a more detailed analysis and contrast calculations, we separated the results of the three observers who marked inner (‘IN’) edges (around 50% of the maximal illuminance) from the 25 subjects who marked outer (‘OUT’) edges (close to the dark zone). It can be seen in Figure 7 that the average of the three ‘IN’ manual results practically coincided with the automated measurement proiles, whereas the ‘OUT’ results were clearly more inside the darker part of the penumbra zone. The majority of the human observers (‘OUT’) marked the light ield edge at approximately 7% relative to the maximum illuminance value acquired by the automatic measurement (Figure 7 – dotted line).
Contrast values calculated with the relative illuminance values 3 mm either side of the possible edges (Figure 4) are shown in Table 1 for the automated measurements together with the values based on the average of the manual markings. Contrast values from manual edge determination by the majority of the observers was close to the contrast calculation with the 10% method, even though there were differences between the manual markings of the two areas (see discussion). If the markings were considered around the 50% illuminance level (‘IN’) the resulting contrasts would, in most cases, stay below the acceptance levels of the relevant standard (International…, 2009).
Figure 5. Average edge zones with the automated method. The illed points represent the average values for the 18x24 area and the circles for
Discussion
Based on our results, we can state that most manual edge markings made by human observers were generally estimated at the initial rise of the penumbra area, where the illumination starts. The majority of the observers, independent of their expertise with X-ray equipment, marked the edges close to the 10% of the maximal illuminance value, contradicting the indings of the literature with physicist observers, who tend to ind edges at 50% of the maximal illuminance value (Kron
and Ferguson, 2000). Thus, the 10% relative illuminance criterion (considering the exact determination of the maximal value as described in the methods) could be a good candidate for a more speciic edge deinition in light ield-indicators for diagnostic X-ray equipment. Along with the relatively large variations in human edge markings compared to the automatic method (Kron and Ferguson, 2000), our study revealed that the size of the light ield also introduces human differences. Scientiic literature in the area of experimental psychology indicates the effect of area size and edge on brightness perception (Davidson and Whiteside, 1971; Grossberg and Mingolla, 1985; MacEvoy et al., 1998). Although the analysis of such a psychophysical phenomenon is not the aim of this study, we suggest the indings in human edge deinition to be closer to the illuminated area when the total area is smaller. This might come from an underlying perceptual and/or psychophysical phenomenon. Therefore, human perceptual effects can inluence edge detection and can cause discrepancies where exact edge deinition is needed.
Figure 6. Relative illuminance proiles of the average manual edge markings as indicated by the majority of the observers. The difference in the
curves indicate that the manual edge detection was closer to the light ield in the case of the smaller (13x13) size.
Figure 7. Automatic (bold) and manual (18x24) measures of the edges for observers marking at the dark side of the penumbra zone (OUT – majority
of the observers) and at around 50% illuminance (IN – minority of the observers). The dotted horizontal line indicates the relative illuminance level where the edge was marked in the manual OUT case.
Table 1. Calculated contrast values based on the edge detection.
Area 18x24 cm2 13x13 cm2
Cman,OUT 5.0 ± 2.0 9.7 ± 4.4
Cman,IN 3.7 ± 2.0 2.3 ± 0.7
Cauto,50% 3.0 ± 0.58
Cauto,penumbra 26.5 ± 7.9
Cauto,25% 7.3 ± 0.9
Using the markers of the majority of the observers, the resulting contrast was very different from those of the minority of the observers, who marked the edge at the transition zone (at 50% illuminance), or from the results of the method when the whole penumbra zone was considered as the edge. In comparison, the contrast calculated with the edge at the 25% deinition, adopted for X-ray ield edges determination, did not differ much from that calculated with the 10% method; however, the 25% selection is quite different from the majority of the manual markings (i.e. 7% of the maximal illuminance).
Given that the illumination area coincides with the outer limits of the X-ray irradiated area, the edges marked by the majority of the observers would result in under-irradiation. This was also observed by Brookfield et al. (2015) with pelvic radiography procedures, which concluded that even small collimator errors would result in Dose Area Product (DAP) increase. If we considered that the edges of the minority of observers (who marked them at 50% illuminance level) would open the light ield more than the majority of observers (close to the light ield start), the overall dose would be in a larger area, since there would be irradiation outside the markings as well.
According to Kisielewicz et al. (2011) there is a linear relationship between DAP and patient dose (Entrance Surface Dose - ESD) in diagnostic X-ray procedures. DAP and ESD are also linearly related to phantom thickness, tested from 14.5 cm to 35 cm. In a very simple example, a 3 mm increase (considering a 6 mm penumbra zone), for the 18x24 cm2 selection (43,200.00 mm2 area), would
increase the area with 2,556.00 mm2. This corresponds
to approximately 5.9% increase in (DAP), which is the result of human adjustment, very close to the indings of Brookfield et al. (2015). Moreover, if the calibration between the irradiated and illuminated areas is done by someone adjusting the illumination window to the transition (50%) or to the 25% of the penumbra zone, further adjustments of the illumination windows to the outer limits (i.e. 7%) of the illuminated area by other technicians would generate X-ray images that are too small, potentially missing parts of the body area to be irradiated. This latter situation might result in necessary repetition of the irradiation attempt, increasing the overall dosage (Brookfield et al., 2015). All these factors increase the risk of giving extra doses unnecessarily because of human light ield adjustment, which could be avoided if there was a clear edge deinition and/or automated edge detection.
The width of the penumbra zone also inluences contrast calculations, independent of the edge deinition. Thus, the maximal size of the penumbra width should be a set parameter, based on the DAP discussions above. Together with a clear edge deinition, the current contrast acceptance limits (± 3mm from the edge) should generally
result in a small penumbra zone. Still, the penumbra zone of the illumination system could be potentially reduced with inclusion of imaging optics to reduce the blur of the light ield edges.
In conclusion, in this study we propose a clearer deinition of the light ield edge, also for the IEC 60601-2-54
(International…, 2009) requirements. The ield edge
reference point deinition is proposed to be 10% of the maximum illuminance level and a penumbra zone limit, which is related to DAP to increase safety limits. We also propose an automated measurement procedure that simultaneously provides contrast results close to general human observation, and avoids human introduced variations:
Light ield edge should be indicated at the locus where illuminance is 10% of the maximum level (considered to be uniform over the illuminated area except for the penumbra zones). To deine the light ield edge it is necessary for an accurate measurement to have at least 3 mm of dark zone (region lower than 10% of the maximal illuminance) and 3 mm of maximal uniform illuminance zone (light ield inner region with 10% variation coeficient over the range); Penumbra zones should have a maximum width
to limit DAP increase at 10%;
The edge proile must be measured with a light sensor array properly validated with a standard light source, with an adequate (<= 1mm) aperture. The penumbra zone of the illumination system could be potentially reduced with inclusion of imaging optics to reduce the blur of the light ield edges. This concept could be the topic of further studies, as although this purpose is relevant, it shall take into consideration the impacts on radiation quality and performance of the introduction of new elements for optical enhancement in the light ield-indicator that would directly affect the X-ray ield and equipment performance.
Acknowledgements
The Authors report of no conflict of interest. The authors would like to thanks CAPES for inancial support (grant# 3263/2013).
References
Balderson MJ, Spencer DP, Nygren I, Brown DW. Quality assurance using a photodiode array. Journal of Applied Clinical Medical Physics. 2011; 12(2):191-200. PMid:21587181.http:// dx.doi.org/10.1120/jacmp.v12i2.3358.
Davidson M, Whiteside JA. Human brightness perception near sharp contours. Journal of the Optical Society of America. 1971; 61(4):530-6. PMid:5546717.http://dx.doi.org/10.1364/ JOSA.61.000530.
Food and Drug Administration. Code of Federal Regulations Title 21. Food and Drugs. Part 1020. Performance Standard for Ionizing Radiation Emitting Products [Internet]. Maryland: FDA; 2015. Section 1020.31. Radiographic Equipment. [cited 2017 May 01]. Available from: https:// www.accessdata.fda.gov/scripts/cdrh/cfdocs/cfcfr/CFRSearch. cfm?fr=1020.31.
Grossberg S, Mingolla E. Neural dynamics of form perception: boundary completion, illusory figures, and neon color spreading. Psychological Review. 1985; 92(2):173-211. PMid:3887450. http://dx.doi.org/10.1037/0033-295X.92.2.173.
International Electrotechnical Commission. IEC 60601-2-54:2009 - medical electrical equipment. particular requirements for the
basic safety and essential performance of X-ray equipment for radiography and radioscopy. Genebra: IEC; 2009.
Kisielewicz K, Truszkiewicz A, Wach S, Wasilewska-Radwańska M. Evaluation of dose area product vs. patient dose in diagnostic X-ray units. Physica Medica. 2011; 27(2):117-20. PMid:20674429.http://dx.doi.org/10.1016/j.ejmp.2010.07.001. Kron T, Ferguson S. Where is the light field edge: perception of different operators on different surfaces. Medical Dosimetry. 2000; 25(2):99-103. PMid:10856689.http://dx.doi.org/10.1016/ S0958-3947(00)00036-4.