RBRH, Porto Alegre, v. 22, e47, 2017 Scientiic/Technical Article
http://dx.doi.org/10.1590/2318-0331.0217170006
São Francisco river Integration Project, Eastern Axis: losses analysis and performance
indicators
Projeto de Integração do Rio São Francisco, Eixo Leste: analise de perdas e indicadores de desempenho
Emmanuel Eduardo Vitorino de Farias1, Wilson Fadlo Curi1 and Laudízio da Silva Diniz2 1Universidade Federal de Campina Grande, Campina Grande, PB, Brazil
2Companhia de Água e Esgotos da Paraíba, João Pessoa, PB, Brazil
E-mails: eduboavista@gmail.com (EEVF), wfcuri@gmail.com (WFC), laudizio@terra.com.br (LSD)
Received: January 09, 2017 - Revised: May 07, 2017 - Accepted: June 05, 2017
ABSTRACT
Water scarcity is an old problem in the brazilian Northeast semiarid region and limits the economic and social development of the region. To mitigate negative impacts of this situation, the National Integration Ministry elaborated the São Francisco River Integration Project (PISF). The State of Paraíba will beneit from this project through the East Axis and West Axis water transposition systems’ from the São Francisco river. The Paraíba riverbasin will receive the waters of the São Francisco river through the Eastern Axis, since the project foresees that, from the city of Monteiro-PB, the water will be transported through the bed of the Paraíba river. This type of transport will cause high water losses. The present work analyzes water distribution scenarios in terms of water losses, which were simulated with the Acquanet model. The irst scenario simulates the current situation, without water transposition of PISF, and the other ones evaluate different ways of distributing the waters of the East Axis among the Paraíba river bed and different pipelines construction scenarios. The results have shown that the construction of pipelines will reduce water losses and increase social gain, through the increase of the beneited population.
Keywords: São Francisco; AcquaNet; Losses analysis.
RESUMO
A escassez hídrica é um problema antigo no semiárido nordestino brasileiro e limita o desenvolvimento econômico e social da região. Para mitigar impactos negativos desta situação o Ministério da Integração Nacional elaborou o Projeto de Integração do Rio São Francisco – PISF. O estado da Paraíba será beneiciado com este projeto pelos sistemas de transposição de águas do rio São Francisco através do Eixo Leste e do Eixo Oeste. A bacia hidrográica do Rio Paraíba receberá as águas do rio São Francisco através do Eixo Leste, sendo que o projeto prevê que, a partir da cidade de Monteiro-PB, as águas serão transportadas através do leito do rio Paraíba. Esse tipo de transporte acarretará elevadas perdas hídricas. O presente trabalho analisa o desempenho de cenários de distribuição destas águas em termos de perdas hídricas, que foram simuladas com o modelo AcquaNet. O primeiro cenário a situação atual, sem a transposição das águas do PISF e os demais avaliam diferentes formas de distribuir as águas do Eixo Leste entre o leito do rio Paraíba e diferentes cenários de construção de adutoras. Os resultados demonstram que a construção de adutoras reduzirá perdas hídricas e aumentará o ganho social, através do aumento da população beneiciada.
INTRODUCTION
Water scarcity is a reality in the northeast of the semi-arid region, where many cities are on the edge of a water collapse and operate under a rationing system. This problem is aggravated by population growth and industrial and agricultural activities, together with a decrease in the availability of drinking water, caused by pollution, deforestation and climate change. These factors limit the economic and social development of this region, since water is an indispensable resource in practically all economic activities.
Within this context, with prolonged droughts, the reservoirs of the Paraíba river basin are generally in critical condition. Its main reservoir, the Epitacio Pessoa, also known as Boqueirão, which is responsible for supplying 17 cities, including Campina Grande, with an estimated population of 407,754 inhabitants (IBGE, 2016), has already operated in its dead storage volume, with about 3.6% of its capacity in 2017, reaching the lowest volume in its history. The other reservoirs in this basin have already reached the following volumes: Camalaú 6%, Poções 0.8%, Acauã 6% (AESA, 2007). This demonstrates that this basin shows great water vulnerability and can lead to a total collapse in the water supply if the rains are not enough to recover the water stocks in its main reservoirs. In this chaotic scenario, the only way to guarantee the water supply of these cities is the exogenous low coming from the Integration Project of the São Francisco River - PISF. Because it is a water that involves high costs of transposition, it is necessary to make a good use of this resource, in particular, minimizing water losses.
However, in its original conception, the Ministry of National Integration together with the state government intend to transport the PISF water through the Paraíba river bed. Such a procedure will signiicantly increase the water losses, during its transit, through iniltration and evaporation processes, reducing the water availability to the inal consumer of the PISF. Since the lost water has a relatively high ixed cost, a feasible solution to reduce losses is to make use of pipelines to transport part of this low from dams belonging to the Paraíba river basin, in order to supply the largest possible number of cities, widening the project range reach and improving the rational use of water, guaranteeing social and economic gains.
In this work, seven PISF water distribution scenarios in the Paraíba river basin simulations were performed, using the mathematical model AcquaNet (USP, 2002), which is based on low network. For each scenario, the operational policy and the quantiication of its water losses related to iniltration, evaporation and reservoir spilling, resulting from PISF directives, were evaluated in a system composed of four reservoirs in a row in the Paraíba River.
MATERIAL AND METHODS
Study ield
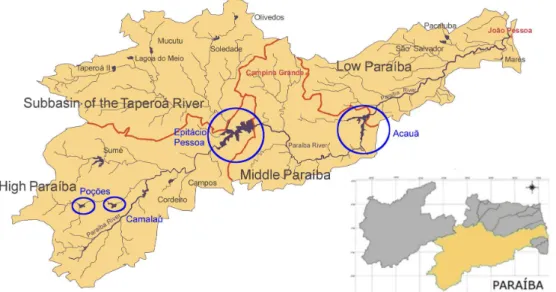
The Paraíba River Basin has an coverage area of 20,071.83 km2 (PARAÍBA, 2004). Due to its great geographic extent and climatic and physical diversities, the Paraíba River basin was divided into a sub-basin of the Taperoá River, which is an afluent river to the system, and in three hydrographic regions: Alto Paraíba, Médio
Paraíba and Baixo Paraíba. Its area includes 71 municipalities that hold a population of 1,866,521 inhabitants, corresponding to 52% of the population of the State. This basin has, along the Paraíba River, four reservoirs in a row: Poções with a capacity of 30 hm3, Camalaú with a capacity of 46 hm3, Epitácio Pessoa, known as Boqueirão, with a capacity of 412 hm3, and Argemiro Figueiredo, known as Acauã, with a capacity of 253 hm3.
From the Epitácio Pessoa dam two water supply systems are derived: the Gravatá system with 60 km pipeline extension, which supplies the municipalities of Campina Grande, Queimadas, Galante, Caturité, Pocinhos, Riacho de Santo Antonio, Barra de Santana, Barra de São Miguel; and the Cariri water supply system with 160 km of pipeline extension, which serves the municipalities of Boqueirão, Cabaceiras, Boa Vista, Soledade, Seridó, São Vicente do Seridó, Olivedos, Juazeirinho, Cubatí and Pedra Lavrada. According to data from AESA (2016), the reservoir has already operated in its dead storage volume, with an imminent risk of water collapse. In this case, the supply would be guaranteed by the exogenous PISF low.
The Acauã dam was completed in 2002. This reservoir was designed to supply the cities of Itabaiana, Salgado de São Felix, Natuba and Itatuba, and to reinforce the integrated supply system of Campina Grande and to control loods in the lower course of the Paraíba River.
According to AESA (2007), the Paraíba River basin will receive from the PISF a continuous low of 4,200 L.s-1, which may reach 10,000 L.s-1. The maximum value should be reached if the catchment basin is in recurrent periods of scarcity and the Sobradinho reservoir, located in the São Francisco river with a capacity of 28,669 hm3, is spilling.
Figure 1 shows the Paraíba river basin, with its main reservoirs.
Methodology
General description
Input data
For the present study the input data were:
1. Month average of precipitations and evaporations data, for each simulated reservoir;
2. Curves quota x area x volume for the reservoirs under study;
3. Series of luviometric data, in monthly scale for the
simulated period;
4. Percentage of losses in transit for each section of the studied river;
5. Requests for water supply and irrigation on a monthly basis;
6. System priorities with values ranging from 1 to 99 (the lower the value the higher the priority.
Data from items 1 to 5 were provided by AESA (2007).
a) Climatic and luviometric data
For reservoirs, the input data are precipitation, evaporation and curves quota x area x volume. Precipitation and evaporation data were obtained from the monthly averages of the pluviometric stations closest to the reservoirs under study, as presented in Table 1. All these data were made available by the AESA.
According to AESA (2007), the water losses in transit along the Paraíba river bed due to iniltration and evaporation is of the order of 14% between Poções and Boqueirão reservoirs (Alto Paraíba) and 22% for the section between Boqueirão and Acauã (Médio Paraíba).
Fluviometric data were provided by AESA (2007). This series of data, is in monthly scale that goes from January 1933 to December 1991, totaling of 59 years.
Figure 1. Paraiba river basin with its main reservoirs. Source: AESA (2007).
b) Demand data
b.1) Irrigation demand
Based on PDRH-PB (PARAÍBA, 2001), the estimated irrigation water demand was 0.45 l.s-1.ha-1, which is assumed not
to have changed signiicantly, given the recurrent water shortage in the region. The considered irrigated areas were those of irrigated public perimeters, in the vicinity of the studied system. The irrigated areas are shown in Table 2.
b.2) Supply demand
The supply water demand was estimated based on the estimated population growth, with a project horizon for the year 2035 and per capita consumption.
For population growth, the demographic growth trends method was used. This method consists of dividing a larger area, where its estimative is already known, into smaller areas. The Brazilian Institute of Geography and Statistics (IBGE, 2016) made the population estimate of Brazil (bigger area) until the year 2050 using the method of demographic components. Their results served as data base to estimate the population of the cities of interest.
The criteria adopted by the Companhia de Água e Esgoto da Paraíba - CAGEPA (2011) were used to estimate per capita consumption, plus supply losses. It adopts that the losses of the supply system of Paraíba are of the order of 40%. The criteria adopted by CAGEPA for estimating per capita consumption vary according to population and are presented in Table 3.
Hydric demand scenario
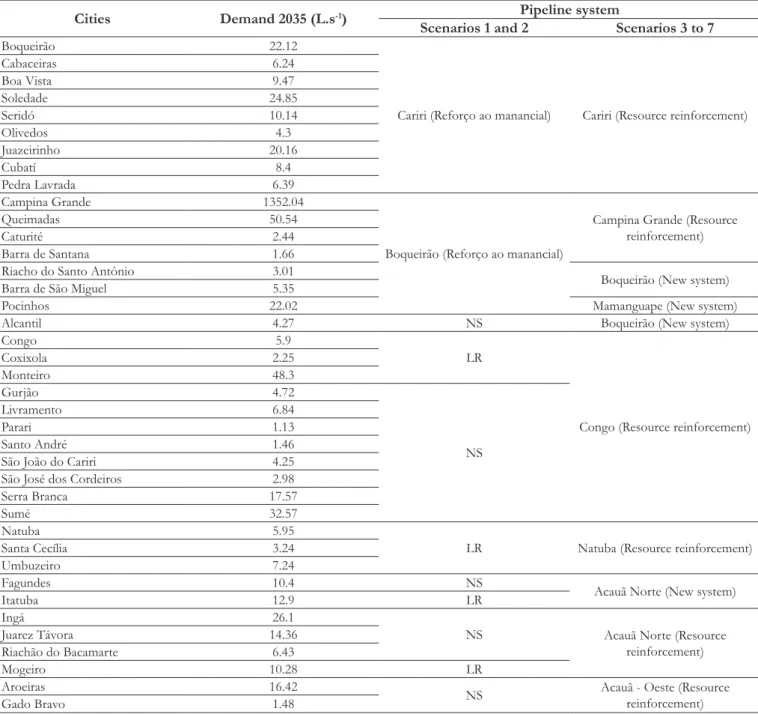
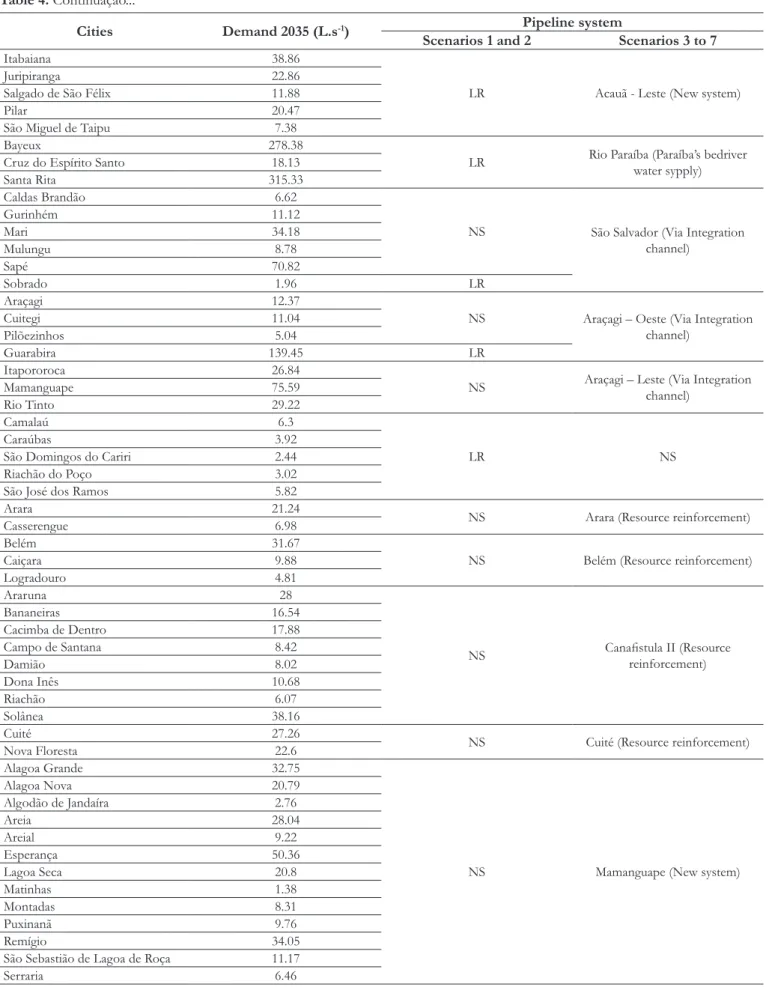
The following scenarios have the function of quantifying the losses by evaporation, iniltration and reservoirs spilling processes of the exogenous low of PISF that will occur along the Paraíba River. For this, seven scenarios of water demands were studied. The simulated municipalities in each scenario, with their respective pipeline system, are presented in Table 4.
O The summary of lows, demands and the water paths of pipeline systems for each simulated scenario are presented in Table 5. The pipeline traces of the simulated systems are shown in Figures 3 and 4.
a) Scenario 1
This scenario consists of the initial proposal of the Ministry of National Integration, without increasing the PISF low and was based on the following speciications:
According to the PISF, all municipalities’ water demands along the PISF axes must be met with local water resources or with transposed water. As a criterion, the PISF foresees that all sites located 10 km from the axes should have a guaranteed water supply to the population and urban economic activities. In addition to these cities, cities with more than 50,000 inhabitants located up to 50 km from the PISF axes should be treated equally (ANA, 2005, p. 20). The municipalities that meet these speciications are presented in Table 4, with their respective water demands. The only municipality with more than 50 thousand inhabitants where its cityhall is located more than 10 km from the axis of the Paraíba River is Guarabira. Existing pipeline systems were also considered. Total system demand equals 2,539.27 l/s.
b) Scenario 2
It differs from Scenario 1 because of the increase in the exogenous low from the São Francisco river. After meeting the demands, the rest of this PISF low will serve as an ecological low. From the Acauã reservoir onwards, these waters can still be used as reinforcement for the water supply of João Pessoa and for the integration channel.
In this scenario there is no construction of new channels and pipelines, reducing the amounts to be invested, since the PISF low will be fully transported by the Paraíba River. However, the disadvantage will be in the high water losses in the system by evaporative and spillage processes, since the PISF waters will raise Table 3. The criteria adopted by CAGEPA (2011) for estimating per capita consumption.
# Number of inhabitants (P)
Consumption (L.inh-1.day-1) Per capita Per capita +40% of losses
P ≤ 50.000 120 168
50.000>P≥150.000 150 210
P>150.000 200 280
Table 1. Month average of precipitation and evaporation. Reservoirs Average
(mm) Jan. Feb. Mar. Apr. May June July Aug. Sept. Oct. Nov. Dec.
Poções Precipitation 32.8 70.2 128 96.1 55.1 31.5 18.2 7.9 3.7 8.6 11.8 15.5
Evaporation 233 178 156 116 115 127 156 206 239 263 266 273
Camalaú Precipitation 50.5 83.8 144 139 65.7 36.5 34.1 17 10.1 6.5 14.3 23.4
Evaporation 233 178 156 116 115 127 156 206 239 263 266 273
Boqueirão Precipitation 27.5 54.2 81.5 98.4 57.4 56.2 5.5 20.7 12.2 4.6 6.8 16
Evaporation 192 155 195 163 178 130 109 143 166 237 212 228
Acauã Precipitation 35.7 48.7 92.6 108 74.6 74.3 88.8 39.3 22.5 9.9 9.8 25.5
Evaporation 147 132 108 88 102 65 73 105 126 154 151 165
Table 2. Irrigated public perimeter demand. Irrigated
Perimeter Area (ha) Water Demand (L.s -1)
Poções 356 160.20
Congo 156 70.20
Vereda Grande 289 130.05
Table 4. Simulated cities on the scenarios.
Cities Demand 2035 (L.s-1) Pipeline system
Scenarios 1 and 2 Scenarios 3 to 7
Boqueirão 22.12
Cariri (Reforço ao manancial) Cariri (Resource reinforcement)
Cabaceiras 6.24
Boa Vista 9.47
Soledade 24.85
Seridó 10.14
Olivedos 4.3
Juazeirinho 20.16
Cubatí 8.4
Pedra Lavrada 6.39
Campina Grande 1352.04
Boqueirão (Reforço ao manancial)
Campina Grande (Resource reinforcement)
Queimadas 50.54
Caturité 2.44
Barra de Santana 1.66
Riacho do Santo Antônio 3.01
Boqueirão (New system)
Barra de São Miguel 5.35
Pocinhos 22.02 Mamanguape (New system)
Alcantil 4.27 NS Boqueirão (New system)
Congo 5.9
LR
Congo (Resource reinforcement)
Coxixola 2.25
Monteiro 48.3
Gurjão 4.72
NS
Livramento 6.84
Parari 1.13
Santo André 1.46
São João do Cariri 4.25
São José dos Cordeiros 2.98
Serra Branca 17.57
Sumé 32.57
Natuba 5.95
LR Natuba (Resource reinforcement)
Santa Cecília 3.24
Umbuzeiro 7.24
Fagundes 10.4 NS
Acauã Norte (New system)
Itatuba 12.9 LR
Ingá 26.1
NS Acauã Norte (Resource
reinforcement)
Juarez Távora 14.36
Riachão do Bacamarte 6.43
Mogeiro 10.28 LR
Aroeiras 16.42
NS Acauã - Oeste (Resource
reinforcement)
Gado Bravo 1.48
Legend: LR= supply from Paraiba river bed; NS = not reached by this simulation scenario.
the water levels of the reservoirs, increasing the liquid surface, and there will still be losses in the transport due to the iniltration. Due to the water uncertainties, this scenario was simulated with a target volume in the reservoirs equal to its maximum.
The following scenarios were proposed by the AESA (2007), where a fraction of the PISF low goes through pipeline systems and the rest will be transported by the Paraíba River. Two paths of pipeline systems were proposed, as shown in Figures 3 and 4. In both cases, the localities will beneit from new pipeline systems or by reinforcement of the existing ones. These scenarios comprise 108 municipalities totaling a demand of 3,649.55 l/s. The served municipalities with their respective water demands are presented in Table 4. In scenarios 2 to 7, the target volume of the reservoirs is 30% of their maximum volumes. This value was deined to
minimize leakage losses, since the increase in PISF generates water safety, and it is no longer necessary to operate the reservoirs with the maximum possible volumes.
In Figures 3 and 4, Q1 is the PISF low from the Poções dam, Q2 is the PISF low from the Epitácio Pessoa reservoir (Boqueirão) and Qr is the PISF low that will be transported through the Paraíba river bed from the Poções reservoir.
c) Scenario 3
This scenario considers a low of 4,200 L.s-1 of PISF, from the Poções reservoir, and the trajectory of the pipeline is shown in Figure 3. It foresees for the construction of a pipeline with a maximum capacity equal to Q1 = 2,000 L.s-1 to meet the
Cities Demand 2035 (L.s-1) Pipeline system
Scenarios 1 and 2 Scenarios 3 to 7
Itabaiana 38.86
LR Acauã - Leste (New system)
Juripiranga 22.86
Salgado de São Félix 11.88
Pilar 20.47
São Miguel de Taipu 7.38
Bayeux 278.38
LR Rio Paraíba (Paraíba’s bedriver water sypply)
Cruz do Espírito Santo 18.13
Santa Rita 315.33
Caldas Brandão 6.62
NS São Salvador (Via Integration
channel)
Gurinhém 11.12
Mari 34.18
Mulungu 8.78
Sapé 70.82
Sobrado 1.96 LR
Araçagi 12.37
NS Araçagi – Oeste (Via Integration
channel)
Cuitegi 11.04
Pilõezinhos 5.04
Guarabira 139.45 LR
Itapororoca 26.84
NS Araçagi – Leste (Via Integration
channel)
Mamanguape 75.59
Rio Tinto 29.22
Camalaú 6.3
LR NS
Caraúbas 3.92
São Domingos do Cariri 2.44
Riachão do Poço 3.02
São José dos Ramos 5.82
Arara 21.24
NS Arara (Resource reinforcement)
Casserengue 6.98
Belém 31.67
NS Belém (Resource reinforcement)
Caiçara 9.88
Logradouro 4.81
Araruna 28
NS Canaistula II (Resource reinforcement)
Bananeiras 16.54
Cacimba de Dentro 17.88
Campo de Santana 8.42
Damião 8.02
Dona Inês 10.68
Riachão 6.07
Solânea 38.16
Cuité 27.26
NS Cuité (Resource reinforcement)
Nova Floresta 22.6
Alagoa Grande 32.75
NS Mamanguape (New system)
Alagoa Nova 20.79
Algodão de Jandaíra 2.76
Areia 28.04
Areial 9.22
Esperança 50.36
Lagoa Seca 20.8
Matinhas 1.38
Montadas 8.31
Puxinanã 9.76
Remígio 34.05
São Sebastião de Lagoa de Roça 11.17
Serraria 6.46
Legend: LR= supply from Paraiba river bed; NS = not reached by this simulation scenario.
Cities Demand 2035 (L.s-1) Pipeline system
Scenarios 1 and 2 Scenarios 3 to 7
Duas Estradas 5.5
NS Pirpirutuba (Resource
reinforcement)
Lagoa de Dentro 8.25
Pirpirituba 15.3
Serra da Raiz 3.89
Serraria 6.46
Borborema 8.25
Sertãozinho 9.73
Cacimbas 3.23
NS Serra de Teixeira (Resource reinforcement)
Desterro 9.81
Imaculada 9.7
Mãe d’Água 4.68
Maturéia 10.58
Taperoá 24.04
Teixeira 27.27
Barra de Santa Rosa 13.75
NS Seridó (New system)
Sossego 4.08
Baraúna 9.34
Nova Palmeira 9.34
Frei Martinho 3.32
Picuí 26.52
Legend: LR= supply from Paraiba river bed; NS = not reached by this simulation scenario.
Table 4. Continuação...
Figure 3. Alternative 1 for the paths of the water pipeline systems, AESA (2007). Table 5. Flow rate and alternative to water transport.
Scenario Flow (L.s
-1) Demand
(L.s-1) Water transport
PISF Qr Q1 Q2
1 - - - - 2,540 River
2 4,200 4,200 - - 2,540 River
3 4,200 2,200 2,000 - 3,650 Alternative 1
4 4,200 2,150 250 1,800 3,650 Alternative 2
5 4,200 3,080 1,120 - 3,650 Alternative 1
6 4,200 2,950 250 1,000 3,650 Alternative 2
The remains follows along the bed of the Paraíba river with a low of Qr = 2,200 L.s-1.
d) Scenario 4
This scenario considers a low of 4,200 L.s-1 of the PISF and the pipelines will follow the lines of Figure 4, where the central axis set out in Scenario 3 is withdrawn and it is maintained the pipeline to the Serra de Teixeira, with a maximum low equal to Q1 = 250 L.s-1. The rest would be released on the Paraíba
River. From the Epitácio Pessoa Dam, a reinforcement low to the pipeline system of Campina Grande would come out. This pipeline would still supply the regions of Brejo, Curimataú and Seridó, with a maximum expected low for Q2=1,800 L.s-1.
e) Scenario 5
The PISF low for this scenario will be 4,200 L.s-1 and the lines of the pipeline system is the same as the one shown in Figure 3. This alternative differentiates from Scenario 3 by eliminating the reinforcement low to Campina Grande from the PISF central axis and placing it from the Epitacio Pessoa dam. In this scenario, a maximum low of Q1 = 1,120 L.s-1 was transported by pipeline
from the Poções reservoir and the remainder of the low would be transported through the river bed, ie, Qr=3,080 L.s-1.
f) Scenario 6
This scenario considers a low of 4,200 L.s-1 of the PISF and the route of the pipeline system is shown in Figure 4, where Q1 = 250 L.s-1 to meet the required low to the Serra de
Teixeira Axis. The water supply of the Brejo, Curimataú and Seridó regions would be done by means of a pipeline system from the Epitácio Pessoa dam with a maximum capacity equal to Q2 = 1,000 L.s-1, but without the inclusion of the Campina Grande reinforcement.
g) Scenario 7
This scenario considers a PISF low of 10,000 L.s-1. From the Poções reservoir, the trajectory of the pipeline system is the same as shown in Figure 3. It foresees for the construction of a pipeline system with a maximum capacity of Q1 = 2,000 L.s-1,
to meet water demand of the regions of Serra de Teixeira, Brejo, Curimataú, part of Cariri and Seridó and reinforce the low to the Campina Grande system. The remainder would follow along the bed of the Paraíba river, with Qr = 8,000 L.s-1. It has the
purpose of evaluating the maximum low rate in Acauã with 100% guarantee to meet the Integration Channel.
System performance indicators
Water resources projects use a large amount of data, which makes the direct comparison between different management proposals a very dificult task. To make a comparison it is necessary to create evaluation parameters that retain only essential data, which are called of performance indicators.
a) Reliability
Reliability (Conf) is the probability that all demands are met without failure, that is, it is the percentage of time that all the water demands were met.
S t
N Conf prob{V S}
N
= ∈ = (1)
Where:
b) Resilience or elasticity
Resilience (res) is used to evaluate the average of how quickly the system returns from a failure (F) state to a satisfactory (S) demand-service state. The resilience of the reservoir is the probability of a satisfactory state occurring in period t + 1 (Vt+1) given an unsatisfactory value in period t.
t+1
res=Prob{V ∈S / Vt∈F} (2)
Where:
res: is the number of times the reservoir exits a fault/total number of faults.
In some cases a system that has many failures is preferable, since it recovers quickly, than one that has few failures and that recovers slowly.
c) Vulnerability
Vulnerability (vul) indicates how severe the magnitude of the system failure is, if it has occurred. It can be deined as the average of the percentage of water deicits of all values of the set F. Mathematically we have:
t t t t V Vd 1 vul nf Vd −
= ∑ (3)
Where:
nf: is the number of failure events, Vt is the supplied water at time t and Vdt is the demand required at time t.
d) Sustainability
Loucks (1997) apud Vieira (2007), proposed a general sustainability index (Sust) deined by:
Sust = Conf * res * (1-vul) (4)
e) Eficiency indexes associated to the reservoirs
In this work, the eficiency indexes associated to the reservoirs are used to compare scenarios of water demand with and without PISF under different forms of water transportation. Through them, it is aimed to determine which scenarios have obtained the lowest losses in the system, be they by spilling, by evaporation or in transit through iniltration, and also to evaluate the water yields of each scenario.
The following are some eficiency indicators associated with reservoir operation. These indicators are based on its water balance equation.
ηVr - relation between the volumetric variability of the reservoir and the total annual afluent volume. This index indicates the interannual variability of the reservoir volume.
final inicial Vr Vr Vr Qat Pt − η = +
∑ ∑ (5)
Where:
Vrinicial e Vrinal: are the initial and inal volumes of the reservoirs
respectively. Qat and Pt are respectively the monthly afluent and precipitated volumes in the watershed.
Negative values indicate reservoir depletion (e.g.: years of drought) and positive ones indicates water accumulation/gain in the reservoir.
ηE - relation between the evaporated volume (Et) (reservoir surface) and the total annual inlow:
E Et Qat Pt η = + ∑
∑ ∑ (6)
Where:
Et: reservoir monthly evaporation. This index has as characteristics:
✓ Establish water storage eficiency;
✓ It may indicate that the reservoir has low depth and large area of the liquid mirror;
✓ Can be used to establish how fast the water has to be used to reduce evaporative losses;
ηP – Is the relationship between direct precipitation over the
reservoir hydraulic basin (reservoir liquid surface) and the total annual afluent volume. This index indicates the percentage of direct precipitation on the hydraulic basin of the reservoir:
P Pt Qat Pt η = + ∑
∑ ∑ (7)
Where:
Pt: reservoir direct precipitation
✓ This index may indicate that the reservoir has low depth and large area of the liquid mirror;
✓ High rates indicate that the contribution basin is small. ηV - Relation between the spillage volume (QVt) and the total annual afluent volume:
V QVt Qat Pt η = + ∑
∑ ∑ (8)
Where:
QVt: last reservoir spillage
This index has as characteristics:
✓ Establish the water storage eficiency (losses) or relative reservoir capacity;
✓ Indicates how much the reservoir wastes away the water inlow by spillage;
ηu - Relation between the used water volume (Qut) (dischargers,
water intakes) and the water inlow (water yields):
u Qut Qat Pt η = + ∑
∑ ∑ (9)
Where:
Qut: reservoirs water volume withdraw (to supply urban demand, animal watering and irrigation)
This index has as characteristics:
✓ Establishs the water amount used regarding to the afluent volume;
✓ High rates indicate that there are few losses;
final inicial entrada saída
Vr Vr Vr Q Q
∆ = − =∑ −∑
final inicial saída entrada
Vr −Vr +∑Q =∑Q (10)
Knowing that:
entrada
Q = Qat+ Pt
∑ ∑ ∑ , and also
saída
Q = Et+ QVt+ Qut
∑ ∑ ∑ ∑
Equation 10 may be written as:
final inicial
Vr −Vr +∑Et+∑QVt+∑Qut=∑Qat+∑Pt (11)
Dividing Equation 11 by the mathematic expresion entrada
Q = Qat+ Pt
∑ ∑ ∑ , yields:
final inicial
Vr Vr Et QVt Qut Qat Pt
Qat Pt Qat Pt
− + + + = +
+ +
∑ ∑ ∑ ∑ ∑
∑ ∑ ∑ ∑ (12)
Based on Equations 5, 6, 8 e 9. The Equation 12 may be rewritten this way:
ηVr + ηE + ηV + ηu =100% (13)
Considering that Equation 13 is based on the water balance, then it can be expanded to an integrated system of reservoirs or even to the river basin as a whole, by inserting a term (ηpt) that relates the losses in transit through iniltration that occur in the river bed and the total annual tributary low.
pt pt t t Q Qa P η = + ∑
∑ ∑ (14)
Where:
Qpt: is the volume of water lost in transit in the river bed by iniltration. Thus, Equation 13 can be rewritten as:
Vr E V u pt 100%
η + η + η + η + η = (15)
Other indicators associated with the reservoirs were used by Vieira (1996). However, these indexes were adapted for surface water analysis. In this case, the indicators associated to the reservoirs potentiality is obtained by the sum of the inlows plus the direct precipitation and the reservoirs Availability equals the sum of inlows plus direct precipitation minus losses; The water demands are consumptive uses (water intakes for human supply and irrigation). Within this context the following indexes are deined:
Potential Activation Index (IAP) is deined as the ratio between availability and potentiality:
E V pt Vr u
Availability
IAP 1 losses 1
Potenciality
= = − = − η − η − η = η + η (16)
Availability Utilization Index (IUD) is the ratio of demand to availability: u Vr u Water Demand IUD availability η = =
η + η (17)
Potential Utilization Index (IUP) is the ratio of demand to potentiality.
u
Water Demand IUP
Potentiality
= = η (18)
Such indexes can also be applied to the integrated reservoir system, where all inlows entering the system plus direct precipitation over the reservoirs form the potentiality. Availability is the potentiality minus the losses in transit, evaporations in the reservoirs and spillage volumes in the river bed downstream of the system. The demands are all consumptive uses (human supply and irrigation).
As each scenario met different demands, given the layout of the pipeline systems, information was also included about the increase in demand in relation to Scenario 1 (without the transposition), called %Dem.
RESULTS AND DISCUSSION
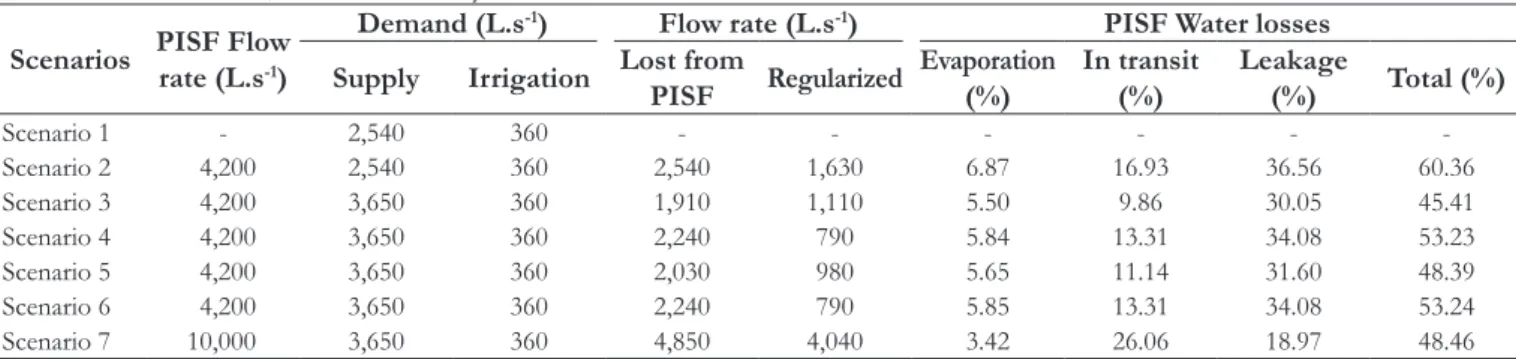
Water losses calculations
The total losses in the system are the losses resulting from the processes of evaporation, spillage and losses in transit along the river by iniltration. As the river dynamics in the Paraíba river basin is the same in all scenarios, then the calculation of the total water losses of the PISF low in the system is done according to Equation 19:
PISF
Losses(C1) Losses(Ci)
Losses(Ci) x100%
Q −
=∑ ∑ (19)
Where:
Losses (Ci): Total water losses on Scenario i, with i= 2,..., 7; Losses (C1): Total water losses on Scenario 1, (scenario which there was no transposition);
QPISF: Exogenous low of PISF.
All losses were transformed into average low in L.s-1, and their results for each scenario are presented in Table 6, as well as, the regularized lows from Acauã.
In this research priorities were adopted to meet the demands and the target volumes of the reservoirs. In the used model the lowest value priority indicates the water use that would be irst served. The priorities for each simulated water use are given in Table 7.
Table 7. Priorities of demand meeting and goal volumes on reservoirs.
Demand Scenarios
1 2 3 4 5 6 7
Poções 1 1 - - - -
-Camalaú 2 2 1 to 4a 1 and 2a 1 to 4a 1 and 2a 1 to 4a
Boqueirão 3b and 4 3b and 4 5b and 6a 3 to 5 5 3 to 5 5b and 6a
Acauã 5b and 6 5b and 6 7 to 8 6 to 8 6 to 8 6 to 8 7 to 8
Regularized low downstream Acauã 7 7 9 9 9 9 9
Leakage on Acauã 99 99 99 99 99 99 99
Irrigation Poções 9 9 10 10 10 10 10
Irrigation Cordeiro 10 10 11 11 11 11 11
Irrigation Vereda Grande 11 11 12 12 12 12 12
Reservoirs Priority of goal volume of the reservoirs
Poções 20 20 20 20 20 20 20
Camalaú 30 30 30 30 30 30 30
Boqueirão 40 40 40 40 40 40 40
Acauã 50 50 50 50 50 50 50
aPipeline system yet to be installed, the number goes from downstream to upstream; bExisting pipeline systems.
Table 6. PISF low rate, demanded and system water losses.
Scenarios PISF Flow rate (L.s-1)
Demand (L.s-1) Flow rate (L.s-1) PISF Water losses Supply Irrigation Lost from
PISF Regularized
Evaporation (%)
In transit (%)
Leakage
(%) Total (%)
Scenario 1 - 2,540 360 - - -
-Scenario 2 4,200 2,540 360 2,540 1,630 6.87 16.93 36.56 60.36
Scenario 3 4,200 3,650 360 1,910 1,110 5.50 9.86 30.05 45.41
Scenario 4 4,200 3,650 360 2,240 790 5.84 13.31 34.08 53.23
Scenario 5 4,200 3,650 360 2,030 980 5.65 11.14 31.60 48.39
Scenario 6 4,200 3,650 360 2,240 790 5.85 13.31 34.08 53.24
Scenario 7 10,000 3,650 360 4,850 4,040 3.42 26.06 18.97 48.46
System performance indicators calculation
In Scenarios 2 to 7, due to the increase in the PISF, there were no failures to meet the demands and, therefore, their performance indicators were the best possible, ie reliability, resilience and sustainability were equal to 100%, since the vulnerability was equal to 0%.
Scenario 1 was simulated without transposition and there were failures in the supply and irrigation demands for the Poções and Camalaú reservoirs. Its performance indicators are presented in Table 8.
Analyzing the results of Scenario 1, the Poções and Camalaú reservoirs collapsed for a consecutive period of 21 and 20 months, respectively, relecting the low resilience index, high vulnerability index and low sustainability in meeting the demands.
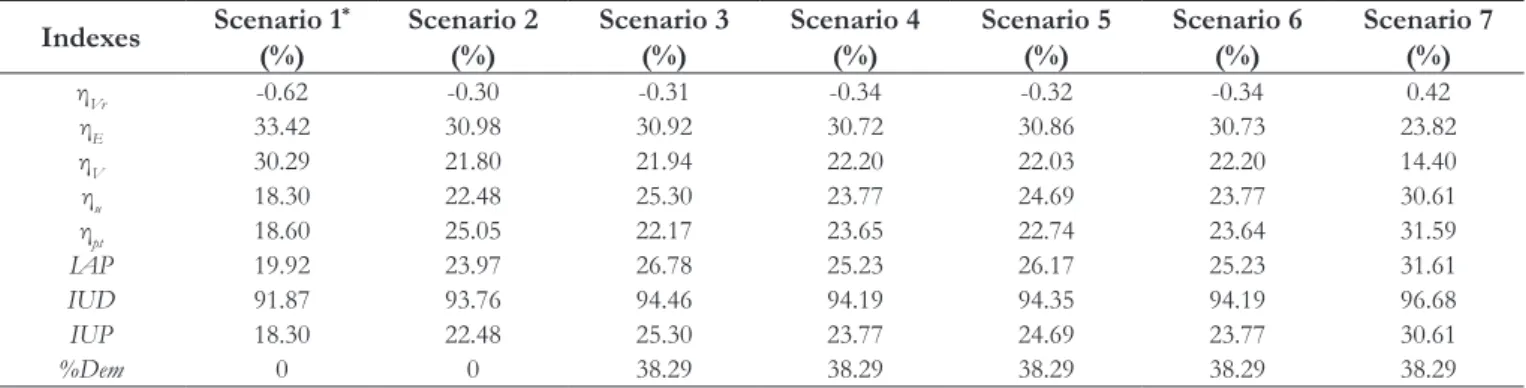
The eficiency indexes for the integrated reservoir system are presented in Table 9. The series of data that generated the indicators and indices are found in Farias (2009).
Based on Table 9, it was veriied that Scenario 1 presented the highest loss indexes ηV and ηE, associated to spillage and evaporative losses, respectively. This fact occurs because the simulation was performed without transposition, and it was established that the target volume is equal to the maximum volume, which increases
the reservoir liquid surface and, consequently, increases the evaporative losses and by spillage. Scenario 7 presented the highest ηu index, since it receives a low of 10,000 L.s-1 from the PISF, generating an increase in the water supply. In the other scenarios with transposition this index did not change signiicantly, being the second largest value with Scenario 3, because it was simulated with the highest low rate from the Poções reservoir, which reduces the losses in transit, increasing the availability.
Scenarios 4 and 6 obtained very close indexes, with no signiicant water performances differences, with regard to the volume of water added from the Boqueirão reservoir. They differ only in the way in which the water will be transported, since Scenario 4 foresees the water reinforcement to the supply of Campina Grande through the route that goes to the Brejo. In Scenario 6, water reinforcement will be done by another independent pipeline system.
CONCLUSION
Analyzing the obtained results, it was veriied that the initial proposal of the Ministry of National Integration (Scenario 2) is subject to high transportation losses caused by iniltration and evaporation along the river and, in addition, losses occur in the reservoirs by evaporation and spillage. In this scenario, in addition to the water losses being greater in relation to the others, there is a reduction in the coverage area of the project, since it does not foresee for the construction of new pipelines or channels systems and only the existing pipelines systems would receive the water reinforcement of the transposition. Without these works to bring the waters of the PISF to the interior of the state, there is no increase in water supply for this region, which will continue to depend on climatic phenomena and being vulnerable to water scarcity.
Scenario 3 was the one that presented the lowest water loss, because it shows higher low in relation to the other scenarios taken from Poções. Scenario 5 also presented good water performance, however, for the construction of new water pipeline system, more detailed studies should be made regarding to the path and their capacities, since these works involve high implantation and operation costs throughout its useful life. By this factor the construction of pipelines with the characteristics of scenarios 4 and 6 may be one of the most feasible economically.
Scenario 7 was simulated to determine which flow would be regularized from the Acauã reservoir when the system receives the maximum low predicted in the PISF for the East Axis in Paraíba, which is 10,000 L.s-1 continuously. However,
the PISF predicts that the system will only receive this low in rainy periods in the São Francisco River Basin, and not in any simulated period. Among the scenarios that received 4,200 L.s-1 of the transposition, Scenario 1 is the one with the highest losses,
since it has a demand of 30.41% lower in relation to the other scenarios with transposition. This increases the water availability and, consequently, the regularized low, however the number of cities and the population served are smaller.
Taking into account water losses, indexes and performance indicators, the construction of new pipeline systems is indispensable for the successful transposition of the São Francisco River. These works, in addition to signiicantly reducing the water losses of the PISF low along the Paraíba River, also increase the scope of action of the project, since there is an increase, both, in the population and in the served water demands, providing support, with the guarantee of water, to the region’s economic and social development.
ACKNOWLEDGEMENTS
The irst author thanks the CNPq CAPES by funding the research through the granted scholarship. Thanks to Donately da Costa Santos for the translation of the article.
REFERENCES
AESA - AGÊNCIA EXECUTIVA DE GESTÃO DAS ÁGUAS DO ESTADO DA PARAÍBA. Proposta para distribuição da água da transposição do Rio São Francisco no Estado da Paraíba. 2007.
AESA - AGÊNCIA EXECUTIVA DE GESTÃO DAS ÁGUAS DO ESTADO DA PARAÍBA. Últimas informações recebidas sobre os volumes dos 126 reservatórios d’água da paraíba monitorados pela AESA. João Pessoa, 2016. Available from: <http://site2.aesa. Table 8. Performance indicators for Scenario 1.
Water Demands Reliability (%) Resilience (%) Vulnerability (%) Sustainability (%)
Poções 91.24 14.52 87.42 1.67
Camalaú 93.64 15.56 85.56 2.10
Boqueirão 100 100 0. 100.00
Acauã 100 100 0 100.00
Irrigation Poções 89.97 12.68 93.75 0.71
Irrigation cordeiro 92.66 15.38 98.08 0.27
Irrigation vereda grande 100 100 0 100
Table 9. Eficency indexes associated to the reservoir system. Indexes Scenario 1
*
(%)
Scenario 2 (%)
Scenario 3 (%)
Scenario 4 (%)
Scenario 5 (%)
Scenario 6 (%)
Scenario 7 (%)
ηVr -0.62 -0.30 -0.31 -0.34 -0.32 -0.34 0.42
ηE 33.42 30.98 30.92 30.72 30.86 30.73 23.82
ηV 30.29 21.80 21.94 22.20 22.03 22.20 14.40
ηu 18.30 22.48 25.30 23.77 24.69 23.77 30.61
ηpt 18.60 25.05 22.17 23.65 22.74 23.64 31.59
IAP 19.92 23.97 26.78 25.23 26.17 25.23 31.61
IUD 91.87 93.76 94.46 94.19 94.35 94.19 96.68
IUP 18.30 22.48 25.30 23.77 24.69 23.77 30.61
%Dem 0 0 38.29 38.29 38.29 38.29 38.29
pb.gov.br/aesa/volumesAcudes.do?metodo=preparaUltimosV olumesPorMunicipio>. Access on: 11 Mar. 2017.
ANA - AGÊNCIA NACIONAL DE ÁGUAS. Nota técnica nº 390/2005/SOC, de 19 de setembro de 2005. Análise do pedido de outorga de direito de uso de recursos hídricos para o Projeto de Integração do Rio São Francisco com as Bacias Hidrográicas do Nordeste Setentrional. Brasília, 2005. Available from: <http://ana.gov.br>. Access on: 20 Apr. 2008.
CAGEPA - COMPANHIA DE ÁGUA E ESGOTOS DA PARAÍBA. Noticias. João Pessoa, 2011. Available from: <http://www.cagepa.pb.gov.br/presidente-da-cagepa-fala-sobre-inundacao-em-mares-e-descarta-privatizacao/>. Access on: 31 July 2017.
FARIAS, E. E. V. Distribuição da água do projeto de integração do rio São Francisco no estado da Paraíba - Eixo Leste: análise de perdas. 2009. 125 f. Dissertação (Mestrado em Engenharia Hidráulica) - Curso de Pós-graduação em Engenharia Civil e Ambiental, Universidade Federal de Campina Grande, Campina Grande, 2009.
IBGE - INSTITUTO BRASILEIRO DE GEOGRÁFIA E ESTATÍSTICA. IBGE Cidades@. Rio de Janeiro, 2016. Available from: < http://www.cidades.ibge.gov.br/xtras/perfil.php?la ng=&codmun=250400&search=paraiba|campina-grande>. Access on: 19 Oct. 2016.
PARAÍBA. Governo do Estado. Plano Diretor de Recursos Hídricos da Bacia Hidrográica do rio Paraíba. João Pessoa: Secretaria Extraordinária do Meio Ambiente, dos Recursos Hídricos e Minerais – SEMARH, 2001. Relatório Final de Diagnóstico.
PARAÍBA. Governo do Estado. Plano Estadual de Recursos Hídricos do Estado da Paraíba. João Pessoa: Secretaria Extraordinária do Meio Ambiente, dos Recursos Hídricos e Minerais – SEMARH, 2004. Relatório Parcial da Consolidação de Informações e Regionalização. Resumo Executivo. Available from: <http:// www.aesa.pb.gov.br/perh/>. Access on: 15 Feb. 2008.
USP - UNIVERSIDADE DE SÃO PAULO. ACQUANET - Modelo para alocação de água em sistemas complexos de recursos hídricos – manual do usuário. São Paulo: LABSID - Laboratório de Sistemas de Suporte a Decisão, 2002.
VIEIRA, A. S. Um modelo de simulação via programação linear seqüencial, para sistema de recursos hídricos. 2007. 101 f. Dissertação (Mestrado em Recursos Hídricos) - Curso de Pós-graduação em Engenharia Civil, Universidade Federal de Campina Grande, Campina Grande, 2007.
VIEIRA, V. P. P. B. Recursos hídricos e o desenvolvimento sustentável do semi-árido Nordestino. Revista Brasileira de Recursos Hídricos, v. 1, n. 1, p. 91-107, 1996.
Authors contributions
Emmanuel Eduardo Vitorino de Farias: Work conception, Data analysis and processing, discussion of the results and writing of the article.
Wilson Fadlo Curi: Study orientation, Text revision elaboration of the Abstract and analysis of the results.