www.the-cryosphere.net/9/557/2015/ doi:10.5194/tc-9-557-2015
© Author(s) 2015. CC Attribution 3.0 License.
Brief Communication: Contending estimates of 2003–2008
glacier mass balance over the Pamir–Karakoram–Himalaya
A. Kääb1, D. Treichler1, C. Nuth1, and E. Berthier2
1Department of Geosciences, University of Oslo, P.O. Box 1047, Oslo, Norway 2CNRS, Université de Toulouse, LEGOS, 14 avenue Ed. Belin, 31400 Toulouse, France
Correspondence to:A. Kääb (kaeaeb@geo.uio.no)
Received: 20 October 2014 – Published in The Cryosphere Discuss.: 25 November 2014 Revised: 12 February 2015 – Accepted: 3 March 2015 – Published: 19 March 2015
Abstract.We present glacier thickness changes over the en-tire Pamir–Karakoram–Himalaya arc based on ICESat satel-lite altimetry data for 2003–2008. We highlight the impor-tance of C-band penetration for studies based on the SRTM elevation model. This penetration seems to be of poten-tially larger magnitude and variability than previously as-sumed. The most negative rate of region-wide glacier el-evation change (<−1 m yr−1) is observed for the eastern
Nyainqêntanglha Shan. Conversely, glaciers of the western Kunlun Shan are slightly gaining volume, and Pamir and Karakoram seem to be on the western edge of this mass-gain anomaly rather than its centre. For the Ganges, Indus and Brahmaputra basins, the glacier mass change reaches
−24±2 Gt yr−1, about 10 % of the current glacier contribu-tion to sea-level rise. For selected catchments, we estimate glacier imbalance contributions to river run-off from a few percent to greater than 10 %.
1 Introduction and methods
Region-wide measurements of glacier volume or mass change are limited for the Pamir–Karakoram–Himalaya re-gion, leaving room for speculation about the glacier response to climate change and its hydrological significance. Glacier mass change in high mountain Asia (or some part of it) have been obtained by (i) extrapolating the few existing in situ mass balance series (Cogley, 2011; Bolch et al., 2012; Yao et al., 2012), (ii) space gravimetry (Jacob et al., 2012; Gardner et al., 2013), (iii) laser altimetry (Kääb et al., 2012; Gard-ner et al., 2013; Neckel et al., 2014) and (iv) the differencing of digital elevation models (Gardelle et al., 2013). Between
these studies that narrow down the range of uncertainties for core parts of this remote mountain region, significant incon-sistencies remain.
The aims of this study are (i) to provide a new consis-tent regional-scale data set from the ICESat autumn laser campaigns (2003–2008) by extending Kääb et al. (2012) to completely cover the study region by Gardelle et al. (2013) and several major river basins, (ii) to compare the results to other previous estimates of the Pamir–Karakoram–Himalaya glacier volume change and (iii) to roughly evaluate the con-tribution of glacier mass change to river run-off.
We follow the methods explained in Kääb et al. (2012) with a considerable extension towards the eastern Nyain-qêntanglha Shan, the Pamir and part of the Tibetan Plateau (Fig. 1). In short, ICESat footprints are intersected with the February 2000 SRTM DEM and overlaid on the most snow-free multispectral Landsat images over∼2000–2013
to manually classify footprints into three classes: glaciers, non-glaciers and water. Glacier elevation difference trends are then estimated regionally and at a 1◦×1◦ geographic
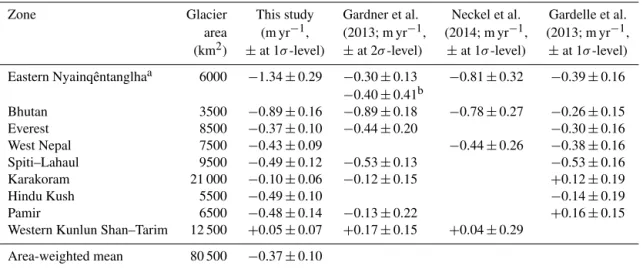
Table 1.Glacier elevation difference trends over the Pamir–Karakoram–Himalaya from this and other studies. Note that Gardelle et al. (2013) cover the period 2000 to∼2010, while the other studies cover 2003 to 2008/2009. Note also that the zones of this study and Gardelle et al. (2013) coincide whereas the zones of the other do so only roughly, which can potentially explain parts of the disagreements. See text in Sects. 3 and 4 for an explanation of how the glacier areas were estimated.
Zone Glacier This study Gardner et al. Neckel et al. Gardelle et al. area (m yr−1, (2013; m yr−1, (2014; m yr−1, (2013; m yr−1, (km2) ±at 1σ-level) ±at 2σ-level) ±at 1σ-level) ±at 1σ-level)
Eastern Nyainqêntanglhaa 6000 −1.34±0.29 −0.30±0.13 −0.81±0.32 −0.39±0.16 −0.40±0.41b
Bhutan 3500 −0.89±0.16 −0.89±0.18 −0.78±0.27 −0.26±0.15 Everest 8500 −0.37±0.10 −0.44±0.20 −0.30±0.16 West Nepal 7500 −0.43±0.09 −0.44±0.26 −0.38±0.16 Spiti–Lahaul 9500 −0.49±0.12 −0.53±0.13 −0.53±0.16 Karakoram 21 000 −0.10±0.06 −0.12±0.15 +0.12±0.19 Hindu Kush 5500 −0.49±0.10 −0.14±0.19 Pamir 6500 −0.48±0.14 −0.13±0.22 +0.16±0.15 Western Kunlun Shan–Tarim 12 500 +0.05±0.07 +0.17±0.15 +0.04±0.29
Area-weighted mean 80 500 −0.37±0.10
aNamed Hengduan Shan in Gardelle et al. (2013);btwo zones of Gardner et al. (2013) overlap with our zone and both their values are given.
Figure 1.Study region and trends of elevation differences during 2003–2008. Data are shown on a 1◦grid with overlapping rectangular geographic averaging cells of 2◦×2◦. Trends are based on autumn ICESat acquisitions. Only ICESat footprints over glaciers are indicated. The zones indicated by black outlines are equivalent to the ones of Gardelle et al. (2013) with the western Kunlun Shan–Tarim zone (dashed outline) being the only additional one. Trends for all cells (coloured data circles) are statistically significant except for the cells that are marked with grey centres. The uncertainty of the temporal trends per cell is indicated through circle sizes indirectly proportional to the standard error of trends at 68 % level.
2 Glacier thickness changes
2.1 Thickening in the Karakoram and western Kunlun Shan
A first striking feature in the regional map of elevation dif-ference trends (Fig. 1) is glacier thickness gain in the
west-ern Kunlun Shan (∼ +0.1 m yr−1), agreeing with in situ
2011; Gardelle et al., 2012a), or Pamir–Karakoram anomaly (Gardelle et al., 2013), is rather the edge or southwest limit of an anomaly centred more to the northeast over the western Kunlun Shan, or Tarim Basin. The anomaly seems thus in-deed the result of a larger-scale meteorological or climatic feature, and peculiarities of the Karakoram topography or glaciers (e.g. surge type, hypsometry, avalanche contribu-tion; Hewitt, 2011) do not necessarily play a decisive role. Combined, the results by Gardner et al. (2013), Neckel et al. (2014) and the glacier elevation change pattern of Fig. 1 suggest the centre of the anomaly could be located over the Tibetan Plateau.
Direct precipitation measurements in this region are scarce and thus trends are uncertain. Satellite-retrieved precipitation and gauge data (Global Precipitation Climatology Project) suggest an increase of precipitation over the study region north of Karakoram and east of Pamir (Yao et al., 2012). Chinese measurements show increased precipitation over the Tibetan Plateau (C.-Y. Xu, personal communication, 2014), and Tao et al. (2014) suggest wetter conditions over the Tarim Basin since the mid 1980s. A number of abnormally wet years occurred during the early 21st century over the Tarim Basin and the Tibetan Plateau (Becker et al., 2013), in par-ticular for the hydrological years 2003/2004 and 2005/2006. A recent climate modelling study proposes that stable or in-creasing snowfalls characterise the Karakoram anomaly on a background of increasing air temperatures (Kapnick et al., 2014). Despite the available studies and data, further research seems necessary to consolidate the precipitation and temper-ature trends and the reason behind the slight glacier volume gains.
2.2 Massive thinning in eastern Nyainqêntanglha Shan and Spiti–Lahaul
The other striking feature in Fig. 1 is the massive glacier thickness loss in the eastern Nyainqêntanglha Shan (between
−1 and−1.7 m yr−1), also consistent with the large negative
mass balances and frontal retreats in this zone (Yao et al., 2012). The glaciers of eastern Nyainqêntanglha Shan have the smallest total elevational range in our study region, in-dicating a large sensitivity to fluctuations in the equilibrium line altitude (Pelto, 2010; Loibl et al., 2014). The few avail-able in situ mass balance measurements in the area suggest that the equilibrium line was over the vertical limits of the monitored glaciers in the late 2000s, and precipitation in this zone shows the strongest long-term decrease over the en-tire Pamir–Karakoram–Himalaya region (Yao et al., 2012; Becker et al., 2013). A similar pattern of glacier shrinkage, though less distinct, is found at the western end of the Great Himalaya Range within our Spiti–Lahaul zone and forms the cluster of second-largest thickness loss rates in this study (−0.5 to−0.7 m yr−1). Also here, Landsat data indicate that
firn lines have risen in several years towards high glacier
el-evations, resulting in very small accumulation areas or even their complete loss.
The 2003–2008 glacier thickness changes in the other study zones are all similar, on the order of ∼ −0.4 to
−0.5 m yr−1 (Table 1), with more negative values in the
Bhutan zone at the transition between the eastern Nyaiqên-tanglha and Everest zones. We note that glaciers dominated by the summer monsoon (i.e. east of the Spiti–Lahaul) all show thickness losses (summer-accumulation type glaciers; Fujita, 2008; Kapnick et al., 2014; Maussion et al., 2014). Eastern Nyaiqêntanglha Shan, the zone with strongest glacier thickness loss, receives most accumulation during March– May (spring-accumulation type; Maussion et al., 2014). The glaciers with considerable winter accumulation under influ-ence of the westerlies show a more mixed picture, with stable or growing thicknesses in the Karakoram and western Kun-lun Shan but thickness losses for instance in the Hindu Kush. 2.3 Comparison to previous thickness change studies The following comparison to other studies uses average glacier thickness changes rather than total mass changes in order to minimise effects from different delineations of study zones, glacier cover areas and density assumptions. From Hindu Kush and Karakoram in the west to Nepal in the east, results of all studies agree within their errors (Table 1). Re-sults are most sensitive to zone delineation in the Hindu Kush, reflecting the strong spatial variability of glacier thick-ness change rates in this area (Fig. 1) and presumably also lo-cally heterogeneous glacier behaviour (Sarikaya et al., 2012; see also below for Pamir).
Significant differences among the results of all studies are found over eastern Nyainqêntanglha Shan. Our results and those from Neckel et al. (2014) agree within the errors but not with Gardner et al. (2013), although all three studies are based on ICESat. While our study and Neckel et al. (2014) use ICESat footprint classifications from contemporary satel-lite images, Gardner et al. (2013) use Randolph Glacier In-ventory outlines (RGI version 2.0; Pfeffer et al., 2014), which contain considerable errors of commission and omission in this zone (see Table 1 in Gardelle et al., 2013). Repeating our analysis with footprint classifications based on the Ran-dolph Glacier Inventory results in less negative elevation dif-ference trends on glaciers (∼20 % less negative) due to
in-clusion of non-glacier footprints. Contrarily, the elevation difference trends on land (−0.10±0.06 m yr−1when using our own footprint classification) become more negative if ICESat footprints are classified using RGI due to inclusion of glacier footprints (−0.16±0.07 m yr−1). The remaining discrepancy is presumably due to the fact that the ICESat-based results of Gardner et al. (2013) are averaged from three different methods. Their results based on autumn footprints only (method B, Gardner et al., 2013) suggest a thickness change rate of−0.86 m yr−1, which is in closer agreement
At a first glance, eastern Nyainqêntanglha Shan results from Gardelle et al. (2013; zone called Hengduan Shan) and Gardner et al. (2013) seem to agree, but we believe this might be a coincidence. Previously, we argued why the Gard-ner et al. (2013) results might be less negative. Addition-ally, the results in Gardelle et al. (2013) rely crucially on an estimate of SRTM C-band penetration. Over any glacier globally, the SRTM radar waves will typically have pene-trated into the snow and ice, with potential largest penetration depths through snow and firn and smallest through ice (Kääb et al., 2012; Dall et al., 2001; Rignot et al., 2001). As a con-sequence, SRTM glacier elevations do not, in general, reflect real mid-February 2000 glacier surface elevations but some lower horizon, the elevation of which depends on, among others, the dielectric properties and structure of the pene-trated glacier volume during the SRTM campaign. For ele-vation difference studies where one of the eleele-vation data sets is the SRTM, its penetration depth needs to be estimated for correction, and biases in this estimate translate directly into offsets in thickness change. Gardelle et al. (2013) used an average C-band penetration of 1.7 m for eastern Nyainqên-tanglha Shan estimated from the difference of SRTM C-band and X-band DEMs (Gardelle et al., 2012b). Here, we extrap-olate our ICESat elevation trends over 2003–2008 and their uncertainty back in time to the SRTM acquisition period in February 2000. Under the coarse assumption that the 2000– 2003 trends equal to those of 2003–2008, the extrapolation of February 2000 should result in a zero elevation difference to ICESat since the SRTM DEM was used as elevation ref-erence. Offsets in this elevation difference for February 2000 are mainly attributed to SRTM radar penetration into ice and snow (for method and discussion see Kääb et al., 2012). For eastern Nyainqêntanglha Shan this analysis indicates an av-erage penetration of 8–10 m (7–9 m if based on the winter trends that might alternatively be assumed to reflect February conditions), much more than the 1.7 m assumed in Gardelle et al. (2013), while the corresponding off-glacier penetration is not discernible from zero. Clearly, our penetration depth lies at the high end but remains within the range of pos-sible C-band phase-centre penetrations (Kääb et al., 2012; Dall et al., 2001; Rignot et al., 2001). Sakai et al. (2014) suggest the highest accumulation rates of the entire study re-gion occur in eastern Nyainqêntanglha Shan, together with Hindu Kush. Correction of the Gardelle et al. (2013) results by our present C-band penetration estimate completely rec-onciles their results with ours. Note, however, that extrapo-lation of our 2003–2008 elevation difference trend back to 2000 is based on the risky assumption that the 2000–2003 trend equals the 2003–2008 trend.
For the Bhutan zone, Gardelle et al. (2013) estimated a C-band penetration for February 2000 of 2.4 m, whereas our extrapolation of ICESat trends suggests around 6 m, which again reconciles the results of both studies for this zone.
In the Pamir, our results are more negative than Gard-ner et al. (2013) and in particular Gardelle et al. (2013).
As above, we suggest that our manual classification of ICE-Sat footprints versus the Randolph Glacier Inventory con-tributed to the difference between this study and Gard-ner et al. (2013) (remark: Gardelle et al. (2013) used their own inventory). Also, the difference between our study and Gardner et al. (2013) is reduced when only the re-sults from their Method B (similar to ours) are consid-ered. Gardelle et al. (2013) find glacier thickness changes of+0.16±0.15 m yr−1over the Pamir, whereas the present
study suggests−0.48±0.08 m yr−1. Again, we find larger
SRTM C-band penetration of 5–6 m compared to 1.8 m (Gardelle et al., 2013). Applying the average C-band pene-tration from the present study again reconciles the results of both studies. However, comparison of both studies in Pamir is complicated by a number of glacier surges (Gardelle et al., 2013) in connection with particularly sparse ICESat glacier coverage. Superimposing ICESat tracks over Landsat images and the elevation change map of Gardelle et al. (2013) re-veals that they cross areas of either strongly positive or neg-ative elevation change zones from surge waves. The ICESat trends thus become biased depending on where they sam-ple surges, and the total ICESat samsam-ple size over Pamir is not large enough to compensate for these effects. The dif-ferent observation periods for both studies (2000–2011 ver-sus 2003–2008) may also have considerable impact due to surge activities and climate interannual variability (Yi and Sun, 2013).
3 Glacier mass changes and water resources
We assume an average density of 850 kg m−3for all 2003– 2008 volume changes to convert the thickness changes to wa-ter equivalent quantities (Huss (2013); see Kääb et al. (2012), for different density scenarios). The total glacier area is es-timated using a simple cross product: we multiply the num-ber of ICESat glacier footprints in each zone with the ra-tio between the total zone area and total number of ICESat footprints. Our method to estimate the total glacier areas is certainly open to discussion, but we prefer the above pro-cedure over using areas from the Randolph Glacier Inven-tory because of the large deviations to our estimates, mainly for eastern Nyainqêntanglha and Pamir, from obviously out-dated glacier outlines and voids in the Randolph Inventory (Nuimura et al., 2014). The uncertainty of water equivalent quantities includes the standard error of the elevation differ-ence trend fit, the off-glacier trends, an error due to tempo-ral offset of the ICESat autumn campaigns from maximum cumulative ablation conditions, an uncertainty of±20 % for
the glacier cover areas and an uncertainty of±60 kg m−3for
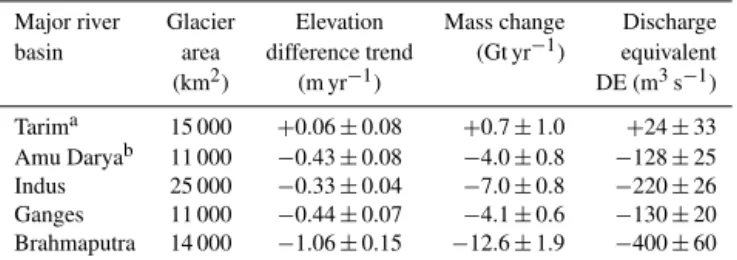
Table 2.Glacier thickness and mass changes over the major river basins of the study area. The discharge equivalent is a unit conver-sion from mass change and neglects any losses such as by evapora-tion or to groundwater.
Major river Glacier Elevation Mass change Discharge basin area difference trend (Gt yr−1) equivalent (km2) (m yr−1) DE (m3s−1) Tarima 15 000 +0.06±0.08 +0.7±1.0 +24±33 Amu Daryab 11 000 −0.43±0.08 −4.0±0.8 −128±25 Indus 25 000 −0.33±0.04 −7.0±0.8 −220±26 Ganges 11 000 −0.44±0.07 −4.1±0.6 −130±20 Brahmaputra 14 000 −1.06±0.15 −12.6±1.9 −400±60 aThe Tarim Basin is endorheic. Only parts of the glacier area (∼40 %) within the Tarim Basin are covered in this study.bEndorheic basin.
even when elevation difference trends agree, due to the sim-plified density assumption and the different glacier area esti-mates used.
3.1 Comparison to gravimetric mass loss
For the Pamir, Kunlun Shan and Karakoram (zone 8b of Jacob et al. (2012); note that the Karakoram is part of their zone 8b, not 8c as suggested by their zone names) we estimate a glacier mass change of −6±2 Gt yr−1
for 2003–2008 that agrees well within the error with Jacob et al. (2012) results from satellite gravimetry of −5±10 Gt yr−1 (January 2003–December 2007) and −8±9 Gt yr−1(January 2004–December 2008). For the
Hi-malaya and eastern Nyainqêntanglha Shan (zone 8c of Ja-cob et al., 2012) we estimate a 2003–2008 glacier mass change of−19±3 Gt yr−1that compares to−3±12 Gt yr−1
(January 2003–December 2007) and−2±10 Gt yr−1 (Jan-uary 2004–December 2008) from satellite gravimetry. Given their fundamentally different approaches, it is challenging to discuss potential sources of disagreement between the two studies in the Himalaya and eastern Nyainqêntanglha Shan. Groundwater depletion (Rodell et al., 2009), glacier imbal-ance run-off into endorheic basins (Zhang et al., 2013) and errors and biases in the ICESat-derived trends as discussed above and in Kääb et al. (2012) are all likely explanations. Note that Gardner et al. (2013) offer a second, more negative gravimetric estimate for the entire combined high mountain Asia that is, however, not spatially resolved enough to com-pare to our results. The uncertainties of our results in this en-tire paragraph are given at 2σconfidence level to better agree
with the uncertainty level in Jacob et al. (2012), whereas else-where in this contribution uncertainty is provided at 1σ
con-fidence level.
3.2 River run-off
The glaciers of the Tarim Basin (only 40 % of its total glacier area is covered here, with notably Tien Shan missing) and the Amu Darya basin (all glacier areas covered) drain into
en-dorheic basins and thus their mass changes do not contribute to sea-level changes (Table 2). The glacier mass changes in the Indus, Ganges and Brahmaputra basins from the present study contributed together∼0.06±0.01 mm yr−1to eustatic sea-level rise, that is∼10 % of the current sea-level
contri-bution of 0.71±0.08 mm yr−1from glaciers outside the ice
sheets (Gardner et al., 2013).
The discharge equivalent of these mass changes, that is the annual average glacier imbalance contribution to river run-off, is given in Table 2 for the major river basins covered. Note that computation of our discharge equivalents is a pure unit conversion from Gt yr−1to m3s−1, neglecting any hy-drological processes and with the sole aim to roughly evalu-ate the relative importance of glacier mass changes for river flow in the catchments.
The Tarim Basin glaciers most likely stored water over 2003–2008 (+24±33 m3s−1 discharge equivalent, DE). The glacier imbalance contribution to run-off is largest for Brahmaputra (−400±60 m3s−1 DE), followed by the
Indus (−220 m3s−1 DE), Ganges and Amu Darya (each −130 m3s−1 DE). Comparison of the discharge equivalent
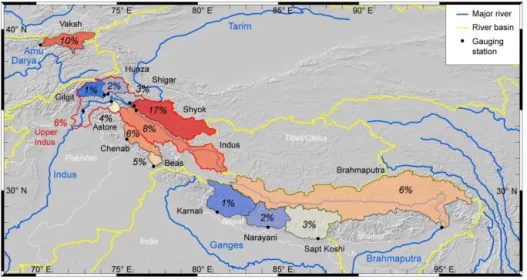
of glacier imbalance to measured river run-off is increasingly biased the further downstream the gauging stations are sit-uated from the glaciers due to cumulative natural and man-made losses. It is also important to note that the available run-off data from literature and databases refer to various time periods, in parts considerably older than the ICESat period. Figure 2 illustrates thus only roughly the hydrological sig-nificance of the 2003–2008 glacier mass change in selected gauged catchments. For details on the gauging stations used and the uncertainty of the contributions see Supplement. As an example, the 2003–2008 glacier imbalance within the up-per Indus basin at Besham Qila contributes∼6 % to annual average river discharge (Fig. 2; Supplement), and we roughly estimate a very similar number for the Amu Darya (Supple-ment). For the upper Indus basin, the hydrological balance is under ongoing discussion (Reggiani and Rientjes, 2014), and we hope that our glacier mass change estimates can con-tribute towards balance closure and better understanding of spatial–temporal patterns of run-off or high-elevation precip-itation amounts in the region (e.g. Immerzeel et al., 2012).
The modelling results for “non-renewable glacier run-off” of Savoskul and Smakhtin (2013) agree well with ours for Amu Darya, less for Indus (they ob-tain −0.55 m w.e. yr−1 specific mass loss rate over 2001– 2010; we have−0.28 m w.e. yr−1) and Ganges (they obtain
Figure 2.The percentage of discharge equivalent from annual glacier imbalance to measured average river run-off for selected catchments. Note that the actual numbers will be somewhat lower due to unaccounted water losses such as from evaporation or to groundwater. For details on the gauging stations used and the uncertainty of the contributions see the Supplement.
4 Conclusions
From 2003 to 2008 ICESat-derived elevation difference trends over Pamir–Karakoram–Himalaya and from compar-isons to geographically overlapping studies, we draw the fol-lowing conclusions:
– Glacier thickness loss over the study region is most pronounced for the eastern Nyainqêntanglha Shan, fol-lowed by the western end of the Great Himalaya Range. Glaciers in and around the western Kunlun Shan are in balance or even gaining volume, and Pamir and Karako-ram seem to be on the western limit of this mass balance anomaly rather than its centre. This suggests it is a me-teorological or climatic anomaly (rise in precipitation). However, the cause and duration of this regional glacier anomaly is not fully understood yet.
– Our glacier volume changes seem especially uncertain in Pamir and, to a lesser extent, Hindu Kush. The het-erogeneous behaviour of individual glaciers in these two zones, for instance from glacier surges, may lead to biases when extrapolating elevation difference trends from particularly sparse ICESat tracks, or areas covered by differential DEMs, to the entire zones.
– Extrapolation of ICESat trends back in time to the SRTM acquisition date suggests a much larger poten-tial magnitude and variability of SRTM C-band phase-centre penetration than often assumed. Given the cru-cial importance of radar penetration for glacier thick-ness change studies based on radar DEMs, such as the SRTM or the upcoming TanDEM-X, we recommend being critical of penetration assumptions used in previ-ous studies and to investigate the issue more extensively
and systematically (Langley et al., 2007; chapter 7 in Müller, 2011). The problem is complicated by the fact that radar penetration has to be known specifically for certain dates from the past.
– The glacier mass changes in the Tarim and Amu Darya basins of +0.7±1.0 and −4.0±0.8 Gt yr−1 do not
contribute to sea-level rise. The combined Ganges, In-dus and Brahmaputra basin glacier mass change is
−23.7±2.1 Gt yr−1, almost 10 % of the glacier contri-bution to sea-level rise.
– Neglecting water losses downstream of the glaciers, the 2003–2008 glacier imbalances amount to∼6 % of
the annual discharge of Amu Darya and upper Indus where they leave the mountains. This is a considerable amount given the significance of the rivers for the Aral Sea (Amu Darya) and massive irrigation schemes and household use in these dry climate regions. Maximum glacier imbalance contributions to annual average river run-off of up to∼17 % are found for the Shyok (Indus) and∼10 % for Vakhsh (Amu Darya), while minimum contributions are only ∼1–3 % for the monsoon-type catchments in Nepal.
– Our results on glacier mass loss agree with those from satellite gravimetry (Jacob et al., 2012) over Pamir, western Kunlun Shan and Karakoram but significantly diverge over the Himalaya and eastern Nyainqêntanglha Shan.
trends. Our water equivalent results are also sensitive to den-sity and glacier area assumptions. We find that glacier out-lines and areas in the study region are still quite uncertain and invite the reader to use improved glacier area estimates for upscaling our results and own assumptions for the con-version of volume changes to mass changes.
The Supplement related to this article is available online at doi:10.5194/tc-9-557-2015-supplement.
Author contributions. A. Kääb designed the study, performed the data analysis and wrote the paper. D. Treichler, C. Nuth and E. Berthier contributed to data analysis, performed supporting anal-yses and edited the paper.
Acknowledgements. Sincere thanks are due to Duncan Quincey, another anonymous referee, colleagues that commented on the study, and the editor Andreas Vieli for their valuable feedback that certainly improved our work. The study was funded by the European Research Council under the European Union’s Seventh Framework Programme (FP/2007-2013)/ERC grant agreement no. 320816, the ESA project Glaciers_cci (4000109873/14/I-NB) and the Department of Geosciences, University of Oslo. E. Berthier acknowledges support from TOSCA (CNES). We are very grateful to NASA and NSIDC for free provision for the ICESat data and the USGS for the SRTM DEM and Landsat imagery.
Edited by: A. Vieli
References
Becker, A., Finger, P., Meyer-Christoffer, A., Rudolf, B., Schamm, K., Schneider, U., and Ziese, M.: A description of the global land-surface precipitation data products of the Global Precipita-tion Climatology Centre with sample applicaPrecipita-tions including cen-tennial (trend) analysis from 1901–present, Earth Syst. Sci. Data, 5, 71–99, doi:10.5194/essd-5-71-2013, 2013.
Bolch, T., Kulkarni, A., Kääb, A., Huggel, C., Paul, F., Cogley, J. G., Frey, H., Kargel, J. S., Fujita, K., Scheel, M., Bajracharya, S., and Stoffel, M.: The state and fate of Himalayan glaciers, Science, 336, 310–314, 2012.
Cogley, J. G.: Present and future states of Himalaya and Karakoram glaciers, Ann. Glaciol., 52, 69–73, 2011.
Dall, J., Madsen, S. N., Keller, K., and Forsberg, R.: Topography and penetration of the Greenland Ice Sheet measured with air-borne SAR interferometry, Geophys. Res. Lett., 28, 1703–1706, 2001.
Fujita, K.: Effect of precipitation seasonality on climatic sensitiv-ity of glacier mass balance, Earth Planet. Sc. Lett., 276, 14–19, doi:10.1016/j.epsl.2008.08.028, 2008.
Gardelle, J., Berthier, E., and Arnaud, Y.: Slight mass gain of Karakoram glaciers in the early 21st century, Nat. Geosci., 5, 322–325, 2012a.
Gardelle, J., Berthier, E., and Arnaud, Y.: Impact of resolution and radar penetration on glacier elevation changes computed from multi-temporal DEMs, J. Glaciol., 58, 419–422, 2012b. Gardelle, J., Berthier, E., Arnaud, Y., and Kääb, A.: Region-wide
glacier mass balances over the Pamir-Karakoram-Himalaya dur-ing 1999–2011, The Cryosphere, 7, 1263–1286, doi:10.5194/tc-7-1263-2013, 2013.
Gardner, A. S., Moholdt, G., Cogley, J. G., Wouters, B., Arendt, A. A., Wahr, J., Berthier, E., Hock, R., Pfeffer, W. T., Kaser, G., Ligtenberg, S. R. M., Bolch, T., Sharp, M. J., Hagen, J. O., van den Broeke, M. R., and Paul, F.: A reconciled estimate of glacier contributions to sea level rise: 2003 to 2009, Science, 340, 852– 857, 2013.
Hewitt, K.: Glacier change, concentration, and elevation effects in the Karakoram Himalaya, Upper Indus Basin, Mount. Res. De-velop., 31, 188–200, 2011.
Huss, M.: Density assumptions for converting geodetic glacier volume change to mass change, The Cryosphere, 7, 877–887, doi:10.5194/tc-7-877-2013, 2013.
Immerzeel, W. W., Pellicciotti, F., and Shrestha, A. B.: Glaciers as a proxy to quantify the spatial distribution of precipitation in the Hunza basin, Mount. Res. Develop., 32, 30–38, 2012.
Jacob, T., Wahr, J., Pfeffer, W. T., and Swenson, S.: Recent con-tributions of glaciers and ice caps to sea level rise, Nature, 482, 514–518, 2012.
Kääb, A., Berthier, E., Nuth, C., Gardelle, J., and Arnaud, Y.: Contrasting patterns of early twenty-first-century glacier mass change in the Himalayas, Nature, 488, 495–498, 2012.
Kapnick, S. B., Delworth, T. L., Ashfaq, M., Malyshev, S., and Milly, P. C. D.: Snowfall less sensitive to warming in Karakoram than in Himalayas due to a unique seasonal cycle, Nat. Geosci., 7, 834–840, doi:10.1038/ngeo2269, 2014
Langley, K., Hamran, S. E., Hogda, K. A., Storvold, R., Brandt, O., Hagen, J. O., and Kohler, J.: Use of C-band ground penetrating radar to determine backscatter sources within glaciers, IEEE T. Geosci. Remote, 45, 1236–1246, doi:10.1109/Tgrs.2007.892600, 2007.
Loibl, D., Lehmkuhl, F., and Griessinger, J.: Reconstructing glacier retreat since the Little Ice Age in SE Tibet by glacier mapping and equilibrium line altitude calculation, Geomorphology, 214, 22–39, doi:10.1016/j.geomorph.2014.03.018, 2014.
Maussion, F., Scherer, D., Mölg, T., Collier, E., Curio, J., and Finkelnburg, R.: Precipitation seasonality and variability over the Tibetan Plateau as resolved by the High Asia Reanalysis, J. Cli-mate, 27, 1910–1927, doi:10.1175/Jcli-D-13-00282.1, 2014. Müller, K.: Microwave penetration in polar snow and ice:
impli-cations for GPR and SAR, Dissertation, Faculty of Mathemat-ics and Natural Sciences. University of Oslo, available from http://www.duo.uio.no/ (last access: 17 March 2015), 2011. Neckel, N., Kropacek, J., Bolch, T., and Hochschild, V.: Glacier
mass changes on the Tibetan Plateau 2003–2009 derived from ICESat laser altimetry measurements, Environ. Res. Lett., 9, 014009, doi:10.1088/1748-9326/9/1/014009, 2014.
Pelto, M. S.: Forecasting temperate alpine glacier survival from accumulation zone observations, The Cryosphere, 4, 67–75, doi:10.5194/tc-4-67-2010, 2010.
Pfeffer, W. T., Arendt, A. A., Bliss, A., Bolch, T., Cogley, J. G., Gardner, A. S., Hagen, J. O., Hock, R., Kaser, G., Kienholz, C., Miles, E. S., Moholdt, G., Molg, N., Paul, F., Radic, V., Rastner, P., Raup, B. H., Rich, J., Sharp, M. J., Andeassen, L. M., Bajracharya, S., Barrand, N. E., Beedle, M. J., Berthier, E., Bhambri, R., Brown, I., Burgess, D. O., Burgess, E. W., Cawk-well, F., Chinn, T., Copland, L., Cullen, N. J., Davies, B., De Angelis, H., Fountain, A. G., Frey, H., Giffen, B. A., Glasser, N. F., Gurney, S. D., Hagg, W., Hall, D. K., Haritashya, U. K., Hartmann, G., Herreid, S., Howat, I., Jiskoot, H., Khromova, T. E., Klein, A., Kohler, J., Konig, M., Kriegel, D., Kutuzov, S., Lavrentiev, I., Le Bris, R., Li, X., Manley, W. F., Mayer, C., Menounos, B., Mercer, A., Mool, P., Negrete, A., Nosenko, G., Nuth, C., Osmonov, A., Pettersson, R., Racoviteanu, A., Ranzi, R., Sarikaya, M. A., Schneider, C., Sigurdsson, O., Sirguey, P., Stokes, C. R., Wheate, R., Wolken, G. J., Wu, L. Z., Wyatt, F. R., and Consortium, R.: The Randolph Glacier Inventory: a globally complete inventory of glaciers, J. Glaciol., 60, 537–552, doi:10.3189/2014jog13j176, 2014.
Reggiani, P. and Rientjes, T. H. M.: A reflection on the long-term water balance of the Upper Indus Basin, Hydrol. Res., in press, 2014.
Rignot, E., Echelmeyer, K., and Krabill, W.: Penetration depth of interferometric synthetic-aperture radar signals in snow and ice, Geophys. Res. Lett., 28, 3501–3504, 2001.
Rodell, M., Velicogna, I., and Famiglietti, J. S.: Satellite-based esti-mates of groundwater depletion in India, Nature, 460, 999–1002, 2009.
Sakai, A., Nuimura, T., Fujita, K., Takenaka, S., Nagai, H., and Lamsal, D.: Climate regime of Asian glaciers revealed by GAM-DAM Glacier Inventory, The Cryosphere Discuss., 8, 3629– 3663, doi:10.5194/tcd-8-3629-2014, 2014.
Sarikaya, M. A., Bishop, M. P., Shroder, J. F., and Olsenholler, J. A.: Space-based observations of Eastern Hindu Kush glaciers be-tween 1976 and 2007, Afghanistan and Pakistan, Remote Sens. Lett., 3, 77–84, 2012.
Savoskul, O. S. and Smakhtin, V.: Glacier systems and seasonal snow cover in six major Asian river basins: hydrological role under changing climate, Research Report no. 150, International Water Management Institute (IWMI), Colombo, Sri Lanka, 45 pp., 2013.
Tao, H., Borth, H., Fraedrich, K., Su, B., and Zhu, X.: Drought and wetness variability in the Tarim River Basin and connection to large-scale atmospheric circulation, Int. J. Climatol., 34, 2678– 2684, 2014.
Yao, T. D., Thompson, L., Yang, W., Yu, W. S., Gao, Y., Guo, X. J., Yang, X. X., Duan, K. Q., Zhao, H. B., Xu, B. Q., Pu, J. C., Lu, A. X., Xiang, Y., Kattel, D. B., and Joswiak, D.: Different glacier status with atmospheric circulations in Tibetan Plateau and surroundings, Nat. Clim. Change, 2, 663–667, 2012. Yi, S. and Sun, W.: Evaluation of glacier changes in high-mountain
Asia based on 10-year GRACE RL05 models, J. Geophys. Res.-Solid, 119, 2504–2517, doi:10.1002/2013JB010860, 2013. Zhang, G. Q., Yao, T. D., Xie, H. J., Kang, S. C., and Lei, Y. B.: