Is Tit-for-Tat the Answer? On the Conclusions
Drawn from Axelrod's Tournaments
Amnon Rapoport1, Darryl A. Seale2*, Andrew M. Colman3
1School of Business Administration, Anderson Hall, 900 University Avenue, University of California, Riverside, California 92521–0203, United States of America,2Lee Business School, University of Nevada, University of Nevada Las Vegas, 4505 Maryland Parkway—Box 456009, Las Vegas, Nevada 89154–6009, United States of America,3School of Psychology, University of Leicester, Leicester LE1 7RH, United Kingdom
Abstract
Axelrod’s celebrated Prisoner’s Dilemma computer tournaments, published in the early 1980s, were designed to find effective ways of acting in everyday interactions with the strate-gic properties of the iterated Prisoner’s Dilemma game. The winner of both tournaments was tit-for-tat, a program that cooperates on the first round and then, on every subsequent round, copies the co-player’s choice from the previous round. This has been interpreted as evidence that tit-for-tat is an effective general-purpose strategy. By re-analyzing data from the first tour-nament and some more recent data, we provide new results suggesting that the efficacy of tit-for-tat is contingent on the design of the tournament, the criterion used to determine success, and the particular values chosen for the Prisoner’s Dilemma payoff matrix. We argue that this places in doubt the generality of the results and the policy implications drawn from them.
Introduction
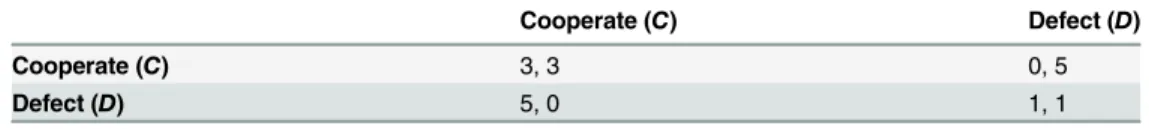
In 1979 Robert Axelrod invited scientists from several different academic disciplines to enter a Prisoner’s Dilemma (PD) round-robin computer tournament. Expressing dissatisfaction with previous research on the iterated PD game that had—in his judgment—failed to reveal how to play the game well, Axelrod argued that a new approach was needed to“learn more about how to choose effectively in an iterated Prisoner’s Dilemma”[1], p. 6., [2], p. 29. For this purpose, he invited 14 scientists, all with previous records of studying the PD, to submit computer programs for participation in a single-stage round-robin tournament involving exactly 200 repeated games against each of the other programs entered into the tournament. The 2 × 2 PD payoff matrix that was used in the tournament had the“conventional values”[3] shown inTable 1. Using standard labeling of payoffs (Tfor sole defection,Rfor joint cooperation,Pfor joint defection, andSfor sole cooperation), the values in this payoff matrix are (T,R,P,S) = (5, 3, 1, 0).
Each computer program was supposed to embody a set of rules specifying either a coopera-tive (C) or a non-cooperative/defecting (D) pure strategy on each repetition of the game. A use-ful benchmark for very good performance relative to the scoring rule specified by Axelrod is 600 points, equal to the score attained by each player if both always cooperate. A second useful OPEN ACCESS
Citation:Rapoport A, Seale DA, Colman AM (2015) Is Tit-for-Tat the Answer? On the Conclusions Drawn from Axelrod's Tournaments. PLoS ONE 10(7): e0134128. doi:10.1371/journal.pone.0134128
Editor:Angel Sánchez, Universidad Carlos III de Madrid, SPAIN
Received:January 19, 2015
Accepted:July 6, 2015
Published:July 30, 2015
Copyright:© 2015 Rapoport et al. This is an open access article distributed under the terms of the
Creative Commons Attribution License, which permits unrestricted use, distribution, and reproduction in any medium, provided the original author and source are credited.
Data Availability Statement:All relevant data are within the paper and its Supporting Information files.
Funding:Preparation of this manuscript was supported by Grant RM43G0176 awarded by the Leicester Judgment and Decision Making Endowment Fund to AC. The funders had no role in study design, data collection and analysis, decision to publish, or preparation of the manuscript.
benchmark is 200 points, attained by each if both always defect. As announced in the official rules of the tournament, which were commonly known by all the participants, each entry was also paired with a copy of itself and with another program, called RANDOM, that on each move cooperates or defects randomly with equal probability.
Axelrod believed that the results of a computer tournament might help to discover the best strategy for everyday human interactions with the general strategic structure of PD. The first sentence of the article in which he presented his results was:“This article is a‘primer’on how to play the Prisoner’s Dilemma game effectively”[1], p. 3. He argued that the approach he pro-posed had to take account of two facts about strategic interaction in an iterated non-zero-sum setting. The first is that the effectiveness of any strategy is likely to depend not only on the char-acteristics of that particular strategy, but also on the nature of the strategies against which it competes. A second and related fact is that an effective strategy must be able to take account of the entire history of the dyadic interaction as it has developed from the outset.
The rules of the tournament instructed contestants to maximize the number of points won across all 15 dyadic interactions (including the interactions with a copy of itself and with an additional program that choseCorDrandomly with equal probability). At the end of the tour-nament, the competing programs were to be ranked in terms of the total number of points that each had accumulated. The element of dyadic competition in the tournament was thereby sup-pressed, if not completely eliminated, as nothing was said in the instructions about winning any particular dyadic interaction. One may argue that this is an odd way to determine the over-all winner of the tournament. Soccer teams are not evaluated at the end of the season by the number of goals they have scored; chess players are not ranked by the number of pieces they capture from all the rivals; and NBA basketball teams are not ranked by the total number of points they have scored by the end of the tournament.
Tit-for-tat
It is by now well known that tit-for-tat (TFT), the simplest of the 14 genuine programs submit-ted (leaving aside the program that merely randomized its choices), ended up amassing the most points and thereby winning the tournament. To remind the reader, TFT chooses the cooperative strategyCon movet= 1, and on each subsequent movet(t= 2,. . .,n) it mimics the co-player’s decision at movet–1. TFT carries a memory of the immediately preceding out-come only; it forgets the earlier history of the interaction entirely and plays each move as if it were the last. In contrast to the requirement mentioned above, that an effective strategy should take account of the entire history of the dyadic interaction, it ignores the history apart from the outcome of the previous move, and it cannot signal its intentions or shape the future interac-tion, except in a very limited sense. Furthermore, an important property of TFT is that it can never win any particular iterated PD game—it can never achieve a positive point difference against any other program. All of this should have been known to the participants, as TFT had been studied earlier by Anatol Rapoport and Al Chammah [4] in their classical book on the PD, and also by Stuart Oskamp [5], Amnon Rapoport [6], and others.
Table 1. Payoff Matrix for the PD Game:“Conventional”Values.
Cooperate (C) Defect (D)
Cooperate (C) 3, 3 0, 5
Defect (D) 5, 0 1, 1
Note.T= 5,R= 3,P= 1,S= 0
Noting that the effectiveness of any particular program for playing the iterated PD game depends not only on its own characteristics, but also on the characteristics of all other compet-ing programs, Axelrod [7] conducted a second tournament. Entrants were informed of the out-come of the first tournament and the concepts used by Axelrod [1] to explain the reasons for the success or failure of the different programs. The rules for the second tournament were the same as for the first tournament, with the sole exception that the number of repetitions of the game in each pairing, rather than being fixed at 200, was determined probabilistically to mini-mize end-game effects. A total of 63 programs (including RANDOM) competed in the second tournament. Once again, TFT emerged as the overall winner. Axelrod found the results of the tournaments surprising, and so did the authors of many subsequent articles and books that commented on these two tournaments and their implications.
The computer tournaments have attracted a vast amount of attention and are regarded by many as classic studies. They have been discussed by Axelrod [1], [2], [7], Hofstadter [8], May-nard Smith [9], Anatol Rapoport [10], Selten and Hammerstein [11], Beer [12], Bendor [13], Nowak and Sigmund [14], and Colman [15], among many others. No attempt is being made here to survey the already voluminous and still rapidly growing literature in this area of research, spanning psychology, economics, political science, biology, computer science, and system studies (see, e.g., [3], [16]). Axelrod [17] has commented recently that“the rate of cita-tions for the early work has not yet peaked even after thirty years”(p. 22). Most researchers and commentators seem to have accepted his conclusions regarding the reasons for the robust success of TFT and the policy implications that he suggested for“how to choose successfully”
[16]. Axelrod [2] summarized his conclusions as follows:
What accounts for TIT FOR TAT’s robust success is its combination of being nice, retalia-tory, forgiving, and clear. Its niceness prevents it from getting into unnecessary trouble. Its retaliation discourages the other side from persisting whenever defection is tried. Its forgive-ness helps restore mutual cooperation. And its clarity makes it intelligible to the other player, thereby eliciting long-term cooperation. (p. 54)
Cautionary notes have been sounded by Hofstadter [8] and Colman [15], and subsequent PD computer tournaments reported by Bendor, Kramer, and Stout [18], Donninger [19], and Nowak and Sigmund [14] have not supported TFT as the overall winner. However, to the best of our knowledge, previous researchers have not pointed out that the success of TFT may be contingent on a particular combination of the format chosen for the tournament, the objective function that defined overall success, and the values of the PD payoff matrix used in the tour-naments. Our main argument is that the generalizations inferred from the two tournaments, and in particular the policy implications drawn from their results, may not be warranted with-out unambiguous qualification.
Tournament Design
Tournaments are competitions that involve relatively large numbers of contestants who partic-ipate in a series of games in order to determine the overall winner or, more generally, rank-order the contestants in terms of their performance. In designing a tournament, independent decisions have to be made about three major issues: the format of the tournament, the objective criterion to be maximized, and the population of the contestants.
stage progressing to the next. As the tournament continues, the number of competitors decreases. The winner of the final stage, which consists of a single fixture, is the overall winner. In around-robin tournament, each contestant competes with each of the others an equal number of times, once in a single-stage round-robin tournament and twice in a two-stage round-robin tournament. For example, in the English Premier League, twenty teams compete in multiple soccer matches. Each team is matched with each of the other 19 teams twice, once at its home stadium and once at the opponent’s, for a total of 38 matches for each team. A FIFA World Cup (soccer) tournament combines these two most popular formats in a particu-lar order. The top 32 teams in the 2014 World Cup were first divided into eight groups of four that participated in single round-robin tournaments. Then, the two top teams in each group progressed to the second stage in which the resulting 16 teams participated in a single-elimina-tion (knockout) stage. The World Chess Championship Candidates Tournament in 2014 was an eight-player, two-stage round-robin tournament in which each player faced every other player once as White and once as Black, the winner earning the right to a head-to-head title match with the existing world champion.
Criteria for success
The criteria for determining the overall winner also vary considerably. Chess tournaments use a simple scoring rule: one point for a win, half a point for a draw, and zero points for a loss. The English Premier League imposes a more complicated scoring system that was introduced to discourage ties. Teams are awarded three points for a win, one point for a tie, and zero points for a loss. At the end of the season, teams are ranked by three criteria that are applied in a lexi-cographic order: teams are first ranked by the number of points; if these are equal, then ties are broken by the goal difference; and if these goal differences are also equal, then ties are broken by the number of goals scored. In most other tournaments, it is simply the number of wins that counts. In general (e.g., in basketball, American football, and backgammon) point differentials play no role in determining the overall winner. Many tournaments in track-and-field events, soccer, basketball, backgammon, and tennis have qualifying competitions for ensuring that only the most successful players or teams take part in the tournament proper.
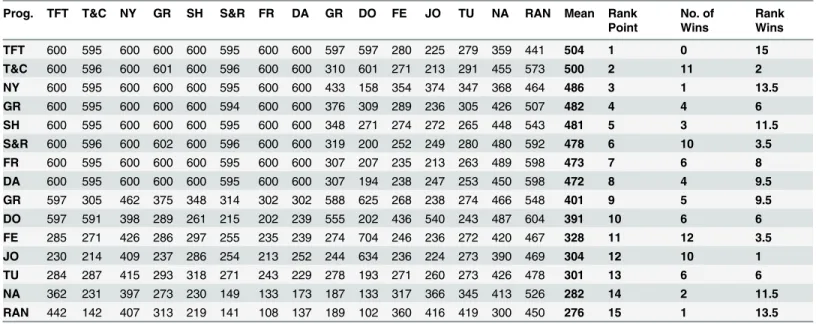
Both of the original PD computer tournaments made use of the single-stage round-robin format. In theory, this type of tournament provides a fair procedure for rank-ordering contes-tants or choosing overall winners. Its primary disadvantage is that it becomes impractical when the number of contestants is large. Clearly, this problem disappears when the tournament is conducted on a computer. The objective criterion chosen for the PD tournaments was maximi-zation of the total number of points across all pairings.Table 2presents the total number of points won by each program against itself and against each of the others in the first tourna-ment. The 15 competing programs are presented in a descending order of score total, and it is clear from the table that TFT ranked top and RANDOM ranked bottom. The programs are numbered from 1 to 15 in the column labeled“Rank Point.”The next column (second from right), labeled“No. of Wins,”lists the number of wins counted across the 15 pairings, and the last column labeled“Rank Wins”displays the rank-ordering of the 15 entries in terms of num-ber of wins. Our reason for including numnum-bers of wins and the associated rank-ordering is that most tournaments use the number of wins to determine the winner. Although TFT cannot ever win an individual encounter, most of the other programs can. The data in the two right-hand columns are discussed later.
constructed to win any particular round of play. On the face of it, the criterion might have been chosen in an attempt to foster cooperation—a player would not like to get locked into a sequence ofD-Doutcomes and end up with a relatively low score. Evidence in support of this conjecture is that the top-ranking entries in Axelrod’s first tournament were“nice”(defined as never being the first to defect). In fact, the ranking of the eight“nice”programs relative to one another was largely determined by just two of the other“kingmaker”programs that are not nice, namely DO (Downing) and GR (Graaskamp). The concept of kingmaker strategies was introduced by Axelrod [1], pp. 10–13.
The participants in the first tournament were recruited from among“experts”who had written on game theory and, in particular, on the PD game. In the second tournament, entrants were provided with a detailed analysis of the first tournament, including the results presented inTable 2, together with concepts used to analyze success and pitfalls that were discovered. Axelrod [7] remarked:“Therefore, the second round presumably began at a much higher level of sophistication than the first round, and its results should therefore be much more valuable as a guide to effective choice in the Prisoner’s Dilemma”(p. 381).
Evaluation
Can the conclusions about the superiority of TFT drawn by Axelrod, and further propagated in subsequent papers and books, be generalized beyond the design of his two tournaments? To answer this question, we examined separately the effects of changes in format, objective crite-rion, and payoff values on tournament outcomes. To study the effects of the format, we chose among formats that are not susceptible to the presence of“kingmakers,”while still controlling in part for the element of luck. In the first analysis, we divided the 15 entries from the original tournament randomly into three groups of five entries, each of which participated in a two-stage round-robin tournament based on the number of points listed inTable 2. In particular, the five entries in each group participated in a single-stage (preliminary) round-robin tourna-ment. The (three) winners, one of each group, then progressed to the second stage in which they participated in a second (final) round-robin tournament to determine the overall winner.
Table 2. Tournament Scores in Axelrod’s First Tournament.
Prog. TFT T&C NY GR SH S&R FR DA GR DO FE JO TU NA RAN Mean Rank Point
No. of Wins
Rank Wins
TFT 600 595 600 600 600 595 600 600 597 597 280 225 279 359 441 504 1 0 15
T&C 600 596 600 601 600 596 600 600 310 601 271 213 291 455 573 500 2 11 2
NY 600 595 600 600 600 595 600 600 433 158 354 374 347 368 464 486 3 1 13.5
GR 600 595 600 600 600 594 600 600 376 309 289 236 305 426 507 482 4 4 6
SH 600 595 600 600 600 595 600 600 348 271 274 272 265 448 543 481 5 3 11.5
S&R 600 596 600 602 600 596 600 600 319 200 252 249 280 480 592 478 6 10 3.5
FR 600 595 600 600 600 595 600 600 307 207 235 213 263 489 598 473 7 6 8
DA 600 595 600 600 600 595 600 600 307 194 238 247 253 450 598 472 8 4 9.5
GR 597 305 462 375 348 314 302 302 588 625 268 238 274 466 548 401 9 5 9.5
DO 597 591 398 289 261 215 202 239 555 202 436 540 243 487 604 391 10 6 6
FE 285 271 426 286 297 255 235 239 274 704 246 236 272 420 467 328 11 12 3.5
JO 230 214 409 237 286 254 213 252 244 634 236 224 273 390 469 304 12 10 1
TU 284 287 415 293 318 271 243 229 278 193 271 260 273 426 478 301 13 6 6
NA 362 231 397 273 230 149 133 173 187 133 317 366 345 413 526 282 14 2 11.5
RAN 442 142 407 313 219 141 108 137 189 102 360 416 419 300 450 276 15 1 13.5
An advantage of the two-stage tournament is that it allows“experts”to emerge endogenously on the basis of the outcomes of the first round of the tournament.
Results of re-analysis
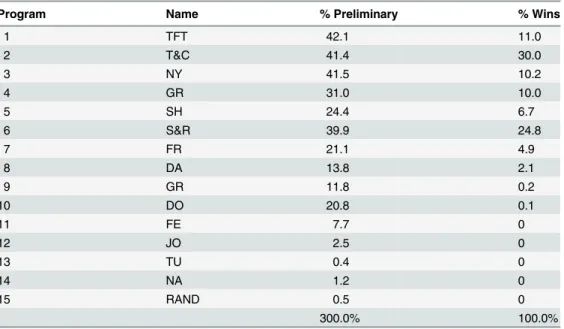
To illustrate the effect of a change in format on the tournament outcome, we repeated this pro-cedure twice (we performed two runs). In the first run, the three groups randomly chosen from Table 2included the entries ranked {1, 2, 7, 9, 10}, {5, 6, 12, 14, 15}, and {3, 4, 8, 11, 13}. Pro-grams 1, 6, and 3, the winners of their respective groups, proceeded to Stage 2, which was won by Program 6. (Programs 1 and 3 came very close behind within 1 point difference.) In the sec-ond run, the three randomly chosen groups included the programs {4, 5, 7, 10, 13}, {2, 3, 9, 11, 15}, and {1, 6, 8, 12, 14}. Programs 4, 3, and 6, the winners of their respective groups in Stage 1, progressed to Stage 2 where once again Program 6 emerged as the winner. As the results of these two examples are by no means representative, we computed all combinations resulting from dividing the 15 programs into three groups of five entries each (a total of 756,756 combi-nations), and subjected each combination to a two-stage round-robin tournament using the scores inTable 2. Ties that occurred in either the preliminary or the final tournament were bro-ken randomly. The results are summarized inTable 3. The first column inTable 3lists the pro-grams from 1 to 15, as in Axelrod’s original paper, and the second column lists their names. The third column presents the percentage of times that each program entered the final stage of the tournament, and the fourth column presents the percentage of the two-stage tournaments won by each of the 15 programs.
Table 3shows that Program 2 (T&C) won 30.0% of the tournaments, Program 6 (S&R) came second with 24.8%, whereas Program 1 (TFT) only won 11.0%. Program 1 was followed closely by Programs 3 and 4 that won 10.2% and 10.0% of all the tournaments, respectively. The top eight programs, all of them characterized as“nice”by Axelrod, accounted for 99.7% of the wins.Table 3also shows that Program 1 (TFT) won a higher percentage of the preliminary stage (42.1%) than any other program. However, when competing with two other programs in the second and final stage, both of them“nice,”it won only in about 26% of its interactions (in
Table 3. Analysis of Axelrod’s First Tournament as a Two-stage Round-Robin Tournament.
Program Name % Preliminary % Wins
1 TFT 42.1 11.0
2 T&C 41.4 30.0
3 NY 41.5 10.2
4 GR 31.0 10.0
5 SH 24.4 6.7
6 S&R 39.9 24.8
7 FR 21.1 4.9
8 DA 13.8 2.1
9 GR 11.8 0.2
10 DO 20.8 0.1
11 FE 7.7 0
12 JO 2.5 0
13 TU 0.4 0
14 NA 1.2 0
15 RAND 0.5 0
300.0% 100.0%
comparison, Program 2 won in almost 75% of its interactions in the final stage). This result confirms Axelrod’s observation that the success of TFT in his first tournament is largely due to two“kingmakers”included in the seven bottom programs in Tables2and3.
To complete this analysis, we matched the top eight entries, all of them“nice,”in a single-stage round-robin tournament. The overall winner among the top eight“nice”programs was Program 6, followed by Programs 2 and 3. TFT was one of the four programs that tied for the lowest ranking. The point of these analyses is to demonstrate that the format of the tournament is critical, and consequently that the conclusions drawn from one format may not be readily generalizable to another.
To readers familiar with tournaments, it may seem obvious that maximizing the total num-ber of points in a single-stage round-robin tournament may not yield the same ranking of con-testants as maximizing the number of wins across all dyadic interactions. However, it might be assumed that the rankings yielded by these two separate criteria are likely to be positively and indeed highly correlated. For example, this seems to be the case in the English Premier League: teams that score many goals tend in general to do well in the final ranking. Therefore, to check whether one ranking may serve as a proxy for the other in the PD tournaments, we re-analyzed the results of the first tournament in terms of the number of wins. We recorded a win whenever the winning margin against a co-player was positive; we deleted every game between a program and its twin; and in every case of a tie, we recorded the mean rank. Thus, for example,Table 2 shows that Program FE was ranked 11th in terms of mean number of points won (328) but was ranked first in terms of the number of wins (12). TFT did not score even a single win—by its nature, it can never outscore its co-player—and was ranked last. The Spearman rank correla-tion between the two rankings turns out to beρ=−.103. The null hypothesis that the two rank-ings in Axelrod’s first tournament are uncorrelated cannot be rejected (p>.70).
We performed a similar analysis using five groups of three programs (rather than three groups of five) and obtained largely similar results. The details of this and a more complicated replication are set out in the supporting information file“S1 AlternativeTournament For-mats”. Data and results for the tournament with three groups of five programs are provided as supporting information in the Excel file“S1 TournamentResults”.
More recent data
Payoff Values
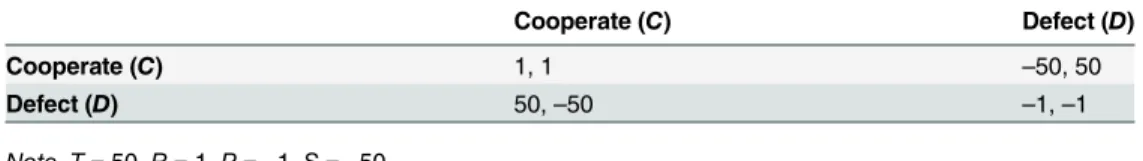
A final comment about the two original PD tournaments concerns the payoff values shown in Table 1. There are infinitely many payoff matrices that satisfy the defining conditions of the PD game (T>R>P>Sand 2R>P+S), but only one of them was chosen for the original tournaments. Do the particular payoff values matter as long as the matrix satisfies the PD con-ditions? Anatol Rapoport and Al Chammah [4] provided evidence that the particular values do indeed matter, and it follows that conclusions about cooperation in the PD game may not be readily generalizable from one set of payoffs to another. Rapoport and Chammah compared behavior in seven different variants of the PD game (p. 37) using a design that systematically manipulated the payoff values. The levels of cooperation that they observed varied from 26.8% to 77.4%.Table 4reproduces one of their seven games (T,R,P,S) = (50, 1,–1,–50), the one that elicited the lowest percentage of cooperative choices. If we were to replace the–50 payoff with–200 and the 50 with 200 (to magnify the effect of defection still further), and if we repeated the single round-robin tournament with this new payoff matrix (still a well-defined PD game), would TFT be the overall winner? Considering that a single defection following a long sequence of mutual cooperative choices would wipe out TFT’s cumulative gains and result in a very large point difference, we conjecture that it might not.
Evidence relevant to this conjecture comes from Kretz [22], who conducted a long series of computer simulations of an iterated PD single-stage round-robin tournament to investigate the effects of number of iterations, memory size carried by each of the players, and—most rele-vant to the present paper—values in the 2 × 2 payoff matrix. He summarized his results as fol-lows:“The main result of the tournament as carried out here is that different strategies emerge as winners for different payoff matrices”(p. 384). A more general conclusion that supports our argument about the iterated PD is that conclusions drawn from computational investigations of the iterated PD game may be valid only if they do not depend significantly on the particular values in the payoff matrix.
Conclusions
The Prisoner’s Dilemma was originally introduced as a non-cooperative two-person game (see, e.g., Luce and Raiffa [23]). Most of the theoretical and experimental literature has studied the game in its original context. It was Axelrod who has shifted the focus by embedding the two-person game in a round-robin tournament in which each program is pitted against the“the field”with the explicit purpose“To learn more about how to choose effectively in an iterated Prisoner’s Dilemma”([1], p. 6).We note that Axelrod has been careful not to explicate the notion of“effectiveness”:is it maximization of individual payoff,maximization of joint payoff,
maximization of the difference between yours and your opponent’s payoff,reaching some pre-determined payoff target,or some combination of the above? It would seem reasonable to inter-pret“effectiveness”as maximization of individual expected utility (represented by payoffs) in any repeated interaction with a given co-player. This expected utility should not depend on the outcomes of interactions between any other pairs of players who are not involved in the same
Table 4. Payoff Matrix for a Low-Cooperation PD Game.
Cooperate (C) Defect (D)
Cooperate (C) 1, 1 –50, 50
Defect (D) 50,–50 –1,–1
Note.T= 50,R= 1,P=–1,S=–50
interaction. However, the criterion used by Axelrod to rank the strategies takes into account payoffs earned byotherpairs of players who are not involved in the same interaction. Recall that the success of TFT in his tournaments was determined largely by the outcomes of the pair-wise interactions of others, in particular those involving the two“kingmakers”(Axelrod’s own term). Axelrod either overlooked this anomaly or preferred to ignore it by not defining“ effec-tiveness”explicitly.
We agree that Axelrod’s“new approach”has been extremely successful and immensely influential in casting light on the conflict between an individual and the collective rationality reflected in the choices of a population whose members are unknown and its size unspecified, thereby opening a new avenue of research. Our purpose is not to detract from this important contribution. Rather, what has motivated our project is the observation that once the two-person PD game is embedded in a tournament, the overall success of each player—however measured—is not only determined by the decisions she and her opponent makes in each stage of the dyadic interaction but also by the decisions of other dyadic interactions in the popula-tion. Therefore, decisions have to be made about the format of the tournament, the criteria for determining a“winner”, and the payoff structure. To the best of our knowledge, Axelrod has provided no justification for his choices of the format, criterion for determining“success”, and payoff structure. In an attempt to further extend his“new approach”, we argue that other choices are equally reasonable. We then show that all of his choices matter and, consequently, the policy recommendations about the effectiveness of TFT should be qualified.
Our focus in this article is on the usefulness of round-robin computer tournaments for determining the most effective strategies in interactions with the strategic structure of the PD game. We recognize and appreciate other approaches to evaluating PD strategies, including evolutionary game theory using mathematical analysis (e.g., [3], [24], [25]) or agent-based computer simulation (e.g., [26], [27], [28]), but discussion of such approaches is clearly beyond the scope of this article.
For more than thirty years, in hundreds of publications, social and behavioral scientists have propagated the conclusion that TFT is the appropriate strategy to follow in resolving con-flicts in dyadic interactions that satisfy the assumptions underlying the iterated two-person PD game. For example, Jurišićet al. [16], after reviewing the relevant literature up to 2012,
con-cluded:“Prisoner’s dilemma is still a current research area with nearly 15000 papers during the past two years (Source: Google Scholar). New strategies are developed and old ones are reused in new areas. But basic rules for cooperation that were recognized by Axelrod in the first com-petition are still valid”(p. 1097). Evidence for this conclusion and support for the associated recommendation rest on the outcomes of two round-robin computer tournaments reported by Axelrod [1], [2], [7] and a few additional tournaments with the same format and criterion of success. With one exception that we know of [29], these additional tournaments also followed Axelrod by using the same 2 × 2 payoff matrix from his original tournaments.
Supporting Information
S1 Alternative Tournament Formats.
(PDF)
S1 Tournament Results.
(XLSX)
Acknowledgments
Preparation of this manuscript was supported by Grant RM43G0176 awarded by the Leicester Judgment and Decision Making Endowment Fund to A. M. Colman. The first author of this article (Amnon Rapoport) was among the competitors in the original tournament.
Author Contributions
Conceived and designed the experiments: AR. Performed the experiments: AR DS. Analyzed the data: AR DS AC. Contributed reagents/materials/analysis tools: AR DS AC. Wrote the paper: AR DS AC. Proposed the original idea and drafted the manuscript: AR. Performed the computer simulations: DS. Contributed critical revisions: AC.
References
1. Axelrod R (1980a) Effective choice in the Prisoner’s Dilemma. J Conflict Resolut 24(1): 3–25. doi:10. 1177/002200278002400101
2. Axelrod R (1984) The evolution of cooperation. New York: Basic Books.
3. Press WH, Dyson FJ (2012) Iterated Prisoner’s Dilemma contains strategies that dominate any evolu-tionary opponent. P Natl Acad Sci USA 109(26): 10409–10413. doi:10.1073/pnas.1206569109
4. Rapoport Anatol, Chammah AM (1965) Prisoner’s dilemma: A study in conflict and cooperation. Ann Arbor, MI: University of Michigan Press.
5. Oskamp S (1971) Effects of programmed strategies on cooperation in the Prisoner’s Dilemma and other mixed-motive games. J Conflict Resolut 15(2): 225–259. doi:10.1177/002200277101500207
6. Rapoport Amnon (1967) Optimal policies for the Prisoner’s Dilemma. Psychol Rev 74(2): 136–148. doi:10.1037/h0024282PMID:6040260
7. Axelrod R (1980b) More effective choice in the Prisoner’s Dilemma. J Conflict Resolut 24(3): 379–403. doi:10.1177/002200278002400301
8. Hofstadter DR (1983) Metamagical themas: Computer tournaments of the Prisoner’s Dilemma suggest how cooperation evolves. Sci Am 248(5): 14–20. doi:10.1038/scientificamerican0583-16
9. Maynard Smith J (1984) Game theory and the evolution of behavior. Behav Brain Sci 7(1): 95–101. doi:10.1017/S0140525X00026327
10. Rapoport Anatol (1984) Game theory without rationality. Behav Brain Sci 7(1): 114–115. doi:10.1017/ S0140525X00026467
11. Selten R, Hammerstein P (1984) Gaps in Harley’s argument on evolutionary stable learning rules and in the logic of“tit-for-tat.”Behav Brain Sci 7(1): 115–116. doi:10.1017/S0140525X00026479
12. Beer FA (1986) Games and metaphors: Review article. J Conflict Resolut 30(1): 171–191. doi:10. 1177/0022002786030001011
13. Bendor J (1993) Uncertainty and the evolution of cooperation. J Conflict Resolut 37(4): 709–734. doi: 10.1177/0022002793037004007
14. Nowak M, Sigmund K (1993) A strategy of win-stay, lose-shift that outperforms tit-for-tat in the Prison-er’s Dilemma game. Nature 364(6432): 56–58. doi:10.1038/364056a0PMID:8316296
15. Colman AM (1995) Game theory and its applications in the social and biological sciences. 2nd ed. London: Routledge.
17. Axelrod R (2012) Launching“The Evolution of Cooperation.”J Theor Biol 299 (SI): 21–24. doi:10. 1016/j.jtbi.2011.04.015PMID:21540040
18. Bendor J, Kramer RM, Stout S (1991) When in doubt: Cooperation in a noisy Prisoner’s Dilemma. J Conflict Resolut 35(4): 691–719. doi:10.1177/0022002791035004007
19. Donninger C (1986) Is it always efficient to be nice? A computer simulation of Axelrod’s computer tour-nament. In Paradoxical Effects in Social Behavior: Essays in Honor of Anatol Rapoport. In Diekmann A, Mitter P editors. Heidelberg, Germany: Physica-Verlag, pp. 123–134.
20. Kendall G, Yao X, Chong SY editors (2007) The iterated Prisoners’Dilemma: 20 years on. River Edge, NJ: World Scientific Publishing.
21. Humble J (2004) Prisoner’s Dilemma tournament [Table of results]. Available: http://www.prisoners-dilemma.com/results/cec04/ipd_cec04_full_run.html.
22. Kretz T (2011) A round-robin tournament of the iterated Prisoner’s Dilemma with complete memory-size-three strategies. Compl Syst 19(4): 363–389. Available:http://www.complex-systems.com/pdf/ 19-4-4.pdf.
23. Luce RD, Raiffa H (1957) Games and decisions: Introduction and critical survey. New York: Wiley.
24. Adami C, Hintze D (2013) Evolutionary instability of zero-determinant strategies demonstrates that win-ning is not everything. Nature Comms 4(2193): 1–8. doi:10.1038/ncomms3193
25. Hilbe C, Traulsen A, Sigmund K (2015) Partners or rivals? Strategies for the iterated prisoner’s dilemma. Games Econ Behav 92(1): 41–52. doi:10.1016/j.geb.2015.05.005
26. Li Y, Lan X, Deng XY, Sadiq R, Deng Y (2014) Comprehensive consideration of strategy updating pro-motes cooperation in the prisoner's dilemma game. Physica A 403: 284–292. doi:10.1016/j.physa. 2014.02.051
27. Colman AM, Browning L, Pulford BD (2012) Spontaneous similarity discrimination in the evolution of cooperation. J Theor Biol 299: 162–171. 171. doi:10.1016/j.jtbi.2011.05.022PMID:21640125
28. Zhang JL, Zhang CY, Chu TG, Weissing FJ (2014) Cooperation in networks where the learning envi-ronment differs from the interaction envienvi-ronment. PLOS ONE 9(3): e90288 doi:10.1371/journal.pone. 0090288PMID:24632774