www.atmos-meas-tech.net/8/1617/2015/ doi:10.5194/amt-8-1617-2015
© Author(s) 2015. CC Attribution 3.0 License.
Performance of WVSS-II hygrometers on the FAAM research
aircraft
A. K. Vance1, S. J. Abel1, R. J. Cotton1, and A. M. Woolley2 1Met Office, Exeter, UK
2FAAM, Cranfield, UK
Correspondence to: A. K. Vance ([email protected])
Received: 2 May 2014 – Published in Atmos. Meas. Tech. Discuss.: 19 August 2014 Revised: 8 December 2014 – Accepted: 16 December 2014 – Published: 28 March 2015
Abstract. We compare the performance of five hygrome-ters fitted to the Facility for Airborne Atmospheric Measure-ment’s (FAAM) BAe 146-301 research aircraft using data from approximately 100 flights executed over the course of 2 years under a wide range of conditions. Bulk comparison of cloud free data show good agreement between chilled mirror hygrometers and a WVSS-II fed from a modified Rosemount inlet, but that a WVSS-II fed from the standard flush inlet ap-pears to over-read compared to the other instruments, except at higher humidities.
Statistical assessment of hygrometer performance in cloudy conditions is problematic due to the variable nature of clouds, so a number of case studies are used instead to in-vestigate the performance of the hygrometers in sub-optimal conditions. It is found that the flush inlet is not susceptible to either liquid or solid water but that the Rosemount inlet has a significant susceptibility to liquid water and may also be sus-ceptible to ice. In all conditions the WVSS-II responds much more rapidly than the chilled mirror devices, with the flush inlet-fed WVSS-II being more rapid than that connected to the Rosemount.
1 Introduction
Water vapour is well established as the most important green-house gas and, hence, is crucially important in determining the radiation budget of the atmosphere. Its vertical distribu-tion has a significant impact on local radiative heating and cooling, and on the net fluxes at the surface and at the top of the atmosphere. Its three-dimensional distribution has a large impact on the dynamics and thermodynamics of the
at-mosphere as well as controlling the distribution of clouds. A thorough understanding of the distribution of water vapour is, therefore, critically important to our understanding and monitoring of climate change, to improve forecasts from op-erational numerical weather prediction (NWP) and to better interpret data from current and future satellite instruments.
Meteorological observations from commercial aircraft have been an important part of the global observing sys-tem for some time, making a demonstrable positive impact on the output of both NWP models and human forecasters (Moninger et al., 2006; Petersen et al., 2010) as well as to the aviation industry (Baker et al., 2011). Aircraft routinely provide air temperature and derived wind speed & direction data via the World Meteorological Organization’s (WMO) Aircraft Meteorological Data Relay (AMDAR) programme (WMO, 2014a). AMDAR allows for the inclusion of humid-ity data, and such observations have been included for well over a decade, but only around 100 aircraft currently report humidity operationally, mostly in the USA. A contributing factor to this may be that the only sensor to meet the require-ments of AMDAR, currently, is the Water Vapour Sensing System version two (WVSS-II) (WMO, 2014a).
util-ity of such routine AMDAR measurements as an adjunct to, or as a replacement for, radiosonde observations for NWP purposes, and positive impacts on forecasts have been re-ported (Moninger et al., 2006; WMO, 2014b). These stud-ies have two serious limitations: (1) a radiosonde and an aircraft cannot be guaranteed to sample the same air mass throughout their ascents, which increases the uncertainty, and (2) the WVSS-II measurements in question are truncated for transmission (two-digit mantissa, one digit exponent) which “can add substantial error to the moisture reports exceed-ing 10 k/kg” (Bedka et al., 2006). These shortcomexceed-ings are avoided in this study as all humidity data were recorded si-multaneously on the same aircraft and all WVSS-II data were recorded at higher resolution via the WVSS-II’s diagnos-tic/research output.
In 2010, Deutscher Wetterdienst (DWD) provided the Met Office with two WVSS-II units to be trialled on the FAAM aircraft as part of the EUMETNET AMDAR (E-AMDAR) programme. These have been operated semi-routinely along-side the existing two chilled mirror hygrometers. Here we present data collected on an opportunistic basis during ap-proximately 100 flights of the FAAM aircraft, which took place between 22 February 2011 and 23 September 2013. The flights were mainly conducted around the United King-dom but data are included from various experiments at lo-cations ranging from the western Sahara to the Svalbard Is-lands, as well as from the southern United States and south eastern Canada, encountering a wide range of conditions. Data have been recorded at altitudes up to 11 km with ab-solute humidities ranging down from around 13 g m−3; the lowest value is not known for reasons that shall be discussed below.
The following section briefly describes the instruments compared in this paper with the treatment of offsets between them described in Sect. 3. Section 4 describes the relative performance of the four hygrometers in cloud free conditions while Sect. 5 presents a number of case studies illustrating the performance of the WVSS-II in cloudy and in rapidly changing conditions.
2 Instruments and installation 2.1 Buck CR-2 (Buck)
The Buck measures atmospheric dewpoint using the chilled mirror technique. Air is extractively pumped through an aft facing inlet, located 1.8 m aft of the nose and outside the 99 % free-stream boundary layer, through a heated pipe into a sample chamber and over a mirror-like metal surface. The mirror temperature is regulated using a Stirling-cycle cooler until condensation begins to form on the mirror, this be-ing the dew or frost point. The condensation layer is mon-itored optically, and the mirror temperature is measured us-ing an embedded platinum resistance thermometer. The Buck
is calibrated annually at the National Physical Laboratory in Teddington, UK, and the dewpoint measurement is directly traceable to ITS-90 (FAAM, 2014a). Data from the 2013 cal-ibration show the Buck to be accurate to better than±0.7 K, for frost points down to 203 K (approximately 0.002 g m−3 at an altitude of 10 km).
2.2 General Eastern 1011B (GE)
The GE is another thermoelectric chilled mirror dew point/frost point hygrometer, originally fitted to the Met Of-fice C-130 and transferred to the FAAM aircraft in 2004. Its inlet is unheated, located 6 m aft of the nose and 4 cm from the skin, leaving it within the boundary layer. The ac-curacy of the FAAM instrument is given by the manufacturer as ±0.2 K above 273 K, decreasing to ±1 K between 233 and 198 K (General Eastern Instruments, 1987) with a res-olution of 0.03 K. The actual performance of the instrument is strongly dependent on the ambient temperature, and data may be subject to an increasing positive bias below around 250 K (FAAM, 2014b).
2.3 Total Water Counter (TWC)
The TWC is a Lyman-αabsorption instrument developed by the Met Office for use on its C-130 aircraft and transferred to the FAAM aircraft in 2004. The operating range, accu-racy and resolution are quoted as 0 to 20 g kg−1,±0.15 and
±0.005 g kg−1, respectively (Nicholls et al., 1990) but, in practice, this can be improved upon as the accuracy is pri-marily determined by the manner in which it is calibrated, and the instrument which it is calibrated against (e.g. Abel et al., 2014; Brown and Francis, 1995). Note that although this instrument will measure the combined amount of water in all phases, it may be regarded as a hygrometer in cloud free air. As the TWC uses magnesium fluoride windows and a Lyman-αsource, both of which degrade over time, the in-strument must be calibrated on a flight-by-flight basis using one of the chilled mirror instruments (usually the GE) and, therefore, does not provide an independent measurement. For this reason, and because it is not operated on all flights, it has been excluded from the bulk intercomparison. The TWC does, however, have a very short, isokinetic intake resulting in a very rapid response, which makes it ideal for assessment of the response times of other hygrometers on the aircraft.
2.4 WVSS-II (wvssF, wvssR)
Figure 1. External view of WVSS-II fitted to FAAM aircraft
show-ing the two inlets (Rosemount, left; flush, right) angled down to match the local air flow in flight.
to remain accurate and stable for long periods with minimal maintenance.
The two units fitted to the FAAM aircraft are installed on window blanks on the starboard side of the aircraft forward of the wing. The windows were selected so that the air reach-ing the inlets should not have passed over the forward door or any other openings in the pressure hull liable to leak cabin air. The substantive difference between the two fitments is in the inlets used: one uses the standard flush inlet (“air sampler”) supplied by SpectraSensors and used on commercial aircraft (wvssF) while the other is fed by a modified Rosemount in-let mounted on a short pylon to locate its mouth 12 cm from the skin (wvssR), which is believed to place it outside the aircraft’s boundary layer (data from BAE Systems); the flush inlet is wholly within it (further consideration of siting of wvssR is described in Vance et al., 2011). The installation is shown in Fig. 1. The instruments themselves are identical with the exception that wvssR had the heater of its sample chamber disconnected by DWD prior to its transfer to the Met Office as it was believed that adequate adiabatic heat-ing would arise in the Rosemount inlet to render the sample heater superfluous, and that its disconnection would permit a more uniform temperature field in the cell, and enhance ac-curacy; the inlet hoses for both units remained heated.
In autumn 2012 wvssF developed a serious problem and was replaced with a new, similarly unmodified, WVSS-II; the inlet and hoses were not changed.
The usable range and accuracy, respectively, are given by the manufacturer as 50–60000 ppmv and±50 ppmv or±5 % of reading, whichever is greater, but the precise lower limit of the instrument is unclear. During the AquaVIT2aircraft hy-grometer intercomparison in 2013 at the Karlsruher Institut für Technologie (KIT), wvssF was seen to report absolute hu-midities down to 0.6 mg m−3when connected to the Aerosol Interaction and Dynamics in the Atmosphere (AIDA) cloud chamber (then containing 0.1 mg m−3) but unpublished, pre-liminary data from intercomparison with the Physikalisch-Technische Bundesanstalt’s (PTB) humidity standard
(Thun-der 3900) as part of AquaVIT2 suggest a lower limit of around 15 mg m−3 (D. Smorgon, personal communication, 2013). It is suspected that the discrepancy was caused by the desorption of water from the walls of the plumbing used to connect wvssF to the humidity standard as this had been open to atmospheric conditions, whereas the plumbing between the instruments and the AIDA chamber had been maintained at a low pressure and low humidity for several days. Previ-ous laboratory work has, however, suggested a lower detec-tion limit of 3.6 mg m−3(Hoff, 2009) but it should, perhaps, be noted that substantial differences in the performance of some WVSS-II units have been seen in the past (Petersen et al., 2010), and that lower limits seen in laboratory studies are very unlikely to be matched in the field.
As previously noted, the WVSS-II has two data outputs: one uses the ARINC 429 protocol, and is used on conven-tional AMDAR installations; the other (used on the FAAM aircraft) uses RS232. The RS232 output has significantly bet-ter resolution than the ARINC 429 (the limitations of which are discussed in Petersen et al. (2008) and Bedka et al., 2006), and also includes “housekeeping” data.
3 Offsets
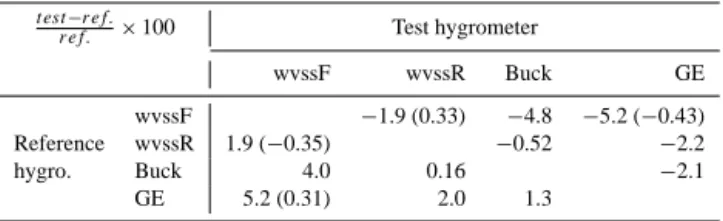
Table 1. Percentage average offsets between pairs of hygrometers.
Where comparison with the new wvssF exists, the value for this is given in parentheses.
t est−ref.
ref. ×100 Test hygrometer
wvssF wvssR Buck GE
wvssF −1.9 (0.33) −4.8 −5.2 (−0.43)
Reference wvssR 1.9 (−0.35) −0.52 −2.2
hygro. Buck 4.0 0.16 −2.1
GE 5.2 (0.31) 2.0 1.3
a number of reasons. Firstly, simply by the nature of field-work, none of the measurements are precisely reproducible. Secondly, most flights occurred as part of specific experi-ments sometimes lasting several weeks at a time that targeted particular areas and conditions. It is therefore likely that any “drift” calculated would include some element due the differ-ing climatologies, the significance of which cannot readily be quantified but is believed to be substantial. Where data exist, figures are shown for the new wvssF, after the old (in paren-theses, Table 1). It should be noted, however, that annual laboratory calibrations of the Buck indicate minimal drift. Comparison to the PTB’s Thunder 3900 during AquaVIT2 suggest that wvssF may under read by around 3 % which, al-though significant with respect to the comparisons presented here, is well within SpectraSensors’ specifications.
4 Cloud-free comparisons
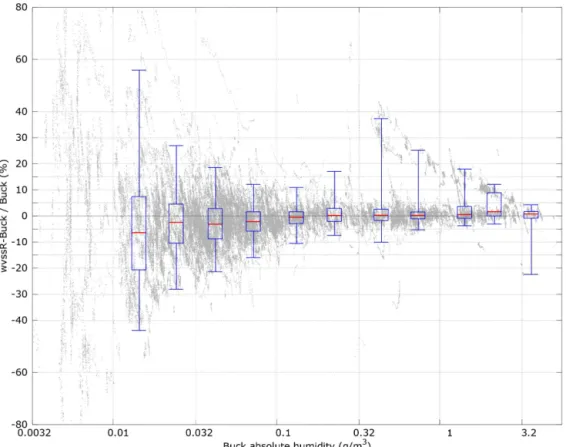
Data were selected in the same manner as for the offset assessment, except that in all cases the differential rate of change used was that relating to the two chilled mirror de-vices (chosen as they are the slowest responding, and least stable, instruments); this ensures that in all cases the data under consideration come from measurements of the same air. As here we are interested in comparing the relative per-formance of the hygrometers rather than the quality of their absolute calibration, in each case, the single-figure offset (Table 1) has been used to adjust the data; this also per-mits the inclusion of data from the new wvssF alongside the old. Figures 2–4 show comparisons of the four hygrometers plotted as [instrument 1]-minus-[instrument 2] as a age of [instrument 2], versus [instrument 2]. This percent-age measure was chosen to facilitate the graphical represen-tation of differences otherwise spanning several decades. In each, boxes are overlaid indicating the median and upper and lower quartiles, with whiskers denoting the 2nd and 98th per-centiles, of the difference between the instruments (calcu-lated in bins, plotted at bin medians).
It is immediately clear that the criteria used to select data, although strict, do still permit the inclusion of some “bad” data; in the interests of preserving objectivity, however, no attempt to remove these has been made. It is also clear that comparison below 0.02 g m−3is hampered by a lack of good
data and that all four hygrometers agree in more humid con-ditions.
The Buck and wvssR show excellent agreement (within the interquartile range (IQR)) throughout the range of ob-served humidities, with the median being within±3 % for most of this range (Fig. 2). Although the Buck CR-2 should be able to measure substantially lower humidities than the WVSS-II, in the past the FAAM Buck has struggled to produce mirror temperatures below−70◦C (behaviour also noted at AquaVIT2), which may contribute to the agreement seen here in drier conditions, possibly masking some over-reading of the wvssR.
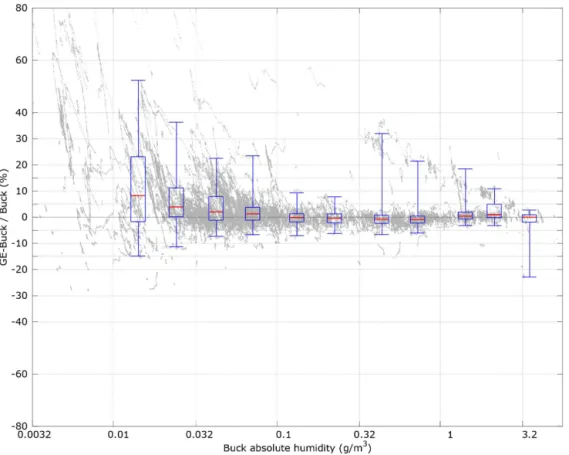
Although the GE and Buck agree to within the IQR throughout most of their range (Fig. 3), the GE exhibits an increasing tendency to over-read below 0.1 g m−3, which ap-proximates to a mirror temperature of around 230 K. This is typical of the frost points encountered when the ambient temperature is around 250 K, supporting FAAM’s suspicions of a possible positive bias below 250 K due to desorption of retained water from internal surfaces.
The performance of the wvssF is more problematic (Fig. 4). Although above 1 g m−3 wvssF and wvssR agree very well, with an IQR of 1 % at 2 g m−3, it is clear that the wvssF reads progressively higher than wvssR as the hu-midity reduces, with the difference lying outside the IQR for humidities below 0.5 g m−3. Since the instruments are fun-damentally the same, and measuring the same air mass, the small spread of data might be expected. The substantive dif-ference between the two is in the inlet design; over-reading of the WVSS-II fed from the standard flush inlet has been noted by other groups operating a WVSS-II alongside other hygrometers (A. Hoff and S. Carlberg, personal communica-tions, 2011). It should, however, be borne in mind that be-cause the flush inlet samples air approximately 5 mm from the skin of the aircraft, the performance of this inlet may vary significantly from depending on the type of aircraft and location on that aircraft (A. Hoff, personal communication, 2011; B. Ford, personal communication, 2012); this has not been investigated here.
5 Case studies
In the following case studies, the offsets calculated for the bulk comparison (Sect. 4) and described in Sect. 3, have not been applied.
5.1 Rapid changes
Figure 2. wvssR minus Buck in cloud free conditions. Boxes indicate binned quartiles, with the whiskers at 2nd and 98th percentiles.
where the CDP indicated a liquid water content greater than 0.01 g m−3). The lower panel shows absolute humidity from the five hygrometers with the Buck being shown in green, GE in blue, TWC in purple, and wvssF and wvssR in black and red, respectively. In this case the TWC is calibrated against the wvssF in cloud free conditions. Although this leaves scope for some absolute error, it enables higher relative accu-racy than is achievable using the chilled mirror hygrometers (Abel et al., 2014).
As the aircraft passes from dry to wet conditions, the GE can be seen both to lag behind the other hygrometers and to overshoot substantially. The Buck also overshoots but to a lesser extent, and responds more rapidly, although both chilled mirrors require approximately 50 s to stabilise. The chilled mirrors can also be seen to lag behind the others when going from moist to dry conditions at 150 s. The overshoot from the chilled mirrors is, however, less than when going from dry to moist. The response of the wvssF can be seen to be slower than the TWC but is clearly more rapid than the other hygrometers.
The behaviour of the wvssR is more interesting. It can be seen to agree well with other hygrometers in cloud free con-ditions, with a response rate somewhere between those of the wvssF and Buck but, in the presence of liquid water, it ap-pears to report a value closer to the total water content than that of water vapour. The slower response of the wvssR is
believed to be due, largely, to the greater wetted area of its inlet.
5.2 Liquid water
Figure 6 shows a time series from flight B582 on 11 March 2011, over southern England. The lower panel shows abso-lute humidity from the wvssF (black), wvssR (red) and a measure of the total water content is shown in green with data from the wvssF humidity+CDP liquid water content (chilled mirror data have been omitted for clarity). The up-per panel shows liquid water content (black) and mean vol-ume radius derived from the CDP (red).
Figure 3. GE minus Buck in cloud free conditions. Boxes indicate binned quartiles, with the whiskers at 2nd and 98th percentiles.
to liquid droplets of around 20 µm radius but no susceptibility to cloud with a modal radius of 8 µm. It is therefore not possi-ble to draw conclusions about the importance of droplet size from these data, but it is clear that the wvssR is unreliable in liquid cloud as it can ingest and evaporate some liquid cloud droplets whereas the wvssF does not. This is, perhaps, not surprising as it has been noted that Rosemount housings used for temperature measurements are also susceptible to errors due to wetting in liquid cloud (e.g. Lawson, 1990; Lenschow, 1974).
5.3 Ice clouds
Figure 7 shows a time series from flight B672 on 30 Jan-uary 2012, over the Northwest Approaches and North Chan-nel. The aircraft performed a Lagrangian descent in a “race-track” pattern throughout the depth of cirrus cloud over a pe-riod of hours; the portion of the descent presented here is also discussed by Abel et al. (2014). The upper panel shows abso-lute humidity from three instruments: wvssF (black), wvssR (red) and TWC (purple), which has been calibrated against the wvssR in cloud free conditions; in the interests of clarity, the Buck and GE have been omitted as they were clearly not stable during this period. Four “steps” in the humidity data can be seen, corresponding to four race-tracks at different altitudes. Although small offsets (removed for the bulk
inter-comparison, above) are apparent between the two WVSS-II and the two chilled mirrors, they can be seen to report the same basic conditions. The TWC is, of course, reporting hu-midity arising from all phases. The large increases in total water correspond to the aircraft passing through fall streaks embedded in the cirrus. In these regions the density of ice particles is significantly higher than the background. This lower background ice concentration is evident as “noise” on the TWC trace between the fall streaks. Although the situa-tion is substantially less conclusive than in the case of liq-uid water, there is some suggestion that ice particles may be evaporating in the wvssR and producing enhancements in some of the fall streaks.
The lower panel shows a comparison of wvssR (red) and wvssF (grey) to the Buck during this period in terms of ab-solute humidity, analogous to the plots in Figs. 2–4. As pre-viously noted, the offset removed for the bulk comparison is apparent, as is the gradual over-reading of the wvssF but no differences attributable to the presence of ice are readily apparent.
6 Discussion
Figure 4. wvssF minus wvssR in cloud free conditions. Boxes indicate binned quartiles, with the whiskers at 2nd and 98th percentiles.
0 500 1000 1500 2000
Altitude (m)
0 100 200 300 400 500 600 Time (seconds)
0 1 2 3 4 5
qv
(g m
-3)
(a)
(b)
Figure 5. Time series from flight B668 when the aircraft was
pro-filing in and out of a moist boundary layer with much drier air above. The top panel shows the aircraft altitude with periods in cloud shaded in grey. The lower panel shows absolute humidity from the Buck (green), GE (blue), TWC (purple), wvssF (black) and wvssR (red).
the GE and the Buck in cloud free conditions. The wvssF is found to over-read, progressively, in drier conditions, with the discrepancy between it and the wvssR being outside the IQR below 0.5 g m−3and outside the 2nd/98th percentile
be-0.0 0.2 0.4 0.6
LWC (g m
-3)
0 5 10 15
rv
(
µ
m)
0 200 400 600 800 1000 1200 Time (seconds)
2 3 4 5 6
qv
(g m
-3)
(a)
(b)
Figure 6. Time series from flight B582 showing penetrations of
liquid cloud (chilled mirror data omitted for clarity). Lower panel shows absolute humidity from the wvssF (black), wvssR (red) and
wvssF+CDP liquid water content (green). Upper panel shows
liq-uid water content (black) and mean volume radius (red) derived from the CDP.
com-Figure 7. Time series from flight B672 showing part of a
La-grangian, “race-track” pattern descent through cirrus cloud with embedded fall streaks. Upper panel shows absolute humidity from wvssF (black), wvssR (red) and TWC (purple). Lower panel shows a comparison of wvssR (red) and wvssF (grey) to the Buck during this flight in terms of absolute humidity with boxes indicating upper and lower quartiles.
parison, and this hampers the assessment, particularly in very dry conditions.
Unpublished, preliminary data from AquaVIT2 suggest that although the WVSS-II may be able to measure humidi-ties as low as 0.6 mg m−3 it is likely to over-read substan-tially below 15 mg m−3; there may be evidence to support this from the airborne data presented but uncertainties in the other instruments leave this inconclusive. Preliminary AquaVIT2data also suggest that the wvssR may under read by about 3 % for humidities greater than 0.01 g m−3 and over-read substantially below this value; there may be some support of this in the data presented here. Although the Buck and GE show good agreement in more humid conditions, the GE appears to over-read in drier conditions, supporting FAAM’s suspicion of a positive bias when mirror tempera-tures are below 250 K (FAAM, 2014b).
In order to facilitate comparison of the relative perfor-mance of the hygrometers, calibration offsets between the instruments have been estimated and removed, absolute ac-curacies being better assessed in the laboratory than in the field. Whilst the possibility of calibration drift during the test period is acknowledged, the nature of the flying makes quan-tification of this problematic and so zero drift has been as-sumed. The results presented here, therefore, refer to relative performance only, rather than absolute.
The wvssF shows very rapid response to large changes in humidity, only slightly slower than the TWC. Although the wvssR is noticeably slower to respond than the wvssF, it
is substantially faster than the two chilled mirrors, and nei-ther WVSS-II suffered from the long stabilisation periods of-ten required by the chilled mirror instruments. Although the wvssF appears to be immune to liquid cloud, the wvssR is not, and may, under certain conditions, report a value closer to the total water content than the vapour content. It has not been possible, from these data, to define these specific con-dition, and in order to make use of wvssR data in liquid cloud further investigation would be required. Alternatively, the provision of an inlet capable of measuring dry conditions, as can the Rosemount inlet, but showing the flush inlet’s im-munity to liquid, could usefully be investigated. Similarly, the wvssF appears to be insensitive to ice cloud whereas data suggest that the wvssR may be sensitive to it, although the situation is less clear for ice than liquid water, and further work would be required to properly characterise its perfor-mance under these conditions. Further work is required to characterise biases and offsets between the WVSS-II and the chilled mirror hygrometers, and between the two WVSS-II.
Acknowledgements. The authors wish to acknowledge the
assis-tance of Axel Hoff (DWD), Denis Smorgon (KIT), Bryce Ford (SpectraSensors), FAAM, Directflight Ltd., and Avalon Aero for their assistance in the collection and analysis of presented here, and DWD for provision of two WVSS-II.
Edited by: S. Malinowski
References
Abel, S. J., Cotton, R. J., Barrett, P. A., and Vance, A. K.: A com-parison of ice water content measurement techniques on the FAAM BAe-146 aircraft, Atmos. Meas. Tech., 7, 3007–3022, doi:10.5194/amt-7-3007-2014, 2014.
Baker, R., Curtis, R., Helms, D., Homans, A., and Ford, B.: Studies of the effectiveness of the water vapor sensing system, WVSS-II, in supporting airline operations and improved air traffic capacity, 91st American Meteorological Society Annual Meeting, Seattle, WA, 22–27 January 2011.
Bedka, S., Petersen, R., Feltz, W., and Olson, E.: Evaluation of the WVSS-II Sensor Using Co-located In-situ and Remotely Sensed Observations, 7th International Symposium on Tropo-spheric Profiling: Needs and Technologies, Boulder, CO, 11–17 June 2006, available at: http://www.eol.ucar.edu/istp2006/pdf/5. 03A_Bedka_S.pdf (last access: 16 December 2014), 2006. Brown, P. R. A. and Francis, P. N.: Improved measurement of the
ice water content in cirrus using a total-water probe, J. Atmos. Ocean. Tech., 12, 410–414, 1995.
FAAM: Buck CR2, available at: http://www.faam.ac.uk/index.php/ science-instruments/humidity/112-cr2 (last access: 16 December 2014), 2014a.
FAAM: General Eastern, available at: http://www.faam.ac.uk/ index.php/science-instruments/humidity/111-general-eastern (last access: 16 December 2014), 2014b.
Air-craft for Air Carriers and Society, UCAR, Boulder, CO, available at: https://www.eol.ucar.edu/system/files/spectrasensors.pdf (last access: 16 December 2014), 2004.
General Eastern Instruments: Model 1011B Dew Point Hy-grometer for Aircraft Preliminary Operating Manual, avail-able at: http://www.faam.ac.uk/index.php/component/docman/ doc_download/37-ge-manual (last access: 16 December 2014), 1987.
Hoff A.: WVSS-II Assessment at the DWD, Deutscher Wetterdi-enst, Offenbach am Main, Germany, available at: http://amdar. noaa.gov/docs/WVSS-II_Assessment_DWD.pdf (last access: 16 December 2014), 2009.
Hoff, A.: Advancements in the AMDAR Humidity Sens-ing, Commission for Instruments and Methods of Obser-vations Technical Conference on Meteorological and Envi-ronmental Instruments and Methods of Observation (CIMO-TECO) 30 August–8 September 2010, Helsinki, Finland, avail-able at: http://amdar.noaa.gov/docs/TECO2010_AMDAR_WV_ Helms-Hoff_6.pdf (last access: 16 December 2014), 2010. Lance, S., Brock, C. A., Rogers, D., and Gordon, J. A.: Water
droplet calibration of the Cloud Droplet Probe (CDP) and in-flight performance in liquid, ice and mixed-phase clouds during ARCPAC, Atmos. Meas. Tech., 3, 1683–1706, doi:10.5194/amt-3-1683-2010, 2010.
Lawson, R. P. and Cooper, W. A.: Performance of Some Airborne Thermometers in Clouds, J. Atmos. Ocean. Tech., 7, 480–494, doi:10.1175/1520-0426(1990)007<0480:POSATI>2.0.CO;2, 1990.
Lenschow, D. H. and Pennell, W. T.: On the Measure-ment of In-Cloud and Wet-Bulb Temperatures from an Air-craft, Mon. Weather Rev., 102, 447–454, doi:10.1175/1520-0493(1974)102<0447:OTMOIC>2.0.CO;2, 1974.
Mamrosh, R., Gillis, J., Petersen, R., and Baker, R.: A Compari-son of WVSS-II and NWS RadioCompari-sonde Temperature and Mois-ture Data, 10th Symposium on Integrated Observing and Assim-ilation Systems for the Atmosphere, Oceans, and Land Surface (IOAS-AOLS), Atlanta, GA, 28 January–2 February 2006, avail-able at: https://ams.confex.com/ams/pdfpapers/104889.pdf (last access: 16 December 2014), 2006.
Moninger, W. R., Benjamin, S. G., Dévényi1, D., Jamison, B. D., Schwartz, B. E., Smith, T. L., and Szoke, E.: AMDAR Optimiza-tion Studies at the Earth System Research Laboratory / Global Systems Division, 10th Symposium on Integrated Observing and Assimilation Systems for the Atmosphere, Oceans, and Land Surface (IOAS-AOLS), Atlanta, GA, 28 January–2 Febru-ary 2006, available at: https://ams.confex.com/ams/pdfpapers/ 104488.pdf (last access: 16 December 2014), 2006.
Nicholls, S., Leighton, J., and Barke,r R.: A New Fast Response Instrument for Measuring Total Water Content from Aircraft, J. Atmos. Ocean. Tech., 7, 706–718, 1990.
Petersen, R. A., Feltz, W., Bedka, S., and Olson, E.: Results of the November 2006 WVSS-II - Rawinsonde Intercompar-ison Study, report for NOAA/NWS/OST, University of Wis-consin, Madison, WI, available at: http://amdar.noaa.gov/docs/ UW_WVSS-II_Nov2006_Assessment_FINAL.pdf (last access: 16 December 2014), 2008.
Petersen, R., Cronce, L., Olson, E., Feltz, W., Helms, D., and Baker, R.: WVSS-II Moisture Observations – A Tool for Validating and Monitoring Satellite Moisture Data, EUMETSAT Meteo-rological Satellite Conference, Córdoba, Spain, 20–24 Septem-ber 2010, available at: http://amdar.noaa.gov/docs/Petersen_ presentation.pdf (last access: 16 December 2014), 2010. Vance, A. K., Woolley, A., Cotton, R., Turnbull, K., Abel, S., and
Harlow, C.: Final Report on the WVSS-II Sensors Fitted to the FAAM BAe 146, report for E-AMDAR programme, Met Office, Exeter, UK, available at: http://www.metoffice.gov.uk/ media/pdf/7/r/WVSS_II_final_2011_Tagged.pdf (last access: 6 February 2015), 2011.
WMO: The AMDAR Observing System, available at:
http://www.wmo.int/pages/prog/www/GOS/ABO/AMDAR/ AMDAR_System.html (last access: 16 December 2014), 2014a. WMO: The Benefits of AMDAR to Meteorology and Aviation, WIGOS Technical Report 2014-1, Version 1, January 2014,
available at: https://www.wmo.int/pages/prog/www/GOS/