Chauhan Swati et al. IRJP 2012, 3 (5)
Page 338
INTERNATIONAL RESEARCH JOURNAL OF PHARMACY
www.irjponline.com
ISSN 2230 – 8407
Research Article
METHOD DEVELOPMENT AND VALIDATION OF LEVOCETRIZINE BULK POWDER AND
PHARMACEUTICAL FORMULATION WITH UV SPECTROPHOTOMETRIC ANALYSIS
Chauhan Swati*, Dasadiya Dharti, Patel Shilpa, Kumar Digbijay, Jivani Nurudin
C.U. Shah College of Pharmacy and Research, Wadhwan, India
Article Received on: 20/03/12 Revised on: 11/04/12 Approved for publication: 30/04/12
*Email:[email protected]
ABSTRACT
The aim of this work was to develop and validate a simple estimation method of Levocetrizine in bulk powder and tablet using spectrophotometric method. The method was developed using methanol as a solvent & absorbance was measured at 230nm. Beers law was obeyed in the concentration range of 5-30
μg/ml. Calibration curves shows a linear relationship between the absorbance and concentration. The line equation y=0.0296x+0.0562 with r2 of 0.996 was obtained. Simple, accurate and cost efficient spectrophotometric method has been developed for the estimation of Levocetrizine in bulk powder and Tablet dosage form.
Keywords: Levocetrizine; UV determination; Validation
INTRODUCTION
Levocetrizine (as Levocetrizine dihydrochloride) is a third-generation non-sedative antihistamine, developed from the second-generation antihistamine cetrizine. Chemically, Levocetrizine is the active enantiomer of cetirizine. It is the R-enantiomer of the cetirizine racemate1. IUPAC name of the Levocetrizine dihydrochloride is (RS)-2-{4-[(R)-p-chloro-α -phenyl benzyl]-1-piperazinyl} ethoxy acetic acid dihydrochloride.3
Levocetrizine works by blocking histamine receptor. Levocetrizine is used to treat symptoms of year-round (perennial) allergies in adults and children who are at least 6 months old. It is also used to treat symptoms of seasonal allergies in adults and children who are at least 2 years old. Levocetrizine is also used to treat itching and swelling caused by chronic urticaria (hives) in adults and children who are at least 6 months old. Levocetrizine is called a non-sedating antihistamine as it does not enter the brain in significant amounts, and is therefore unlikely to cause drowsiness. However, some people may experience some slight sleepiness or fatigue. Side effects may include drowsiness, weakness, stuffy nose, sinus pain, sore throat, cough, tired feeling; dry mouth; or weight gain 4
Titration based method has been used for assay of Levocetrizine in raw material & pharmaceutical preparation. However, it has disadvantage of not being accurate method. Due to such error, we have made an attempt to develop more precise & simple spectrophotometric method with greater precision, accuracy and sensitivity for analysis of Levocetrizine in bulk and pharmaceutical formulation. EXPERIMENTAL
Materials
Levocetrizine chemical reference substance (CRS) (assigned purity, 99.8%) was obtained. Levocetrizine tablets were purchased at the local market and were claimed to contain 5 mg Levocetrizine each. All reagents and solvents used were analytical grade. Ultra-pure water was obtained from a Water Purification Unit.
Instrumentation
UV spectrophotometric method was performed on double beam UV-visible spectrophotometer (Shimadzu, model 1700) having two matched quartz cells with 1 cm light path.
Selection of solvents
Different solvents such as water, methanol & acetone were tried for estimation of Levocetrizine in tablet dosage form. Maximum sensitivity was found with Methanol. Hence, Methanol was selected as a solvent for present study. Selection of wavelength
The spectrum of Levocetrizine was obtained. From the spectra absorption maxima of 230nm was obtained.
Preparation of standard solutions
100 mg of Levocetrizine powder was taken in 100ml volumetric flask.20ml of methanol was added to dissolve & volume was made up.10ml of the resulting solution was further diluted up to 100ml. The final solutions were prepared such as to produce concentration of 5, 10,15,20,25 mcg/ml. Absorbance was measured at 230 nm. Calibration curve was obtained by plotting a graph absorbance Vs concentration. The concentration of sample was determined from calibration curve.
Preparation of sample stock solutions
To measure the Levocetrizine content of tablet, twenty tablets were weighed, the mean weight was determined. Weight of the powder equivalent to 5mg Levocetrizine was transfer to 50 ml volumetric flask. To this flask 50ml of methanol was added and shaken for 15 minutes, Resulting solution was 500mcg/ml. the solution was filter and 10ml of filtered solution was transferred to 50ml volumetric flask and diluted to the mark with methanol to get 100mcg/ml.
VALIDATION OF UV SPECTROPHOTOMETRIC METHOD
Linearity and range
Ability of the method to elicit test results that are directly proportional to the concentration of analyte.6 The linearity was determined by analyzing 5 independent levels of calibration curve in the range of 5-25μg/ml. Absorbance of each solution against methanol was recorded at curve of absorbance vs. concentration was plotted and correlation co-efficient and regression line equation for Levocetrizine were determined.
Precision
Chauhan Swati et al. IRJP 2012, 3 (5)
Page 339
precision was determined by analyzing Levocetrizine (5-25mcg/ml) three different time points on different days and %RSD was calculated.
Accuracy
It means the concordance between it and the true or most probable value.7 Accuracy was determined by performing recovery studies by spiking different concentrations of pure drug in the pre-analyzed powder for infusion samples within the analytical concentration range of the proposed method at three different set at level of 80%, 100% and 120%. The amount of Levocetrizine was calculated at each level and % recoveries were computed.
Limit of detection (LOD) and Limit of quantitation (LOQ)
The LOD and LOQ were estimated from the set of 5 calibration curves used to determine method linearity
LOD= 3.3*σ/S and LOQ= 10*σ/S
Where, σ = the standard deviation of y-intercepts of regression lines
S = the slope of the calibration curve
Analysis of marketed formulation (Levocetrizine hydrochloride tablet) by UV spectrophotometric method From the sample stock solution, 1.5 ml was taken in 10 ml volumetric flask and diluted up to the mark with methanol (15 mcg/ml).
RESULTS Linearity
The linearity of Levocetrizine was found to be in the range of 5-25μg/ml with correlation co-efficient 0.996. Calibration data with %RSD is shown in table 1 and calibration curve is shown in Fig.3.
Precision
Intraday precision
%RSD was found to be in the range of 0.18 – 0.84% Interday precision
% RSD was found to be in the range of 0.17– 0.90 % Accuracy
Accuracy of the method was confirmed by recovery study from marketed formulation at three level of standard addition. % Recovery for Levocetrizine was found to be 99.11-101.18. Limit of detection and Limit of quantitation
LOD and LOQ were found to be 0.144mcg/ml mcg/ml and 0.439mcg/ml, respectively.
Analysis of marketed formulation (Levocetrizine Tablet) by UV spectrophotometric method
The percentage of Levocetrizine in marketed formulation (Levocetrizine tablet) was calculated from the calibration curve of Levocetrizine. %Assay was found to be 98.78% as shown in Table 4
DISCUSSION
The proposed method for the determination of Levocetrizine in solid dosage form was found to be precise, selective, rapid and economical. Levocetrizine exhibited maximum absorption at 230 nm and obeyed Beer’s law in the concentration range of 5 – 25mcg/ml. the proposed method for the determination of Levocetrizine showed linear regression y=0.0296x+0.0562
With a correlation coefficient (R2) of 0.996 (Figure 3). A relative standard deviation of 0.65 % was observed on analysis of six replicate samples.
Our studies revealed a recovery percentage of 99.11-101.18%, which indicates that the developed method was simple, rapid and precise. The proposed methods can be used for the drug analysis in routine quality control & method proves to be more economical and easier than the published standard methods.
AKNOWLEDGEMENT
Authors of the present study are thankful to the Lincon Pharma, Rajkot, Gujarat for providing a gift sample.
REFERENCES
1) Tripathi K.D, Essential of medical pharmacology, Jaypee brothers medical publishers, 6th edition, New Delhi, 159
2) Indian pharmacopoeia, volume-II, Govt. of India, Ministry of Health and Family Welfare, Ghaziabad, New Delhi, Indian Pharmacopoeia Commission-2007, 1290
3) Prabu SL, Shirwaikar AA, Shirwaikar A, Kumar CD, Kumar GA.
Simultaneous UV spectrophotometric estimation of ambroxol
hydrochloride and levocetrizine dihydrochloride. Indian J Pharma Sci [serial online] 2008
4) Rang HP, Dale MM, Ritter JM and Flower RJ. Pharmacology. 6th Edition, Elsevier Publication house, New Delhi; 2007, 237
5) International Conference on Harmonization (ICH) (2005) Harmonized Tripartite Guidelines on, Topic Q2(R1), Validation of Analytical
Procedures: Text & Methodology.
6) Sethi P. D., Quantitative Analysis of Drugs in Pharmaceutical formulation, 3rd edition, CBS publisher & distributor, 55
7) Mendham, Denney, Barnes, Thomas, Vogel’s textbook of quantitative chemical analysis, 6th edition, Pearson Education,118-119
TABLE 1 CALIBRATION DATA OF LEVOCETRIZINE BY UV-VIS. SPECTROPHOTOMETRIC ANALYSIS.
Sr. No. Concentration(mcg/ml) Absorbance mean %C.V
1 5 0.189±0.0013 0.68
2 10 0.375±0.0015 0.40
3 15 0.502±0.0020 0.39
4 20 0.637±0.0025 0.39
5 25 0.798±0.0040 0.50
TABLE 2 RESULT OF INTRADAY PRECISION
Concentration(mcg/ml) Absorbance Mean %C.V
5 0.190±0.0016 0.84
15 0.502±0.0016 0.31
Chauhan Swati et al. IRJP 2012, 3 (5)
Page 340
TABLE 3 RESULT OF INTERDAY PRECISION
Concentration(mcg/ml) Absorbance mean %C.V
5 0.188±0.0017 0.90
15 0.503±0.0020 0.10
25 0.799±0.0022 0.17
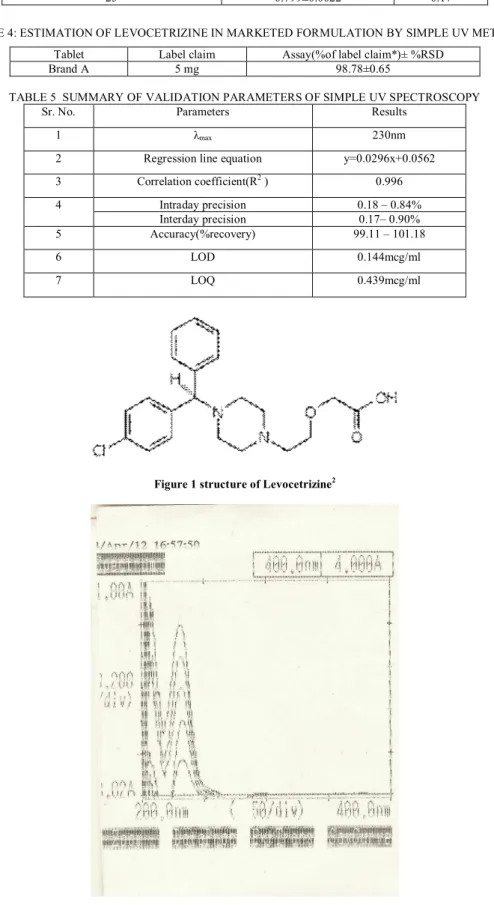
TABLE 4:ESTIMATION OF LEVOCETRIZINE IN MARKETED FORMULATION BY SIMPLE UV METHOD
Tablet Label claim Assay(%of label claim*)± %RSD
Brand A 5 mg 98.78±0.65
TABLE 5 SUMMARY OF VALIDATION PARAMETERS OF SIMPLE UV SPECTROSCOPY
Sr. No. Parameters Results
1 λmax 230nm
2 Regression line equation y=0.0296x+0.0562
3 Correlation coefficient(R2 ) 0.996
4 Intraday precision 0.18 – 0.84%
Interday precision 0.17– 0.90%
5 Accuracy(%recovery) 99.11 – 101.18
6 LOD 0.144mcg/ml
7 LOQ 0.439mcg/ml
Figure 1 structure of Levocetrizine2
Chauhan Swati et al. IRJP 2012, 3 (5)
Page 341 Figure 3 calibration curve of Levocetrizine by simple UV spectrophotometry.