Alex Sander Souza do Carmo
Universidade Estadual de Ponta Grossa
Augusta Pelinski Raiher
Universidade Estadual de Ponta Grossa
Alysson Luiz Stege
Universidade Estadual de Ponta Grossa
Resumo
O objetivo do presente trabalho é analisar a dis-tribuição espacial das exportações brasileiras de manufaturados por microrregiões e por intensida-de tecnológica. O período intensida-de análise é intensida-de 1997 a 2014. Em termos metodológicos, dividiu-se as ex-portações microrregionais em: alta, média e baixa tecnologia; construiu-se um índice de concentração das exportações; e por fi m, realizou-se uma análi-se exploratória de dados espaciais. Evidenciou-análi-se a existência de clusters de exportação para os três tipos de produtos, sendo que no caso das expor-tações de produtos de baixa e média tecnologia os clusters estão dispersos pelo Brasil, ao passo que na exportação de produtos de alta tecnologia os clusters estão concentrados, principalmente, na região sudeste.
Palavras-chave
microrregiões; concentração; exportação; tecnolo-gia.
Códigos JELR12. Abstract
The objective of this study is to analyse the spatial distribution of Brazilian exports of manufactured products considering micro regions and technological intensity. The period under analysis is from 1997 to 2014. To achieve this objective, the micro regional exports were divided into high, medium and low technology; an exports concentration index was built and fi nally, an exploratory analysis of the spatial data was carried out. Results pointed out the existence of exportation clusters for the three types of products, and regarding the low and medium technology products the clusters were seen to be spread throughout Brazil, while the high technology product clusters were seen to be concentrated in the Southeast region.
Keywords
micro regions; concentration; exports; technology.
JEL CodesR12.
Spatial concentration of Brazilian exports
of manufactured products: a microregional
analysis considering technological levels
1
Introduction
The role of exports in the economic growth has been discussed in several studies. In general, what is seen is that a growth strategy guided by expor-tation provides the economy with more effi ciency and competitiveness, improving the economic growth perspective. Authors such as McCombie and Thirlwall (1994), presented the external demand as the main induc-er of the economic dynamics; howevinduc-er, othinduc-ers such as Araújo and Lima (2007), disaggregated such exports for understanding that the intensity of this demand is dependent on the composition of the exports agenda, high-lighting the role of higher technology.
This differentiation of the effects of exports is the direct result of the ex-ports income elasticity of demand and the externalities acquired mainly by the learning processes, which are more intense for the goods with higher technological content (Dosi et al., 1990; Araújo; Lima, 2007). In addition,
other approaches hypothesize that the exports generated by industries with more intensive technologies have higher productive potential and spillovers than the industry with less intensive technology (Crespo-Cu-aresma; Wörz, 2003).
Therefore, several works found in the literature point out that exports are important for the economic development of a country and also that the exports agenda must be considered, since the way it is composed has distinct results in the growth process. Regarding Brazil, some empirical studies highlight this differentiated effect of external insertion on the eco-nomic growth, showing that specialization is an important factor for the economy dynamics (Gallimberti, 2008; Carmo et al., 2012; Gouvêa, 2010). When considering regions, authors in the New Economic Geography emphasize the importance of understanding the international economy functioning through the particularities of each nation, understanding the production specialization found in different parts of the same territory. According to Krugman (1991), in the regional space there are centripetal forces that lead to the formation of productive clusters, which become privileged spaces, with higher ability to generate wealth, presenting op-portunities of broadening scale economies and the productive effi ciency.
vital to increase competitiveness all over the country. More than that, the hypothesis sustains that in these geographical concentrations the produc-tive activity holds higher effi ciency, with better opportunities of interna-tional insertion. Thus, understanding the spatial distribution of exporting regions is even more relevant.
Considering the factors above, the objective of this study was to anal-yse the spatial distribution of Brazilian exports of manufactured prod-ucts considering micro regions and technological intensity from 1997 to 2014. Regarding the methodology used, the micro regional exports were divided into: high, medium and low technology; an index of exports con-centration was built and, fi nally, an exploratory analysis of spatial data was carried out.
In addition to this introduction, the paper contains other four sections. In the second, the theoretical aspects regarding spatial clusters are pre-sented. The third section presents a discussion of the methodological as-pects. The distribution of exports and exporting clusters is presented in the fourth section and, fi nally, the fi fth section holds fi nal considerations.
2
Theoretical aspects regarding spatial
agglomera-tions
Different theories seek to explain the pattern of regional specialization. Some are based on the comparative advantages put forward by Ricardo (1821), in which specialization, and consequent exportation, results from the comparative advantages, which originate in the work productivity dif-ferential between countries. In this model, the country specializes in the production of certain good or service if the relative price of this good or service is higher than its opportunity cost.
This external insertion process impacts the comparative advantage coming from the development of a product, generating external econo-mies for the regions, which in turn stimulates the competitiveness of ex-ported goods. Essentially, there are two paths for these multiplying effects (Souza, 2012): the income effect and the productive process backward and forward linkages. Besides the demand of input by the industry, agriculture and the third sector, the exports base also originates secondary process-ing activities. Simultaneously, some effects result in the fi nal demand as a function of the income and employment growth, impacting the produc-tion for the domestic demand.
Another approach that defends exports as the motor of the economic growth process is the Kaldorian. In this theory, the economic dynamism is directly related to the specialization, mainly of industry products (Kal-dor, 1970). The hypothesis is that, due to the growing scale yield, regions which specialize in industrial activities tend to grow faster than those spe-cialized in other activities.
One of the arguments is that the increase in productivity depends main-ly on the technical progress change rate. At the same time, an increase in productivity might increase technical progress through the investments in new factories and equipment, which depend partly on the product growth, which is determined by the exports section growth. The circular cumula-tive causation process occurs at this point: since productivity growth de-termines competitiveness and the external insertion of the products of a certain region it consequently adds to the production growth, affecting productivity and reinforcing competitiveness (Dixon; Thirwall, 1975).
With this dynamics, the cycle goes on indefi nitely, leading to a cumula-tive growth. Therefore, exports play an essential role in the determination of the economic dynamism and inequalities of regional growth (Krugman, 1991). Also, international insertion broadens directly the market of a gion enabling the exploration of economies of scale, expanding the re-gional clusters, through different multiplying effects.
empha-sized that one of the best ways of understanding the functioning of inter-national economy is to analyse the particularities of each nation.
A new research line was created, called “New Economic Geography”. It seeks to identify economic clusters in the geographical space (Fujita; Krug-man, 2004), since this geographical concentration tends to impact some kind of growing yield.
Basically, the interaction of growing yields, transportation costs and demand, promotes the appearance of a geographical concentration. Ac-cording to Krugman (1991), if economies of scale are not large enough, each manufacturer will prefer to supply the domestic market of a single location, which will be chosen in the place that minimizes transportation costs for being the closest to the highest demand possible. At the same time, the same local demand will be larger where most of the factories are in operation.
Therefore, there is a cumulative circular process in favour of the ex-istence of geographical concentrations: the manufacturers tend to set up businesses where the market is broader, and the market tends to be larger where the companies are located. Another important point refers to the importance of a proper transportation system, which contributes directly to these dynamics and the formation of clusters.
The reasons cited by Marshall (1921) and confi rmed by Krugman (1991) to explain the location of industrial activities, responsible mainly for those growing yields would be: 1) the creation of a joint market of qualifi ed workers, which benefi ts both workers and the companies; 2) higher con-centration of a certain variety of factors at lower cost; and 3) the possibility of a “technological osmosis” or technological spillovers.
To sum up, centripetal forces of geographic concentrations can be listed as: productive activity backward and forward linkages (productive services∕factors), dense and specialized workforce market and knowledge spillovers (Fujita; Krugman, 2004). The clusters are seen as privileged spac-es, with higher ability to generate wealth than if these productive activi-ties were scattered, mainly for presenting higher opportuniactivi-ties of broaden-ing economies of scale.
turn depend on the economies of scale. That is, there is a circular fl ow that once started tends to generate more benefi ts for the region.
Finally, Krugman (2008) pointed out that if the benefi ts of economies of scale of a region overcome the costs of exports transportation, as well as all the negative effects of the part of the population that did not migrate to that local, there is more chance of having a spatial concentration of the productive activity in this region.
3
Methodology
3.1 Data base
The data used in this study comprise exports of the Brazilian micro regions1
during the period from 1997 to 2014, obtained from the site Aliceweb2.
Following the taxonomy proposed by Carmo et al. (2012), exports were
classifi ed according to their technological level in manufactured products of high technology (HT), medium technology (MT) and low technology (LT).
After having separated the micro region exports, the values were used to calculate an Export Concentration Index (ECI). The measurement of this index is in accordance with the view of Betarelli Jr and Almeida (2009), who pointed out that the use of absolute or extensive variables might lead to an inaccurate interpretation of results, since these variables are correlated to the size of the area or the population of certain micro region. Therefore, the authors suggest that the analysis of certain spatial variables be carried out with intensive (or relative) variables as these will provide more accurate results regarding the spatial distribution.
Taking that into consideration, this study will evaluate the spatial distri-bution of exports in Brazil considering its micro regions through an Export Concentration Index (ECI), which was derived from Crocco et al. (2006). Initially this index was developed to identify local productive arrange-ments, so that the main variable under analysis was the industrial employ-ment. In this study, however, the methodology was adapted to identify
1 Originally the data belong to different municipalities and later on are grouped into micro regions.
the spatial distribution of Brazilian exports within micro regions, and the variable under study is the exports.
3.2 Exports concentration index (ECI)
As already mentioned in the previous section, to identify the Brazilian exports spatial clusters, an adaptation of the methodology proposed by Crocco et al. (2006) was made. Originally, this methodology was devel-oped to identify the presence of local productive arrangements, in which the variable under analysis was industrial employment. In this case, the authors developed a concentration index which comprised a linear com-bination of other three indices: Locational Quocient (LQ), Hirschman-Herfi ndahl (HH) and Relative Participation (RP); in which the weight of each of the indices, in the concentration index, was estimated through the multivariate analysis technique (principal component analysis).
The idea proposed in this study is to adapt the concentration index devel-oped by Crocco et al. (2006), in which the variables used are the micro regional exports classifi ed into technological levels. Thus, following the original strate-gy, fi rstly, the three concentration indices of exports, Locational Quocient (LQ), Hirschman-Herfi ndahl (HH) and Relative Participation (RP), are measured, and then the weight of each of these indices is estimated through the principal component technique. Finally, these weights are used to measure the concen-tration index of exports of high, medium and low technology products.
In other words, in this methodology the variables to be used to measure the three concentration indices are: Xik, which corresponds to the micro
region i exports of the product k; Xi which denotes the total exports of the
micro region i; Xk which is the Brazilian exports of the product k; and X
that is the total Brazilian exports. The index k refers to the type of product exported, which can be: LT = low technology; MT = medium technology or HT = high technology.
Regarding the concentration indices, the fi rst to be calculated is the Lo-cational Quocient (LQ), which is defi ned as:
(1)
k i
k i
i k
X X QL
X X
The second concentration index to be measured corresponds to a change in the Hirschman-Herfi ndahl (HHm) index:
Finally, the third index taking part in the concentration index of exports is the Relative Participation (RP):
The linear combination of the three indices previously described (LQ, HHm, RP), which must be normalized, will result in an Exports Concen-tration Index (ECI ik), in relation to the product k, for the micro region i,
that is:
The parameters θ1k, θ 2 k, θ
3
k are, respectively, the weights of indices LQ,
HHm and RP in the composition of the ECI ik of low (LT), medium (MT)
and high technology (HT). As previously mentioned, the weights will be measured using the principal component analysis, following the proce-dures shown in Tables 1-3. Table 1 reports self-values or variance (and its accumulation) of the three principal components.
Table 1 Variance explained by the principal components
Component Variance explained
by the component Total variance explained
1 β1 β1
2 β2 β1 + β2
3 β3 β1 + β2 + β3 (=100%)
Source: Crocco et al. (2006).
Table 2, in turn, reports the matrix of coeffi cients or the correlation matrix eingenvalues. In this table, it is possible to measure the relative participa-tion of each of the indicators in each of the components.
(2)
k
k i i
i k
X X
HHm
X X
k
k i
i k
X PR
X
(3)
k k k k k k k
i 1 i 2 i 3 i
Table 2 Correlation matrix eingenvectors
Index Component 1 Component 2 Component 3
QL ik α
11 α12 α13
HH ik α
21 α22 α23
PR ik α
31 α32 α33
Sum |α11| + |α21| + |α31| = C1 |α12| + |α22| + |α32| = C2 |α13| + |α23| + |α33| = C3
Source: Crocco et al. (2006).
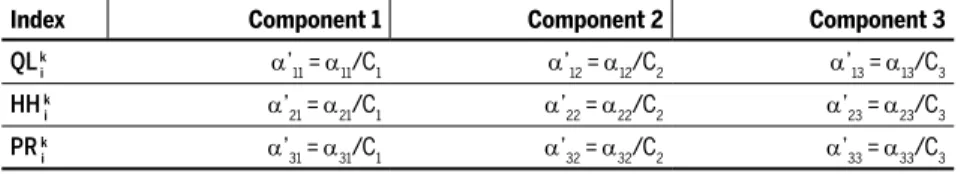
The combination of values in Table 1 with those in Table 2 results in the relative participation of the indices in each component (Table 3).
Table 3 Relative participation of indices in each component
Index Component 1 Component 2 Component 3
QL ik α’
11 = α11/C1 α’12 = α12/C2 α’13 = α13/C3
HH ik α’
21 = α21/C1 α’22 = α22/C2 α’23 = α23/C3
PR ik α’
31 = α31/C1 α’32 = α32/C2 α’33 = α33/C3
Source: Crocco et al. (2006).
Thus, as the α’ij in Table 3 represents the participation of each variable
within each component, and the eingevalues ( βi ) (Table 1) provide the
variance, the weight of each index (LQ, HHm and RP) in the ECI will be the sum of the product of α’ij by the βi , that is:
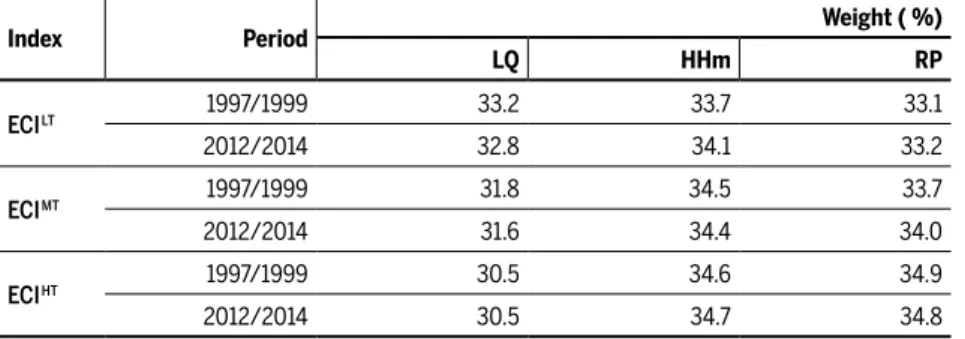
To apply the index, the following procedure was employed: fi rst, in order to facilitate the data analysis, the indices LQ, HHm and RP were measured for each year in the periods from 1997 to 1999 and 2012 to 2014. Then, for each of the indices, the triennial averages were calculated for the periods from 1997 to 1999 and 2012 to 2014. Finally, with these triennial averages, the weights of the indices LQ, HHm and RP were estimated in the compo-sition of the Exports Concentration Index (ECI)3. The weights calculated
are presented in Table 4.
(5)
(6)
(7)
' ' '
1 11 1 12 2 13 3
' ' '
2 21 1 22 2 23 3
' ' '
3 31 1 32 2 33 3
Table 4 Participation of indices LQ, HHm and RP in the composition of the Export Concentration Index (ECI)
Index Period Weight ( %)
LQ HHm RP
ECI LT 1997/1999 33.2 33.7 33.1
2012/2014 32.8 34.1 33.2
ECI MT 1997/1999 31.8 34.5 33.7
2012/2014 31.6 34.4 34.0
ECI HT 1997/1999 30.5 34.6 34.9
2012/2014 30.5 34.7 34.8
Source: Estimated by the authors with research data, using SPSS software.
Note: LT = low technology, MT = medium technology, HT = high technology.
Table 4 shows that the use of the methodology proposed by Crocco et al. (2006) results in higher accuracy for the calculation of the ECI index than when only the simple average of LQ, HHm and RP indices is used. This results from the fact that the weights are different from 1∕3, mainly, regard-ing the high technology products.
3.3 Spatial data exploratory analysis
In this study, the analysis of spatial distribution of the Exports Concentra-tion Index (ECI) was carried out through the techniques of Exploratory Spatial Data Analysis (ESDA). The ESDA aims at describing the ECI spa-tial distribution in the Brazilian micro regions, the patterns of spaspa-tial asso-ciation and the identifi cation of different spatial regimes. Therefore, to im-plement the ESDA, the following techniques were employed: global and local autocorrelation tests and the presentations of LISA3 maps of clusters.
4
Analysis and discussion of results
4.1 The exporting micro regions: evolution and spatial distribution
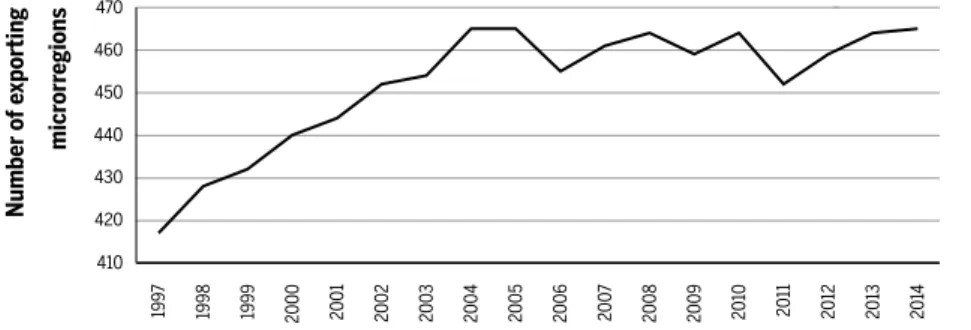
between 1997 and 2004, growing from 389 to 442 micro regions. After some oscillation in the period between 2005 and 2012, the number in-creased again from 2012 to 2014, fi nishing the period with a total of 442 exporting micro regions. Thus, by comparing only the initial year with the fi nal year of the period under analysis (1997 to 2014) the number of micro regions exporting manufactured products was seen to increase by 13.6% (Figure 1).
The increase in the number of exporting micro regions might be related to the process of decentralization of the Brazilian industry observed in recent times, as pointed out in the report issued by the Brazilian National Confedera-tion of Industry (2014). According to this report, the weight of São Paulo indus-try in the national GDP suffered a reduction of 7.9% in the period from 2002 and 2014, however, there was an increase in the participation of industries from other three Southeast States (Rio de Janeiro, Espírito Santo and Minas Gerais), as well as others, located in Middle West, North and Northeast regions.
The increase in the number of exporting regions was also observed in the work developed by Freitas and Paiva (2015). Using a data base with municipal focus, the authors observed that both the average value export-ed per municipality and the number of exporting cities increasexport-ed between 2008 and 2014, going from 1.718 (30.8% of the total of the Brazilian cities) to 1.913 (34.3% of the total).
Figure 1 Number of micro regions exporting manufactured products – Brazil –
1997/2014
Source: Calculated by the authors with data from Aliceweb.
It seems relevant to emphasize that the increase in the number of ex-porting micro regions decreased the concentration of Brazilian exports.
410 450
440
430
420 470
460
micr
orr
egions
2
0
10
2
011 2012 2014
199
7
1998 1999 2000 2001 20
02
2
0
03
2
004 2005 2006 2007 2008 2009 2013
Number o
f e
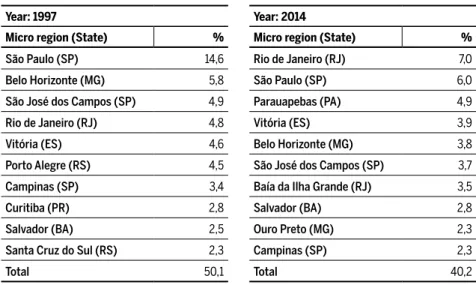
According to data presented in Table 5, when comparing the initial year (1997) and the fi nal year (2014) of the analysis, the ten largest exporting micro regions were seen to have their participation in total exportation of manufactured products reduced from 50.1% to 40.2%. In addition, no relevant alterations were seen in this list, since seven out of the ten main micro regions exporting manufactured products in 1997 were still present in 2014.
Table 5 The ten main micro regions exporting manufactured products –
1997 and 2014
Year: 1997 Year: 2014
Micro region (State) % Micro region (State) %
São Paulo (SP) 14,6 Rio de Janeiro (RJ) 7,0
Belo Horizonte (MG) 5,8 São Paulo (SP) 6,0
São José dos Campos (SP) 4,9 Parauapebas (PA) 4,9
Rio de Janeiro (RJ) 4,8 Vitória (ES) 3,9
Vitória (ES) 4,6 Belo Horizonte (MG) 3,8
Porto Alegre (RS) 4,5 São José dos Campos (SP) 3,7
Campinas (SP) 3,4 Baía da Ilha Grande (RJ) 3,5
Curitiba (PR) 2,8 Salvador (BA) 2,8
Salvador (BA) 2,5 Ouro Preto (MG) 2,3
Santa Cruz do Sul (RS) 2,3 Campinas (SP) 2,3
Total 50,1 Total 40,2
Source: Organized by the authors with data from Aliceweb.
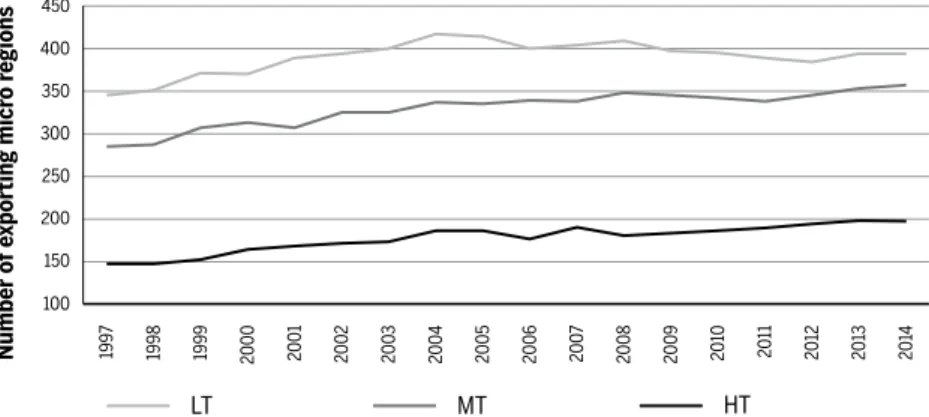
Figure 2 Number of exporting micro regions – Brazil – 1997/2014 – type of product
Source: Calculated by the authors with data from Aliceweb.
Note: HT: High technology; MT: Medium technology; LT: Low technology.
Authors such as Araújo and Lima (2007), for example, demonstrated that the most intense process of economic growth occurs when products with higher technology are exported, mainly due to the elasticity-income of the exports being higher and the generation of externalities that lead to more intense learning processes, fostering increases in productivity and international competitiveness. Regarding the Brazilian micro regions, the number of micro regions internationally inserted with the production of these goods is growing. Clearly, when compared to the other segments, this evolution is modest, but has been increasing, which is an important result for the dynamics of the domestic growth of the country.
It seems also important to highlight that although the literature presents better results for the domestic dynamics when the economy is special-ized in the exports of products that are more intense in technology, this increase in micro regions that specialize internationally in medium-high and low technology goods is also relevant. According to Krugman (1991), it is clear that in order to obtain multiplying effects from a geographic concentration production doesn’t need to be focused only on high tech-nology goods. In his opinion, any productive cluster is a privileged space, with a higher ability to generate wealth, essentially for presenting more opportunities of broadening economies of scale. That is, being specialized and internationally inserted is already a differential for the promotion of economic growth.
100 300
250
200
150 400
350 450
Number o
f e
xporting micr
o r
egions
2
0
10
2
011
2
012 2014
199
7
1998 1999 2000 2001 2002 0302 2004 2005 2006 20
07
2
008 2009 2013
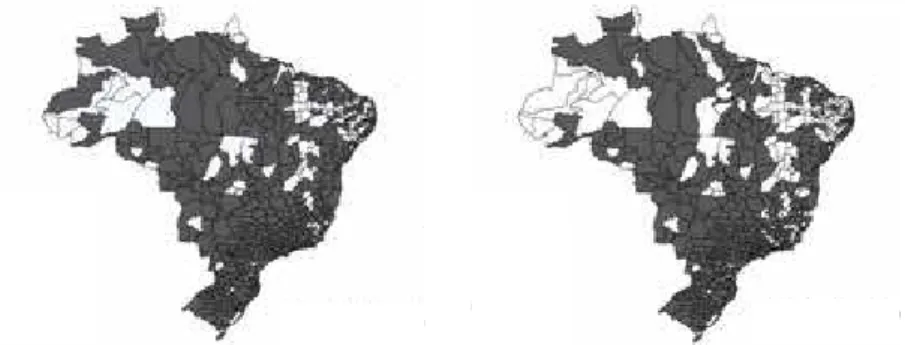
Figure 3 Spatial distribution of Brazilian exports of manufactured products (by type of product) considering micro regions – 2014
Source: Created by the authors with data from Aliceweb.
Note: The maps were built with the software QGis. In such case, the variable used to build the maps was a dichotomous one, with value equal to 1 (one), when the micro region exported determined product and value equal 0 (zero), if otherwise.
The maps shown in Figure 3 present the spatial distribution of exporting micro regions, regarding the type of product in 2014. In these maps, one
Does not export
(I) Manufactured products (II) Low technology manufactured products (LT)
(III) Medium technology manufactured
products (MT)
(IV) High technology manufactured
products (HT)
can see that micro regions exporting low and medium technology prod-ucts are distributed all over the Brazilian territory, while micro regions ex-porting high technology goods are concentrated, mainly, in Southeast and South regions. The States of São Paulo (51), Minas Gerais (26), Rio Grande do Sul (25), Paraná (22), Santa Catarina (16) and Rio de Janeiro (14) amount 154, from a total of 197 micro regions exporting high technology goods.
Some of the reasons for this high concentration of high technology product exports in Southeast and South states might be related to the pres-ence of a large number of universities and research centers, availability of natural resources, governmental incentives, transportation costs and easy access to the external market (Haddad; Perobelli, 2002).
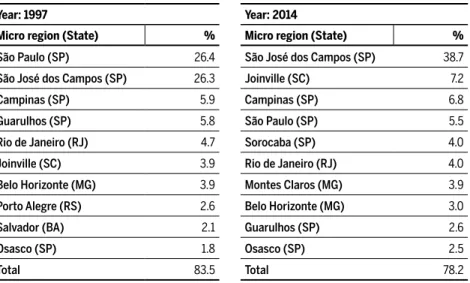
Table 6 shows the ten main micro regions exporting high technology products, with their respective participation in 1997 and 2014. In this table, the exports of the relevant type of product are seen to be concentrated in these ten micro regions, nevertheless, their participation decreased along time, from 83.5% (1997) to 78.2% (2014). It seems relevant to empha-size that despite some changes in positions, the list has not suffered great changes throughout the period under analysis, only the micro regions of Porto Alegre and Salvador were replaced by the micro regions of Montes Claros and Sorocaba.
Table 6 Ten micro regions exporting high technology manufactured products –
1997 and 2014
Year: 1997 Year: 2014
Micro region (State) % Micro region (State) %
São Paulo (SP) 26.4 São José dos Campos (SP) 38.7
São José dos Campos (SP) 26.3 Joinville (SC) 7.2
Campinas (SP) 5.9 Campinas (SP) 6.8
Guarulhos (SP) 5.8 São Paulo (SP) 5.5
Rio de Janeiro (RJ) 4.7 Sorocaba (SP) 4.0
Joinville (SC) 3.9 Rio de Janeiro (RJ) 4.0
Belo Horizonte (MG) 3.9 Montes Claros (MG) 3.9
Porto Alegre (RS) 2.6 Belo Horizonte (MG) 3.0
Salvador (BA) 2.1 Guarulhos (SP) 2.6
Osasco (SP) 1.8 Osasco (SP) 2.5
Total 83.5 Total 78.2
4.2 Analysis of the ECI index spatial dependency and heterogeneity
In this sub-section an exploratory analysis of the Export Concentration Index (ECI) will be carried out by employing ESDA techniques (global Moran’s I, Moran’s dispersion diagram, local Moran’s I and the LISA type cluster map).
The analysis begins with the global Moran’s I, which is used to identify the presence of the ECI spatial dependence. In an attempt to obtain more robust results to build the spatial discrepancy matrix (W), the criterion proximity was based on the type queen, rook and the nearest neighbour (with 10, 15 and 20 neighbours).
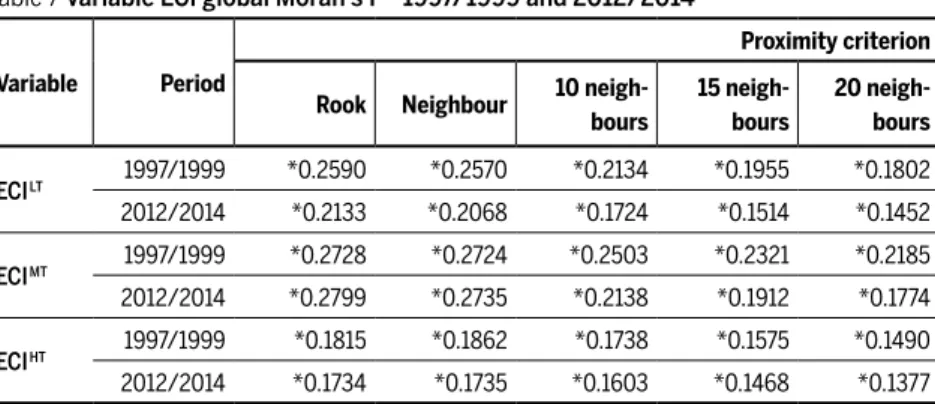
In Table 7, regardless of the way the spatial discrepancy matrix (W)
was built and the type of product under analysis (low, medium or high technology), the indices of Moran’s I presented positive and statistically signifi cant signals at the level of 1%. Therefore, some spatial dependency (or spatial autocorrelation) was seen in the ECI distribution. In addition, as the indices are positive, the autocorrelations are positive; in other words, micro regions with high (low) ECI indices are surrounded by micro regions with high (low) ECI indices.
Table 7 Variable ECI global Moran’s I – 1997/1999 and 2012/2014
Variable Period
Proximity criterion
Rook Neighbour 10 neigh-bours
15 neigh-bours
20 neigh-bours
ECI LT 1997/1999 *0.2590 *0.2570 *0.2134 *0.1955 *0.1802
2012/2014 *0.2133 *0.2068 *0.1724 *0.1514 *0.1452
ECI MT 1997/1999 *0.2728 *0.2724 *0.2503 *0.2321 *0.2185
2012/2014 *0.2799 *0.2735 *0.2138 *0.1912 *0.1774
ECI HT 1997/1999 *0.1815 *0.1862 *0.1738 *0.1575 *0.1490
2012/2014 *0.1734 *0.1735 *0.1603 *0.1468 *0.1377
Source: Estimated by the authors with research data, using the software GeoDa.
Note: * signifi cant at the level 1%, after 999 permutations; LT = Low technology, MT = Medium technol-ogy, HT = high technology.
ECIHT index, in which the “Queen”-type matrix presented a slightly higher
magnitude. In addition, its magnitude altered throughout the period under analysis, and the last period investigated (2012/2014) presented a Moran’s I lower than that of the initial period (1997/1999).
The reduction in the Moran’s I magnitude throughout the periods in-dicates that, although the exports of certain micro region are dependent on the exports of the neighbouring regions, the overfl ow effect decreased with time, which implies that exports have become more concentrated in some micro regions, mainly when it comes to the exports of high tech-nology products, which have lower Moran’s I than those of the low and medium technology. That is, the random effect is higher in its spatial dis-tribution, partly justifi ed by the need for infrastructure, more qualifi ed workforce, university, etc. (Perobelli; Hadad, 2006).
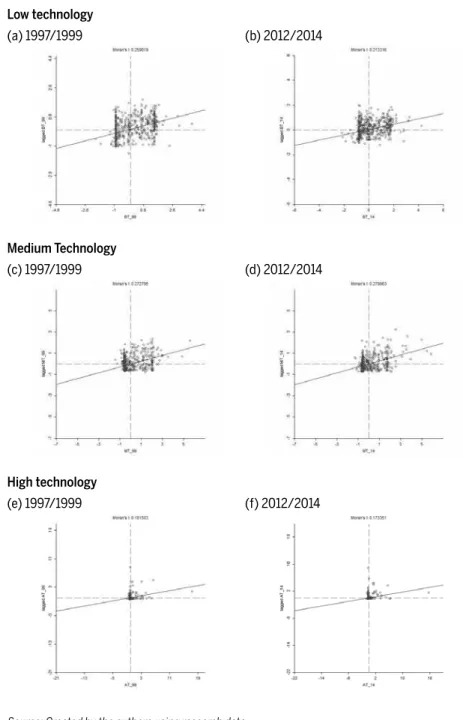
It seems important to highlight that the Moran’s I analysis represented in Table 7 is in accordance with the exploratory analysis of exporting mi-cro regions evidenced in the maps presented in Figure 3, since in those maps it was possible to see that the exports of high technology products was concentrated chiefl y in Southeast and South regions. In an attempt to better understand the global Moran’s I, some dispersion diagrams of the Moran’s I were built, in order to verify what the predominant type of spatial autocorrelation was (Figure 4).
From this point on, the spatial analysis will be carried out using the “Queen”-type matrix as the spatial weight matrix. The use of this ma-trix was chosen because it presented the highest global Moran’s I value in most results (Table 7). This procedure is usual in the exploratory analysis of spatial data as reported in the studies of Rodriguez et al. (2012) and Stege (2015).
Figure 4 Global Moran’s I dispersion Diagram – Brazilian micro regions – 1997/1999 and 2012/2014
Source: Created by the authors using research data.
(a) 1997/1999 (b) 2012/2014
(c) 1997/1999 (d) 2012/2014
(e) 1997/1999 (f) 2012/2014
Low technology
Medium Technology
Figures 4 (a, b, c and d) reveal the existence of spatial outliers, that is, micro regions that do not follow the same process of spatial dependence on the ECI index. One explanation for the existence of such outliers is that certain micro regions presented high values of exports, infl uencing positively the ECI and the Moran’s I for these micro regions, as it is the case, for exam-ple, of the micro region of São José dos Campos in the State of São Paulo, which in 2014 was responsible for 38.7% of the total Brazilian exports of high technology goods. This high value infl uences positively the ECI value and the Moran’s I value, which in turn generates spatial outliers.
The maps shown in Figures 5-7 provide the spatial distribution of the ECI index for low, medium and high technology products, after analysis of the LISA type cluster map, in an attempt to identify the presence of exports clusters in the periods 1997/1999 and 2012/2014. It seems relevant to highlight that these clusters show the presence of possible spatial over-fl ows between neighbouring micro regions.
Regarding the three types of products exported, the presence of four exports clusters was verifi ed: high-high, low-low, low-high and high low3.
Confi rming the global Moran’s I dispersion diagram shown in Figure 4, the clusters low-low and high-high presented higher relevance, mainly, for the low and medium technology products. When high technology products were considered, low-high and low-low clusters prevailed.
The explanation for the occurrence of these clusters originates in the characteristics inherent in each industry segment, so that the lower their technological level, the more intense the workforce in the companies is, interacting more naturally with other domestic productive units, favour-ing the overfl ow of neighbourfavour-ing clusters. While industries with more in-tense technologies presented more specifi c demands, which are in great part internationalized, demanding more qualifi ed workforce, therefore, not being located randomly in the space. Lemos et al. (2003), when analyz-ing this kind of clusters in Brazil, confi rms this argument, presentanalyz-ing them as regionally detached, since they have more external relations and do not present a sectorial complementarity locally. These observations are in
agreement with the number of micro regions inside the clusters, which is larger in the case of low technology products and smaller for high technol-ogy products.
The maps shown in Figure 5 present the spatial distribution of spatial regimes of the ECI index, for low technology products in the periods 1997/1999 (Figure 5-a) and 2012/2014 (Figure 5-b). These maps reveal an alteration in the spatial distribution of spatial clusters. In the period 1997/1999, 57 micro regions were inserted in the high-high cluster, 48 in the low-low, 21 in the low-high and 13 in the high-low cluster. While in the period 2012/2014 the number of micro regions inserted in the high-high cluster reduced to 38, and there was some increase in the num-ber of micro regions in the low-high clusters (26). Other two important points to be taken into consideration in these maps is that the clusters are mainly located in South, Southeast and Northeast regions. And that in the period under analysis an important high-high cluster located in the North region disappeared.
Comparing the number of micro regions belonging to the high-high cluster to the number of those that exported products from the low tech-nology industry (394 micro regions in 2014 – Figure 3), it was seen that not all micro regions that had international insertion managed to be-come an exporting cluster (ECI index above average). That is, between 1997 and 2014 the number of low technology industry exporting micro regions increased but this did not result in intensifi cation of the clusters in this segment. Kaldor (1970), among other authors, pointed out the importance of exports for the economic growth, however, the spatial concentration resulting from this process is fundamental in the domes-tic productive activity feedback, contributing decisively to the economic dynamism of these regions.
Perobelli and Haddad (2006) drew attention to the fact that the fi nal result of the international insertion depends on the nature of the exporting sector, the ability to distribute its benefi ts, and the linkages formed with other sectors of the economy. Since in the case of the Brazilian micro re-gions the number of high-high clusters decreased in a context of increase in the low technology industry exporting micro regions, there is some evidence of potential leakage of the effects of this international insertion throughout the country.
The main source of such leakage might be related to the increase in the dependence on imported input for the production of Brazilian in-dustrial goods, which would disorganize productive chains installed in the country. However, the IEDI (2012) analysing the year 2000 reported that the country increased its coeffi cient of imported input, going from 17.2% in 2005 to 22.4% in 2011, which is a refl ex of the loss of com-petitiveness of Brazilian industries and currency valuing, which leads the industries to use imported inputs, aiming at lowering their product manufacturing costs. And this higher importation was not centralized only in the more intense technology sectors, it also reached some sec-tors of the low technology industry, such as the textile (imported input index was 28.5% in 2011 and 14.05% in 2005).
The maps shown in Figure 6 demonstrate the spatial distribution of the ECI index clusters for medium technology products in the pe-riods 1997/1999 (Figure 6-a) and 2012/2014 (Figure 6-b). The high-high cluster was seen to remain without great changes. While the number of micro regions belonging to the low-low cluster presented some increase, going from 31 to 37 micro regions, which are mainly concentrated in the Center west region. Another important point to be highlighted is that the high-high cluster is mainly located in the Southeast region.
Even if the number of high-high clusters of this industrial segment has not signifi cantly changed, the number of exporting micro regions was highly intensifi ed (285 in 1997 to 357 in 2014 – Figure 3). That is, the results of the external insertion were not effectively turned into the construction of exporting clusters throughout the country.
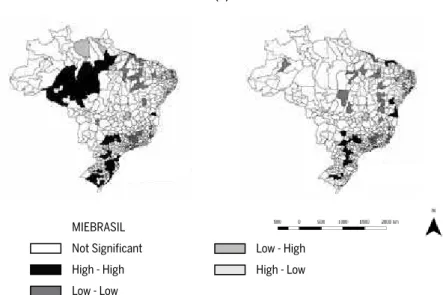
pa-per, the exportation of high technology products is more concentrated in some micro regions than the exports of medium and low technology products. This is more evident when the formation of high-high expor-tation clusters is analyzed, since it has a much lower number of micro regions than that verifi ed for the products previously analyzed. In the maps of Figure 7 it is possible to identify that only 13 micro regions formed the high-high cluster in the period 1997/1999, which was kept stable along the years.
Figure 5 Spatial distribution of the ECI index spatial regimes – low technology products
(LT)
Source: created by the authors with research data using the software GeoDa.
It seems relevant to emphasize that the results observed in Figure 7 are in accordance with those obtained by Freitas and Paiva (2015). In that work, the authors calculated an index to analyze the evolution of the sophistica-tion of municipal Brazilian exports in the period from 2002 and 2014. The analysis showed that the most sophisticated Brazilian exports are highly concentrated in Southeast and South regions. Also, there is a spatial de-pendency on the product sophistication index and the formation of a high-high cluster in the country in the state of São Paulo.
Not Significant High - High Low - Low MIEBRASIL
(a) Period 1997/1999 (b) Period 2012/2014
Figure 6 Spatial distribution of the ECI index spatial regimes – medium technology products (MT)
Source: created by the authors with research data using the software GeoDa.
Regarding goods with more intense technology, higher rigidity in the for-mation of exporting clusters is assumed to exist, mainly due to the de-mand for very specifi c factors in this sector (such as infrastructure, quali-fi ed workforce, etc.), elements which are not found all over the country, but rather in specifi c points (Lemos et al., 2003). And the break in the inter-nal productive chain of this segment through importation was seen as the main point hampering the formation of exporting clusters.
In fact, IEDI (2012) demonstrated that the increase in imported input coef-fi cients occurred more intensely in the sectors with higher technology, as in the case of computing, electronic and optical products (76.7% in 2011 and 49.0% in 2005), pharmaceutical products (44.4% and 38.8%) and airplanes and other transportation equipment (38.1% and 26.4%). That is, the break in the produc-tive chains resulting from the importation of inputs might have been decisive for the low development of exporting clusters of high technology products.
The increase in imported input, in turn, is related to the national indus-try loss of competitiveness, due to the process of exchange rate apprecia-tion started in the mid-2000. Mainly in this case, the process of exchange
(a) Period 1997/1999 (b) Period 2012/2014
Not Significant
High - High Low - Low MIEBRASIL
rate appreciation might generate some change to the exporting agenda towards primary products (Oreiro; Feijó, 2010); in addition, the increase in importation of intermediary goods might provoke some reduction in the participation of the industry in the country aggregated value, resulting in deindustrialization (Palma, 2005). This discussion is not the focus of this research; however, this deceleration observed in the formation of export-ing clusters might be directly related to this process4.
Figure 7 Spatial distribution of the ECI index spatial regimes– high technology
products (HT)
Source: created by the authors with research data using the software GeoDa.
In such context, it is important to rethink the international insertion strate-gies. Deeper changes in the economy, in its cost patterns, productivity and competitiveness, with the creation and application of well-directed industrial policies are necessary so that the country can achieve better results from the international insertion, leading it to a more egalitarian regional development
4 The deindustrialization is understood as a persistent reduction in the participation in in-dustrial employment in the total employment, or even, some loss of the inin-dustrial added value in the GDP (Rowthorn; Ramaswany, 1999; Tregenna, 2009). For further details on dein-dustrialization and reprimarization of exports, see, among others, Bresser - Pereira (2008), Oreiro and Feijó (2010), Bonelli and Pessoa (2010).
(a) Period 1997/1999 (b) Period 2012/2014
Not Significant High - High Low - Low MIEBRASIL
all over the country. Also, it is not enough to start exporting, it is necessary to plan the competitiveness of the whole productive chain linked to the export-ing sector, strengthenexport-ing it so that the direct effects and mainly the indirect ones remain in the country, making it more and more competitive.
5
Concluding remarks
The objective of this study was to analyze the spatial distribution of Bra-zilian exports of manufactured products at the micro regional level and regarding their technological intensity. In order to achieve that, the micro regional exports were classifi ed into different technological levels, low, medium and high technology. Next, an Export Concentration Index (ECI) was measured. Finally, the ECI index spatial analysis was carried out using the Exploratory Spatial Data Analysis (ESDA).
The preliminary analysis of data revealed that the number of exporting micro regions has been growing along time, going from 389 (1997) to 442 (2014). Another important point to highlight is that the number of exporting micro regions was seen to change considerably when the type of product ex-ported was considered, in which it was seen to be higher for low technology products and lower for the high technology ones. In a way this result had been expected, since high technology product production ∕exports involve higher complexity than the low technology product production∕exports. But even with these differences, all technological levels of the industry increased the number of micro regions inserted in the international market.
The theoretical hypothesis was that, for having a higher number of ex-porting micro regions, some externalities would be made effective in the region, introducing a cumulative process, leading, ex post, to the formation
of an exporting cluster, an important characteristic to mitigate regional inequalities. However, that did not occur. On the contrary, in some seg-ments the same number of high-high exporting clusters was kept, while in others it decreased. This, somehow, broke the intensity of the virtuous cycle of growth that might have occurred in the region, not keeping the multiplying effects assumed in the cluster theory.
technology this had been theoretically expected, due to the lack of domes-tic competitiveness of intermediary sectors linked to this production, as well as the lack of infra-structure, research institutes, etc. However, the low technology sector appeared as a surprise, since it managed to increase the number of exporting micro regions, even by reducing the high-high clusters. Since Brazil has comparative advantage in the agriculture and cattle growing production and has abounding non-qualifi ed workforce, the assumption was that new exporting clusters would appear all over the country, fostering employment and income, and introducing the economic dynamics within the micro regions. However, that was not the result. usual disclaimers apply.
References
SISTEMA DE ANÁLISE DAS INFORMAÇÕES DE COMÉRCIO EXTERIOR. ALICEWEB. Available at <http://aliceweb.mdic.gov.br/>. Accessed on May 10, 2015.
ALMEIDA, E. Econometria espacial aplicada. Campinas: Alínea, 2012.
ARAÚJO, R. A.; LIMA, G. T. A structural economic dynamics approach to balance-of-pay-mentsconstrained growth. Cambridge Journal of Economics, v. 31, n. 5, p. 775-774, 2007. BERGER, S. Circular Cumulative Causation (Ccc) a la Myrdal and Kapp: Political
Institution-alism for Minimizing Social Costs. Journal of Economic Issues, 01 de jun. 2008.
BETARELLI JR, A. A.; ALMEIDA, E. Os principais fatores internos e as exportações micror-regionais brasileiras. Revista de Economia Contemporânea, Rio de Janeiro, v. 13, n. 2, p. 201-227, maio/ago. 2009.
BONELLI, R.; PESSOA, S. Desindustrialização no Brasil: um resumo da evidência. IBRE/FGV texto para discussão nº 7, mar. 2010.
BRESSER-PEREIRA, L.C. The Dutch Disease and Its Neutralization: a Ricardian Approach. Revista de Economia Política, v. 28, n.1, 2008.
CARMO, A. S. S.; HIGACHI, H. Y.; RAIHER, A. P. Padrão de especialização no comércio exterior, tecnologia e crescimento econômico do Brasil. Revista de Economia e Administração, v. 11, p. 139-166, abr./jun. 2012.
CONFEDERAÇÃO NACIONAL DA INDÚSTRIA. Perfi l da indústria nos estados 2014. Ed. Rev. – Brasília: CNI, 2014. 214 p.
CRESPO-CUARESMA, J; WÖRZ, J. On export composition and growth. Vienna Economic Papers 0309, University of Vienna, Department of Economics, 2003.
DIXON, R.; THIRWALL, A. A model of regional growth-rate differences on kaldorian lines. Oxford Economic Papers, v. 27, n. 2, p.14-201, 1975.
DOSI, G.; PAVITT, K.; SOETE, L. The economics of technical change and international trade. New York: Harvester Wheatsheaf, 1990.
FEIJÓ, C. A.; CARVALHO, P. G. M.; ALMEIDA, J. S. G. Ocorreu uma desindustrialização no Brasil? Instituto de Estudos para o Desenvolvimento Industrial, Nov. 2005. Available at < http://www.iedi.org.br/admin_ori/pdf/20051129_desindustrializacao.pdf>. Accessed on Mar. 10, 2014.
FREITAS, E.; PAIVA, E. A. Diversifi cação e sofi sticação das exportações: uma aplicação do product space aos dados do Brasil, 20, 2015, Fortaleza. Anais do XX Encontro Regional de Economia, Fortaleza: XX Encontro Regional de Economia, 2015.
FUJITA, M.; KRUGMAN, P. The New Economic Geography: Past, Present and the Future. Papers in Regional Science, n. 83, p. 139-64, 2004.
GALIMBERTI, J. K. Composição das Exportações e Crescimento Econômico: o Brasil no período de 1989-2005. In: INSTITUTO DE PESQUISA ECONÔMICA APLICADA - IPEA. (Org.). Prêmio Ipea - CAIXA 2007: monografi as premiadas. 1ed. Brasília: Instituto de Pesquisa Econômica Aplicada - IPEA, v.1, p. 497-542, 2008.
GOUVÊA, R. R. Padrão de especialização produtiva e crescimento econômico sob restrição externa: uma análise empírica. 2010. 168 f. Dissertação (Mestrado) – Universidade de São Paulo, São Paulo, 2010.
HADDAD, E. A.; PEROBELLI, F. S. Integração regional e padrão de comércio dos estados brasileiros, unidade e fragmentação: a questão regional no Brasil. Perspectiva, n. 284, p. 221-236, 2002.
INSTITUTO DE ESTUDOS PARA O DESENVOLVIMENTO INDUSTRIAL. Por trás dos co-efi cientes de comércio exterior da indústria brasileira. 2012. Available at < http://www.iedi. org.br/artigos/top/analise/analise_iedi_20120514_comercio_exterior.html>. Accessed on Sep. 21, 2016.
JUNIOR, A. A. B; ALMEIDA, E. Os principais fatores internos e as exportações microrregion-ais brasileiras. Revista Economia Contemporânea, Rio de Janeiro, v. 13, n. 2, p. 201-227, mai/ ago 2009.
KALDOR, N. The case for regional policies. Scottish Journal of Political Economy, v. 17, n. 3, p.337-348, 1970.
KRUGMAN, P. A Dynamic Spatial Model. NBER Working Paper, nov. 1991.
KRUGMAN, P. Increasing returns. Prize. Palestra proferida em celebração ao seu prêmio Nobel de 2008. 2008. Available at <http://nobelprize.org/nobel_prizes/economics/video_lec-tures.html>. Accessed on Mar. 10, 2016.
LEMOS, M. B.; SANTOS, F; CROCCO, M. Arranjos produtivos locais industriais sob am-bientes periféricos: os condicionantes territoriais das externalidades restringidas e nega-tivas, 31, 2014, Porto Seguro. Anais do XXXI Encontro Nacional de Economia. Porto Seguro: XXXI Encontro Nacional de Economia. Available at <www.anpec.org.br/ encontro_2003. htm>. Accessed on Sep. 10, 2014.
MCCOMBIE, J.; THIRLWALL A. P. Economic growth and the balance of payments constraint. New York: St. Martin’s Press, 1994.
NORTH, D. Location Theory and Regional Economic Growth. Journal of Political Economy, v. 63, n. 3, p.243-258, 1955.
OREIRO, J. L.; FEIJÓ, C. A. Desindustrialização: conceituação, causas, efeitos e o caso brasileiro. Revista de Economia Política, v. 30, nº 2 (118), p. 219-232, abril-junho/2010. PALMA, G. Quatro fontes de desindustrialização e um novo conceito de doença holandesa.
Conferência de Industrialização, Desindustrialização e Desenvolvimento. Organização: Federa-ção das Indústrias do Estado de São Paulo e Instituo de Estudos para Desenvolvimento Industrial, Ago. 2005. Available at <https://macrododesenvolvimento.fi les.wordpress. com/2013/06/520-20quatro20fontes20_2_.pdf>. Accessed on Aug. 08, 2014.
PEROBELLI, F. S.; HADDAD, E. A. Padrões de comércio interestadual no Brasil, 1985 e 1997. Revista Economia Contemporânea, Rio de Janeiro, v. 10, n. 1, p. 61-88, jan./abr. 2006. RICARDO, D. Principles of political economy and taxation. Londres: John Murray, 1821. RODRIGUES, M.A.; WALESKA, A, C.; CAMPOS, A. C.; PARRÉ, J. L. Identifi cação e análise
espacial das aglomerações produtivas do setor de confecções na região sul. Economia Apli-cada, n. 16, v. 2, p. 311-338. 2012.
ROWTHORN, R; RAMASWANY, R. Growth, trade and deindustrialization. IMF Staff Papers, v. 46, n. 1, 1999.
SOUZA, N. Desenvolvimento econômico. 6. ed. São Paulo: Atlas, 2012.
STEGE, A. L. Análise da intensidade agrícola dos municípios de alguns estados brasileiros nos anos de 2000 e 2010. 2015. 162 p. Tese (Doutorado) - Escola Superior de Agricultura “Luiz de Queiroz”, Universidade de São Paulo, Piracicaba, 2015.
TREGENNA, F. Characterizing deindustrialization: an analysis of changes in manufacturing employment and output internationally. Cambridge Journal of Economics, v. 33, n. 3, maio. 2009.
About the authors
Alex Sander Souza do Carmo - [email protected]
Professor do Programa de Pós-graduação em Economia (PPGEco), Universidade Estadual de Ponta Grossa, Ponta Grossa, Paraná.
Augusta Pelinski Raiher - [email protected]
Professora do Programa de Pós-graduação em Economia (PPGEco), Universidade Estadual de Ponta Grossa, Ponta Grossa, Paraná.
Alysson Luiz Stege - [email protected]
Professor do Programa de Pós-graduação em Economia (PPGEco), Universidade Estadual de Ponta Grossa, Ponta Grossa, Paraná.
About the article