Article
J. Braz. Chem. Soc., Vol. 23, No. 10, 1933-1939, 2012. Printed in Brazil - ©2012 Sociedade Brasileira de Química 0103 - 5053 $6.00+0.00
A
*e-mail: [email protected]
Flavonoids from the Leaves of
Deguelia utilis
(Leguminosae):
Structural Elucidation and Neuroprotective Properties
Dalglish G. de Oliveira,a Cecília M. C. de Almeida,a Consuelo Y. Y. e Silva,a Mara S. P. Arruda,a Alberto C. Arruda,a Dielly C. F. Lopes,b Elizabeth S. Yamada,b Edmar T. da Costab and Milton N. da Silva*,a
aLaboratório de Cromatografia Líquida, Universidade Federal do Pará,
Rua Augusto Corrêa, 01, Guamá, 66075-110 Belém-PA, Brazil
bLaboratório de Neuropatologia Experimental, Hospital Universitário Barros Barreto,
Rua dos Mundurucus, 4487, Guamá, 66073-000 Belém-PA, Brazil
Das folhas de Deguelia utilis foram isolados cinco flavonoides: 5,3’-di-hidróxi-4’-metóxi-2’’,2’’-dimetilcromeno-(5’’,6’’:6,7)-di-hidroflavonol (1), 5,3’-di-hidróxi-7,4’-dimetóxi-6,8-dimetilalil-di-hidroflavonol (2), 5,3’-di-hidróxi-4’-metóxi-8-prenil-2’’,2’’-dimetilcromeno-(5’’,6’’:6,7)-flavanona (3), 5,3’-di-hidróxi-7,4’-dimetóxi-6,8-dimetilalil-flavanona (4), 3,5,3’-tri-hidróxi-7,4’-dimetóxi-6,8-dimetilalil-flavanol (5), juntamente com os estilbenos: 4-metoxilonchocarpeno (6) e lonchocarpeno (7). Suas estruturas químicas foram elucidadas com base nos seus dados de NMR (ressonância magnética nuclear) e HRESITOF-MS (espectrometria de massas de alta resolução por tempo de vôo, com ionização por eletrospray). Além disso, a fim de investigar o potencial efeito citoprotetor desses flavonoides, foi utilizada uma fração eluída com hexano:AcOEt contendo os sete flavonoides, em um modelo in vitro de neurodegeneração, utilizando culturas primárias do hipocampo de ratos neonatal (PND2-P3) expostos à rotenona, um inibidor mitocondrial do complexo I. Houve uma redução significativa da viabilidade celular (19,4 ± 1,6%), quando as culturas foram expostas à rotenona 30 nmol L-1 por 72 h. A exposição concomitante das culturas
a FR3 (5 µg mL-1) e rotenona 30 nmol L-1 resultou em valores de viabilidade celular semelhante
ao grupo controle (99,6 ± 4,8%), sugerindo um efeito citoprotetor para essa fração.
Five new flavonoids, 5,3’-dihydroxy-4’-methoxy-2’’,2’’-dimethylchromene-(5’’,6’’:6,7)-dihydroflavonol (1), 5,3’-dihydroxy-7,4’-dimethoxy-6,8-dimethylallyl-dihydroflavonol (2), 5,3’-dihydroxy-4’-methoxy-8-allyl-2’’,2’’-dimethylchromene-(5’’,6’’:6,7) flavanone (3), 5,3’-dihydroxy-7,4’-dimethoxy-6,8-dimethylallyl-flavanone (4), 3,5,3’-trihydroxy-7,4’-dimethoxy-6,8-dimethylallyl-flavanol (5), together with the stilbenes 4-methoxylonchocarpene (6) and lonchocarpene (7) were isolated from the leaves of Deguelia utilis. Their chemical structures were established on the basis of NMR (nuclear magnetic resonance) spectral data and HRESITOF-MS (electrospray ionization-high resolution time-of-flight mass spectrometry). Also, in order to investigate potential cytoprotective effects of these flavonoids, we used a fraction eluted with hexane:EtOAc containing all seven flavonoids, in an in vitro model of neurodegeneration, using hippocampal primary cultures from neonatal (PND2-P3) rats exposed to rotenone, a mitochondrial complex I inhibitor. There was a significant reduction in cell viability (19.4 ± 1.6%) when the cultures were exposed to 30 nmol L-1 rotenone for 72 h. Concomitant exposure of the cultures to
the FR3 (5 µg mL-1) and 30 nmol L-1 rotenone resulted in values of cell viability similar to control
groups (99.6 ± 4.8%), strongly suggesting a cytoprotective effect for this flavonoid-rich fraction.
Keywords:Deguelia utilis, flavonoids, leguminosae, timbó
Introduction
Brain energy metabolism is highly dependent on mitochondria oxidative phosphorylation, which is an
Parkinson’s disease, amyotrophic lateral sclerosis, Huntington’s disease, as well as others.1 Thus, strategies
aimed at fighting the excess of free radicals may be beneficial for slowing down or arresting the degeneration process and natural products are an attractive source of antioxidant compounds with promising pharmacological properties. Therefore, natural products continue to play a fundamental role in the discovery of leads for developing new drugs for treating human diseases.2
The genus Deguelia belonging to the family Leguminosae comprises 20 species, among which D. rufescens var. urucu and D. utilis are considered the most used by indigenous population of the Amazon region for catching fish. D. utilis is a shrub with wide distribution in the Amazon basin, and it is commonly known in the region as “timbó branco”. This shrub can reach 3 meters of height and its roots are well known for their piscicide and pesticide properties attributed to its high contents of rotenoids such as rotenone and deguelin.3-5 Rotenone, which can be extracted from
Deguelia roots, is a lipophilic mitochondrial complex I inhibitor, and it has been widely used as a neurotoxicant in both in vivo and in vitro models of Parkinson´s disease.6
Regarding studies about Deguelia spp., many phytochemical reports are found in the literature describing the chemistry of the roots.7-12 To date, however, there are
only a few publications about the phytochemical properties of the leaves of these species, and they have reported the presence of several flavonoid compounds with potential antioxidant properties.13,14
In this study we sought to perform a phytochemical characterization of the leaves from D. utilis and investigated the presence of compounds with potential neuroprotective properties. A flavonoid-rich fraction extracted from D. utilis leaves (FR3) was tested for its potential neuroprotective properties in a cell culture model of neurodegeneration induced by rotenone. Our results showed that the use of a very small concentration of the fraction was able to abolish rotenone-induced cell loss, as determined by the MTT colorimetric assay.
Experimental
General
UV spectra were obtained from LC equipped with DAD Prominence SPDM-20A (Shimadzu, Tokio, Japan). NMR spectra including 1H-1H COSY, HETCOR, HMBC
experiments, were recorded on a Varian Mercury-300 spectrometer, operating at 300 MHz at 1H and 75 MHz at 13C, using d-chloroform as solvent and internal standard.
Mass spectral analyses were performed on UltrOTOF-Q
(Bruker, Daltonics Billerica MA, USA) at the cationized ion region. The heated capillary and voltage were maintained at 250 oC and 3 kV, respectively. A 20 V cone energy for
ion extraction and mass spectrometry data were acquired at positive and negative modes for all compounds. HPLC was carried out in a preparative LC-8A Shimadzu system with SPD-10AV Shimadzu UV detector (Tokyo, Japan); using a Phenomenex Gemini C18 column (250 × 10 mm, 5 µm), an isocratic system of water/acetonitrile (3:7) and a flow rate of 4.7 mL min-1. Detection was performed at 270 and
325 nm. All solvents were filtered through a 0.45 µm nylon membrane filter prior to analysis.
Plant material
Approximately 1.3 Kg of green leaves of D. utilis (A. C. Sm.) A. M. G. Azevedo (sinonimia: Lonchocarpus nicou and Derris nicou) were collected in the forest reserve of EMBRAPA -Amazônia Oriental, located in Belém, Pará at 01° S 48° W, 10 m. The plant was identified and a Voucher (Exsiccate IAN 181063) was deposited in the EMBRAPA Herbarium.
Extraction and isolation
An amount of 480 g of dried and powdered D. utilis leaves was extracted with 3 L of ethanol at room temperature for 24 h (two times). The solvent was removed under reduced pressure, furnishing 80 g of crude ethanolic residue, from which 50 g were fractionated in a silica gel (40-60 µm, 1:10) column chromatography with gradient elution: hexane-EtOAc 9:1 (FR1 1.85 g), 7:3 (FR2 2.50 g), 5:5 (FR3 11.63 g, AcOEt (FR4 2.75 g) and EtOAc-MeOH 7:3 (FR5 1.22 g) and MeOH (FR6 8.70 g). Fraction FR3 (0.4 g), was sonicated in 4.8 mL of acetonitrile for 1 min. Next 1.2 mL of H2O was added and sonicated again for
1 min. Solution was subjected to solid phase extraction (SPE) in a C18 cartridge (Phenomenex, 1 g of stationary phase per 6 mL). After evaporation, the residue (about 260 mg) was purified by semi-preparative HPLC yielding compounds 1 (23.0 mg), 2 (42.4 mg), 3 (13.0 mg),
4 (16.2 mg), 5 (11.4 mg), 6 (21.7 mg) and 7 (10.5 mg), which showed chromatographic peak retention times of 11.3, 20.9, 25.0, 31.8, 37.2, 16.6 and 9.4 min, respectively.
Cell culture and rotenone exposure
and incubated for 5-10 min at 37 °C in a trypsin-EDTA 0.05% solution (Invitrogen) for enzymatic digestion, and then transferred to culture medium DMEM containing 10% fetal bovine serum (FBS), 10% horse serum (HS) and penicillin-streptomycin 10,000 U mL-1. After that, the tissue
was mechanically dissociated with a sterile fire-polished Pasteur pipette. The cells contained in the supernatant were then plated at a density of approximately 5 × 10⁵ cells
per well in plates previously treated with poly-L-lysine (100 µg mL-1) containing DMEM supplemented with 10%
FBS, 10% HS and penicillin-streptomycin. The cultures plates were kept in 5% CO2/95% O2 at 37 °C. After three
days, the cultures were replenished with new medium. Until vehicle or rotenone exposure, the cultures were maintained in DMEM supplemented with 2% FBS, 2% HS, and penicillin-streptomycin.15,16
After 7 days in vitro (DIV), the cells were pretreated with increasing concentrations of FR3 (3 µg mL-1, 5 µg mL-1
and 10 µg mL-1) in order to evaluate its toxicity or FR3
plus 30 nmol L-1 rotenone for 72 h. Rotenone was prepared
from a stock solution of 1 mmol L-1 in 0.1% of dimethyl
sulfoxide (DMSO) and then diluted in DMEM to the final concentration. These concentrations of rotenone were chosen, since similar concentrations have been reported in studies of neuron degeneration and/or oxidative stress.17-19
Immunocytochemistry
In order to assure that our protocol resulted in a mixture of neurons and glial cells in the primary cultures, cells were plated in wells containing a coverslip of 13 mm in diameter covered with poly-L-lysine. Antibody against the enzyme tyrosine hydroxylase (Millipore, 1:1000) to characterize catecholaminergic (dopaminergic) neurons was used. Microglia cells were stained with OX-42 antibody (Sigma 1:1000) which recognizes the complement receptor type 3 (CR3), and astrocytes were labeled with anti-GFAP antibody (Sigma 1:2000). After 7 DIV, plates were washed with PBS and fixed with 3.7% formaldehyde in PBS for 30 min at room temperature. The cultures were then washed again and incubated overnight at 4 °C with primary antibody. Next, cells were washed and then incubated for 2 h with a donkey biotinylated secondary antibody (Jackson Immuno Research, 1:200). After washing, cultures were incubated for 1 h with Vectastain ABC reagents diluted according to manufacturer’s instructions. The visualization of the complex formed was done by incubation of cultures with hydrogen peroxide and DAB (3,3’-diaminobenzidine) in PBS. Slides were coverslipped with mounting medium (Permount), and were analyzed and photographed under a Nikon Labophot 2 microscope (Nikon Microscopy Systems).
Cell viability assay
Cell viability was checked using the MTT ((3-(4,5-dimethylthiazol-2-yl)-2,5-diphenyltetrazolium bromide) method. MTT is a salt that is reduced by the mitochondrial dehydrogenase of viable cells and is detected by this assay. Cultures were exposed to 1 µg mL-1 FR3 or
FR3 plus 30 nmol L-1 rotenone, during 3 days, at 37 °C
and 5% CO2. The cells were then washed and incubated
with PBS plus 50 µL of MTT for 3-4 h at 37 °C and 5% CO2. Subsequently, cells were scraped off, transferred to
glass tubes, and the absorbance at 570 nm was measured in a spectrophotometer.
Statistics
Data were expressed as mean ± standard error of mean (SEM). Statistical significance was calculated using the ANOVA associated with Tukey’s test. For comparison of control and rotenone values, the Mann-Whitney U test was used. Differences within the groups of P < 0.05 were regarded as statistically significant.
Results and Discussion
Phytochemical investigation
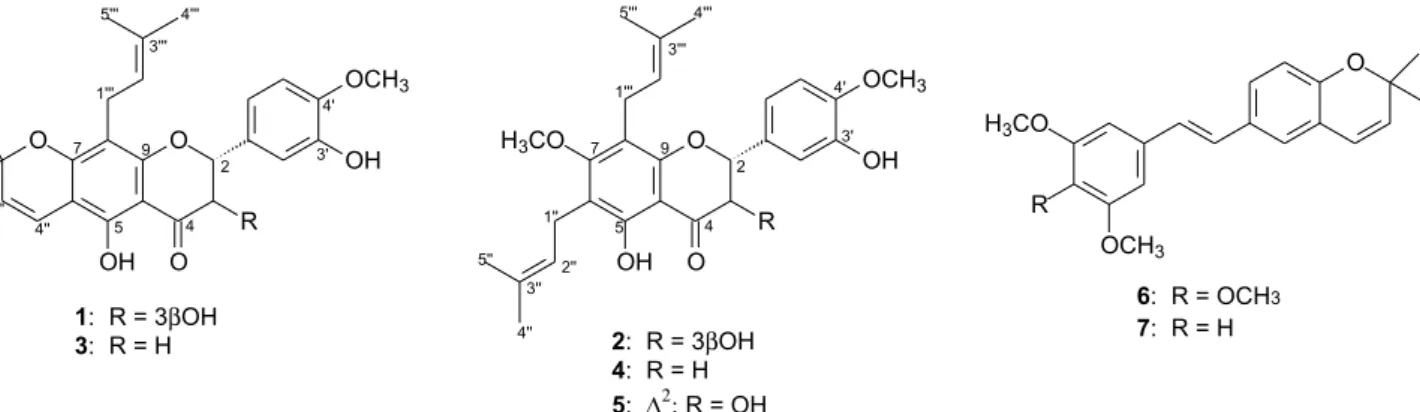
The dried and powdered leaves of D. utilis were extracted with EtOH. The ethanolic extract was fractionated by silica gel column chromatography, which provided six fractions. Chromatographic separation of the hexane:EtOAc 50% soluble fraction by semi-preparative HPLC led to the isolation of pure compounds 1-7 (Figure 1). Compounds
6 and 7 were identified as 4-methoxylonchocarpene and lonchocarpene, respectively, by comparison of their spectral data with those reported in literature.20,21
Compoud 1 was obtained as a pale yellow powder. The molecular formula C26H28O7 was determined by
HRESITOF-MS at m/z 453.1909 [M+H]+ (calc. for
C26H29O7, 453.1913). Its
1H NMR spectrum (Table 1)
exhibited a typical AX system due to H-2 and H-3 of a dihydroflavonol at dH 4.95 (d, J 11.7 Hz) and 4.47 (d,
J 11.7 Hz), respectively. These assignments were confirmed by the 13C NMR spectrum (Table 2), which showed three
C-ring carbon signals at dC 82.8 (C-2), 72.4 (C-3) and
196.2 (C-4). The configuration at C-2/C-3 was determined to be trans on the basis of the magnitude of JH2-H3 11.7 Hz.
Additionally, the 1H NMR spectrum exhibited signals in the
aromatic region at dH 7.14 (d,1H, J 1.6 Hz), 7.02 (dd, 1H,
The signals observed at dH 6.63 and 5.52 (d, 1H each,
J 9.9 Hz) and 1.44 (6H, s) revealed a 2,2-dimethylchromene ring attached to an aromatic ring, and the singlet at dH
11.42 indicated the presence of a hydroxyl group bonded to C-5 and one OMe group at dH 3.91 (dC 55.9) bonded to
the aromatic ring.
All the couplings were confirmed through analysis of the 1H-1H COSY spectrum. In addition to the signals related
to C-ring carbons, the 13C NMR spectrum (Table 2) of 1
exhibited 25 other signals attributed to twenty six carbons with the aid of the HETCOR and HMBC experiments. The 2,2-dimethylchromene ring linked to ring A at C-6 and C-7 and C-prenyl group attached at C-8 were deduced from the 2,3J correlations of the signal at d
H 5.52 (d, J 9.9 Hz
H-3’’) and dH 11.42 (OH-5) with dC 103.1 (C-6), as well
as dH 6.63 (d, J 9.9 Hz, H-4’’) and dH 3.17 (t, J 7.2 Hz,
H-1’’’) with the oxidized carbon at dC 160.6 (C-7). The
location of the OMe and OH groups at C-4’ and C-3’ of the aromatic B-ring, respectively, was supported by the combination of the substitution pattern on the aromatic ring (1,3,4-trisubstituted) observed in the 1H NMR
spectrum with the 2,3J
C,H correlations from the signals at
7.02 (H-6’), 6.89 (H-5’), 7.14 (H-2’) and 3.91(OMe-4’) to oxidized aromatic carbon at dC 147.1 (C-4’) and from
both H-5’ and H-2’ to another oxidized aromatic carbon at dC 145.6 (C-3’). To confirm these positions a NOE
experiment was carried out. Irradiation at dH 6.89 (H-5’)
showed nuclear over house effect with the signals at dH 7.02
(H-6’) and dH 3.91 (OMe). All correlations are observed
in Figure 2. Therefore, the structure of 1 was determined as 5,3’-dihydroxy-4’-methoxy-2’’,2’’-dimethylchromene-(5’’,6’’:6,7)-dihydroflavonol, which we named prenyl-urucuol A.
Compoud 2 was obtained as a yellow amorphous powder and its molecular formula was determined to be C27H32O7 based on its HRESITOF-MS at m/z 467.2117
[M-H]+ (calc. for C
27H31O7, 467.2069). The ion peaks at
m/z 467 are 14 mass units more than the corresponding peaks in 1, suggesting one additional methyl group. The presence of two γ,γ-dimethylallyl groups was evidenced by 1H NMR signals at d
H 3.31 (d, J 6.6 Hz, H-1’’) and
3.22 (t, J 5.7 Hz, H-1’’’); 5.21 (t, J 6.6 Hz, H-2’’) and 5.12 (t, J 6.9 Hz, H-2’’’) and four singlets at dH 1.70 (H3-4’’),
1.79 (H3-5’’), 1.66 (H3-4’’’) and 1.58 (H3-5’’’). An OH-5
signal at dH 11.27 was also observed. The aromatic and
C-ring proton signals of 2 (Table 1), as well as B and C-ring carbon signals (Table 2) were very similar to those of 1. In the 13C NMR spectrum two signals at d
C 55.9 and
dC 61.6 were observed, suggesting a diorthossubstituted
OMe group. Thus, the difference between 1 and 2 is in ring A. The γ,γ-dimethylallyl moiety and one OMe group were confirmed as being attached at C-6 and C-7 (A-ring), respectively, based on the long-range correlations from the signal at dH 3.31 (H-1’’) and dH 11.27 (OH-5) with dC
116.0 (C-6), and dH 3.22 (H-1’’’) and OMe-7 to C-7 (dC
165.9). From these results, the structure of 2 was identified as 5,3’-dihydroxy-7,4’-dimethoxy-6,8-dimethylallyl-dihydroflavonol, named prenyl-isotirumalin.
Compoud 3 was obtained as a yellow amorphous powder and its molecular formula was determined to be C26H28O6 based on its HRESITOF-MS at m/z 437.1998
[M+H]+ (calc. for C
27H31O7, 437.1964). The
1H and 13C NMR data (Tables 1 and 2) of compound 3 were very
similar to those reported for 1, indicating the presence of 1,3,4-trisubstituted and pentasubstituted aromatic rings, as
Figure 1. Structures of the compounds isolated from leaves of Deguelia utilis: prenyl-urucuol A (1), prenyl-isotirumalin (2), 3’-methoxylupinifolin (3), prenylutiline (4), prenylutilinol (5), 4-methoxylonchocarpene (6) and lonchocarpene (7).
well as a 2,2-dimethylchromene ring. The main differences between the spectroscopic data of compound 3 are signals for three double duplets at dH 5.31 (dd, J 3.0 and 12.9 Hz,
H-2), dH 2.81 (dd, J 3.0 and 17.1 Hz, H-3β) and dH 3.05 (dd,
J 17.1 and 12.9 Hz, H-3α), which showed correlations with the signals at dC 78.5 (C-2) and 43.3 (C-3), respectively, in
the HETCOR spectrum, suggesting it to be a flavanone. The substitution pattern of B-ring showed the same AMX system as that of compounds 1 and 2. The presence of OH at C-3’ and OMe at C-4’ was supported by means 3J correlation
at dH 5.71 signal, attributed to OH phenolic, with dC 112.5
(C-2’) and dC 145.7 (C-3’) as well as by irradiation at
dH 3.92 that showed NOE with the signal at dH 6.87 (d,
J 8.4 Hz, H-5’). The presence of OH-5 was confirmed by the signal at dH 12.25. Thus, compound 3 is
5,3’-dihydroxy-4’-methoxy-8-allyl-2’’,2’’- dimethylchromene -(6,7:5’’,6’’) flavanone, named 3’-methoxylupinifolin.
Compoud 4 was obtained as a yellow amorphous powder and its molecular formula was determined to be C27H32O6 based on its HRESITOF-MS at m/z 453.2270
[M+H]+ (calc. for C
27H33O6, 453.2277). The
1H and 13C NMR data (Tables 1 and 2) of compound 4 were very
similar to those reported for 2 and 3.The 1H NMR spectrum
showed signals for three double duplets at dH 5.30 (dd, J 3.0
and 12.9 Hz, H-2), dH 2.82 (dd, J 3.0 and 17.1 Hz, H-3β)
and dH 3.06 (dd, J 17.1 and 12.9 Hz, H-3α), which showed
correlations with the signals at dC 78 .4 (C-2) and 43.5 (C-3),
respectively, in the HETCOR spectrum, thus compound 4
is a flavanone. The substitution pattern of B-ring showed the same AMX system as that of 1, 2 and 3 for B aromatic ring. The presence of OH-5 was confirmed by the signal at
dH 12.05. The presence of two γ,γ-dimethylallyl groups was
evidenced by signals at dH 3.29 (d, J 6.6 Hz, H-1’’) and 3.25
(d, J 6.7 Hz, H-1’’’); 5.21 (tt, J 0.9 and 7.8 Hz, H-2’’) and 5.15 (tt, J 1.5 and 7.8 Hz, H-2’’’) and four singlets at dH 1.68
(H3-4’’), 1.77 (H3-5’’), 1.66 (H3-4’’’) and 1.63 (H3-5’’’). The
signal observed at dH 3.75 (dC 61.6) suggest the presence of
a diorthosubstituited OMe group as observed for 2. Thus the compound 4 is 5,3’-dihydroxy-7,4’-dimethoxy-6,8-dimethylallyl-flavanone named prenylutiline.
Compoud 5 was obtained as a yellow amorphous powder and its molecular formula was determined to be C27H30O7 based on its HRESITOF-MS at m/z 467.2064
[M+H]+ (calc. for C27H31O7, 467.2069). The presence of
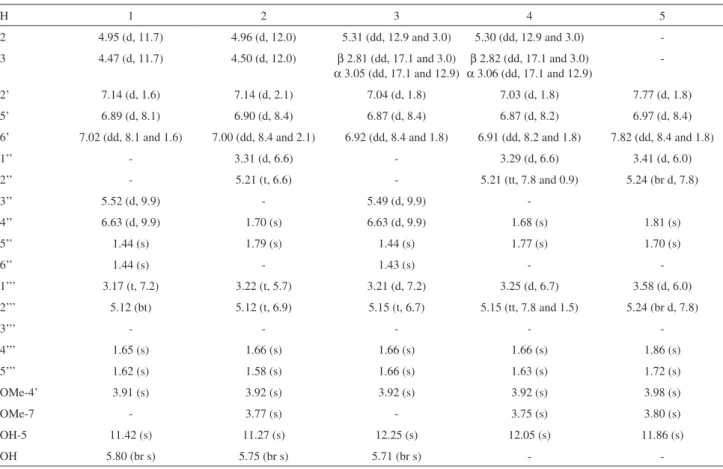
Table 1.1H NMR chemical shifts (d
H in ppm) and coupling constant (J in Hz) of compounds 1-5 in CDCl3
H 1 2 3 4 5
2 4.95 (d, 11.7) 4.96 (d, 12.0) 5.31 (dd, 12.9 and 3.0) 5.30 (dd, 12.9 and 3.0)
-3 4.47 (d, 11.7) 4.50 (d, 12.0) β 2.81 (dd, 17.1 and 3.0)
α 3.05 (dd, 17.1 and 12.9)
β 2.82 (dd, 17.1 and 3.0)
α 3.06 (dd, 17.1 and 12.9)
-2’ 7.14 (d, 1.6) 7.14 (d, 2.1) 7.04 (d, 1.8) 7.03 (d, 1.8) 7.77 (d, 1.8)
5’ 6.89 (d, 8.1) 6.90 (d, 8.4) 6.87 (d, 8.4) 6.87 (d, 8.2) 6.97 (d, 8.4)
6’ 7.02 (dd, 8.1 and 1.6) 7.00 (dd, 8.4 and 2.1) 6.92 (dd, 8.4 and 1.8) 6.91 (dd, 8.2 and 1.8) 7.82 (dd, 8.4 and 1.8)
1’’ - 3.31 (d, 6.6) - 3.29 (d, 6.6) 3.41 (d, 6.0)
2’’ - 5.21 (t, 6.6) - 5.21 (tt, 7.8 and 0.9) 5.24 (br d, 7.8)
3’’ 5.52 (d, 9.9) - 5.49 (d, 9.9)
-4’’ 6.63 (d, 9.9) 1.70 (s) 6.63 (d, 9.9) 1.68 (s) 1.81 (s)
5’’ 1.44 (s) 1.79 (s) 1.44 (s) 1.77 (s) 1.70 (s)
6’’ 1.44 (s) - 1.43 (s) -
-1’’’ 3.17 (t, 7.2) 3.22 (t, 5.7) 3.21 (d, 7.2) 3.25 (d, 6.7) 3.58 (d, 6.0)
2’’’ 5.12 (bt) 5.12 (t, 6.9) 5.15 (t, 6.7) 5.15 (tt, 7.8 and 1.5) 5.24 (br d, 7.8)
3’’’ - - - -
-4’’’ 1.65 (s) 1.66 (s) 1.66 (s) 1.66 (s) 1.86 (s)
5’’’ 1.62 (s) 1.58 (s) 1.66 (s) 1.63 (s) 1.72 (s)
OMe-4’ 3.91 (s) 3.92 (s) 3.92 (s) 3.92 (s) 3.98 (s)
OMe-7 - 3.77 (s) - 3.75 (s) 3.80 (s)
OH-5 11.42 (s) 11.27 (s) 12.25 (s) 12.05 (s) 11.86 (s)
OH 5.80 (br s) 5.75 (br s) 5.71 (br s) -
two γ,γ-dimethylallyl groups was evidenced by 1H NMR
signals (Table 1) at dH 3.41 (d, J 6.0 Hz, H-1’’) and 3.58
(d, J 6.0 Hz, H-1’’’); 5.24 (br d, J 7.8 Hz, H-2’’), as well as four singlets at dH 1.81 (H3-4’’), 1.70 (H3-5’’), 1.86 (H3-4’’’)
and 1.72 (H3-5’’’). In the 1H NMR spectrum a characteristic
proton signal of OH-5 at dH 11.86 was observed as well as
two singlets at dH 3.98 (56.0) and 3.80 (62.0) suggesting a
diorthossubstituted OMe group as observed for compounds
2 and 4. The same AMX patterned substation of the B-ring of compounds 1-4 was observed. Based on the ion peak at m/z 467 and the presence of the 27 signals in the
13C NMR spectrum, compound 5 is a flavonol. An OMe
was establish at C-4 by means of correlations between
dH 6.97 (d, J 8.4 Hz, H-5’), 7.82 (dd, J 1.8 and 8.4Hz,
H-6’) and 3.98 (OMe) with dC 148.2. Thus compound 5
is 3,5,3’-trihydroxy-7,4’-dimethoxy-6,8-dimethylallyl-flavanol named prenylutilinol.
Neuroprotective properties
Immunocytochemical analysis indicated that our culture procedures resulted in a mixed pattern of neurons and glia (Figure 3) with the following composition: 10.38% (± 3.75) of the neurons were catecholaminergic (positive for anti-tirosine hidroxylase antibody), 14.57% (± 2.74) were astrocytes (positive for anti-GFAP antibody) and 9.58% (± 1.97) were microglia (positive for OX-42 antibody), out of the total cell number revealed by counterstaining with Nissl.
In the cultures, exposure to 30 nmol L-1 rotenone for 72 h
resulted in significant reduction (19.4%) in cell viability when compared to control cultures (Figure 4). Exposure to DMSO in the same concentration used to dilute rotenone had no statistically significant effect on cell viability. Likewise, the addition of increasing concentrations (3, 5 and 10 µg mL-1) of the FR3 fraction tested in this study had no
significant effect on the viability of the hippocampal cells. On the other hand, concomitant exposure of the cultures to 30 nmol L-1 rotenone and FR3 fraction of Deguelia leaves
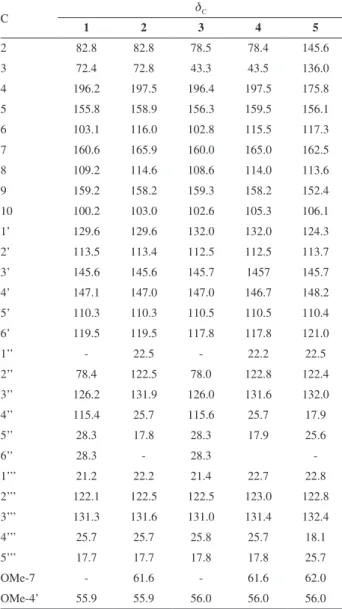
Table 2. 13C NMR chemical shifts (d
C in ppm) of compounds 1-5 in CDCl3
C dC
1 2 3 4 5
2 82.8 82.8 78.5 78.4 145.6
3 72.4 72.8 43.3 43.5 136.0
4 196.2 197.5 196.4 197.5 175.8
5 155.8 158.9 156.3 159.5 156.1
6 103.1 116.0 102.8 115.5 117.3
7 160.6 165.9 160.0 165.0 162.5
8 109.2 114.6 108.6 114.0 113.6
9 159.2 158.2 159.3 158.2 152.4
10 100.2 103.0 102.6 105.3 106.1
1’ 129.6 129.6 132.0 132.0 124.3
2’ 113.5 113.4 112.5 112.5 113.7
3’ 145.6 145.6 145.7 1457 145.7
4’ 147.1 147.0 147.0 146.7 148.2
5’ 110.3 110.3 110.5 110.5 110.4
6’ 119.5 119.5 117.8 117.8 121.0
1’’ - 22.5 - 22.2 22.5
2’’ 78.4 122.5 78.0 122.8 122.4
3’’ 126.2 131.9 126.0 131.6 132.0
4’’ 115.4 25.7 115.6 25.7 17.9
5’’ 28.3 17.8 28.3 17.9 25.6
6’’ 28.3 - 28.3
-1’’’ 21.2 22.2 21.4 22.7 22.8
2’’’ 122.1 122.5 122.5 123.0 122.8
3’’’ 131.3 131.6 131.0 131.4 132.4
4’’’ 25.7 25.7 25.8 25.7 18.1
5’’’ 17.7 17.7 17.8 17.8 25.7
OMe-7 - 61.6 - 61.6 62.0
OMe-4’ 55.9 55.9 56.0 56.0 56.0
Figure 4. Effect of FR3 on the cell viability of primary hippocampal cells in rotenone-treated cultures. 100% corresponds to the total number of cells after 7 DIV in untreated controls. Values represent the means ± SEM of three independent experiments with two wells in each treatment. *p < 0.05 compared to control group. **p < 0.05 compared to rotenone group.
(5 µg mL-1) for 72 h resulted in increased cell viability (to
99.6%), when compared with cell cultures treated with rotenone alone (negative control). These results suggest that FR3 provided significant protection to hippocampal cells against rotenone-induced toxicity.
Importantly, the FR3 fraction is a flavonoid mixture that contains substances 1 to 7. Several studies attribute significant neuroprotective effects to flavonoid compounds, and this has been frequently associated with the antioxidant properties of these substances,22-24 which could explain
the observed cytoprotection effects of FR3 in our animal model of neurodegeneration. Thus, we propose that such an effect is related to the high contents of flavonoids present in the leaves. Noteworthy is the fact that the same species provides high concentration of rotenone, a known neurotoxic compound,25 together with neuroprotective
substances present in its leaves.
Conclusions
The present phytochemical study of the leaves of Deguelia utilis afforded five new flavonoids, named as prenyl-urucuol A (1), prenyl-isotirumalin (2), 3’-methoxylupinifolin (3), prenylutiline (4) and prenylutilinol (5). A fraction containing all these flavonoids (FR3) showed significant cell viability when compared with cell cultures treated with rotenone, a mitochondrial complex I inhibitor, strongly suggesting a cytoprotective effect for this fraction.
Supplementary Information
1H NMR, 13C NMR spectra, HMBC correlations
for compounds 1-5 are available free of charge at http://jbcs.sbq.org.br as PDF file.
Acknowledgments
The authors are grateful to the Conselho Nacional de Desenvolvimento Científico e Tecnológico (CNPq) and to the Fundação de Amparo à Pesquisa do Estado do Pará (FAPESPA) for financial support and scholarships. We are also thankful to Dr. Norberto P. Lopes from the Faculdade de Ciências Farmacêuticas de Ribeirão Preto, USP for the HRESITOF-MS.
References
1. Migliore, L. L.; Coppedè, F.; Mutat. Res. 2009, 674, 73. 2. Newman, D. J.; Cragg, G. M.; Snader, K. M.; J. Nat. Prod.
2003, 66, 1022.
3. Harbone, J. B.; Mabry, T. J.; Mabry, H.; The Flavonoids, 2nd ed.: Chapman & Hall: London,1975, p. 376.
4. Lin, Y. L.; Chen, Y. L.; Kuo, Y. H.; J. Nat. Prod. 1993, 56, 1187. 5. Filho, R. B.; Gottlieb, O. R.; Mourão, A. P.; Phytochemistry
1975, 14, 261.
6. Horowitz, M. P.; Greenamyre, J. T.; Clin. Pharmacol. Ther.
2010, 88, 467.
7. Kaquadji, M.; Agban, A.; Mariotte, A. M.; J. Nat. Prod. 1986, 49, 281.
8. Garcia, M.; Kano, M. H. C.; Vieira, D. M.; do Nascimento, M. C.; Mors, W. B.; Phytochemistry 1986, 25, 2425.
9. Fang, N.; Casida, J. E.; J. Agric. Food Chem. 1999, 47, 2130. 10. Magalhães, A. F.; Tozzi, A. M. G. A.; Magalhães, E. G.; Moraes,
V. R. S.; Phytochemistry 2001, 57, 77.
11. Lawson, M. A.; Kaquadji, M.; Allais, D. P.; Tetrahedron Lett.
2006, 47, 451.
12. Lawson, M. A.; Kaquadji, M.; Chulia, A. J.; Tetrahedron Lett.
2008, 49, 2407.
13. Lôbo, L. T.; da Silva, G. A.; Ferreira, M.; da Silva, M. N.; Santos, A. S.; Arruda, A. C.; Guilhon, G. M. S. P.; Santos, L. S.; Borges, R. S.; Arruda, M. S. P.; J. Braz. Chem. Soc. 2009, 20, 1082. 14. Lôbo, L. T.; da Silva, G. A.; Freitas, M. C. C.; Souza Filho,
A. P. S.; da Silva, M. N.; Arruda, A. C.; Guilhon, G. M. S. P.; Santos, L. S.; Santos, A. S.; Arruda, M. S. P.; J. Braz. Chem. Soc. 2010, 21, 1838.
15. Costa, E. T.; Oliveira, D. S.; Meyer, D. A.; Ferreira, V. M. M.; Soto, E. E.; Frausto, S.; Savage, D. D.; Browning, M. D.; Valenzuela, C. F.; J. Biol. Chem. 2000, 275, 38268.
16. Gao, H. M.; Hong, J. S.; Zhang, W.; Liu, B.; J. Neurosci. 2002, 22, 782.
17. Grammatopoulos, T. N.; Ahmadi, F.; Jones, S. M.; Fariss, M. W.; Weyhenmeyer, J. A.; Zawada, W. M.; Brain Res. 2005, 1045, 64.
18. Testa, C.M.; Sherera, T. B.; Greenamyre, J. T.; Mol. Brain. Res.
2005, 134, 109.
19. Tiwari, M.; Lopez-Cruzan, M.; Morgan, W. W.; Herman, B.; J. Biol. Chem. 2011, 286, 8493.
20. Fang, N.; Casida, J. E.; J. Nat. Prod. 1999, 62, 205.
21. Kaouadji, M.; Agban, A.; Mariotte, A. M.; Tissut, M.; J. Nat. Prod. 1986, 49, 281.
22. Seaton, T. A.; Cooper, J. M.; Schapira, A. H.; Brain Res. 1997, 777, 110.
23. Moldzio, R., Radad. K., Krewenka, C.; Kranner, B.; Duvigneau, J. C.; Wang, Y.; Rausch, W. D.; J. Neural Transm. 2010,117, 5. 24. Radad, K.; Moldzio, R.; Taha, M.; Rausch, W. D.; Phytother.
Res. 2009,23, 696.
25. Da Costa, J. P. C.; Alves, S. M.; Belo, M.; Acta Amaz. 1999, 29, 563.
Submitted: January 28, 2012