Depinning Transitions in Interface Growth Models
F´abio D. A. Aar˜ao Reis
Instituto de F´ısica, Universidade Federal Fluminense,
Avenida Litorˆanea s/n, 24210-340 Niter´oi RJ, Brazil
Received on 16 April, 2003
Pinning-depinning transitions are roughening transitions separating a growing phase and pinned (or blocked) one, and are frequently connected to transitions into absorbing states. In this review, we discuss lattice growth models exhibiting this type of dynamic transition. Driven growth in media with impurities, the competition between deposition and desorption and deposition of poisoning species are some of the physical mechanisms responsible for the transitions, leading to different types of stochastic growth rules. The growth models are classified according to the those mechanisms and possible applications are shown, which include suggestions of experimental realizations of directed percolation transitions.
I
Introduction
The study of surface and interface growth processes at-tracts much interest from the technological point of view mainly because it helps to understand the growth mecha-nisms of nanostructures and, consequently, their physical properties [1]. From the theoretical point of view, they motivated significant advances in non-equilibrium Statisti-cal Mechanics and related fields [2, 3]. TheoretiStatisti-cal mod-eling is usually based on stochastic differential equations or on discrete atomistic models. In various models, chang-ing one parameter leads to a roughenchang-ing transition between a rough and a smooth phase. Two well known examples are the transition in the Kardar-Parisi-Zhang equation in di-mensions d ≥ 3, separating regimes with linear (smooth) and nonlinear growth, and temperature-induced roughening transitions in equilibrium conditions [2]. On the other hand, in the so-called depinning transitions, the interface propa-gates only in the rough phase, being pinned in the smooth phase. Several mechanisms may be responsible for this type of transition, such as the presence of impurities in the growth media, competition between deposition and evapo-ration or formation of poisoning species at the growing sur-face. One of the interesting features of depinning transitions is that they frequently can be mapped onto transitions into absorbing states, whose most prominent example is directed percolation (DP). Different connections of depinning tran-sitions to DP are found in discrete and continuous growth models, as well as connections with other classes of transi-tions to absorbing states [4] and, eventually, with statistical equilibrium transitions. Besides the fundamental interest of these systems, the large variety of interface growth phenom-ena observed in nature suggests them as strong candidates to experimental realizations of models of dynamic transitions, such as DP (see e. g. Ref. [5]).
The aim of the present work is to review the basic
fea-tures of lattice growth models exhibiting depinning transi-tions. Before introducing these systems, we will briefly summarize the theory and phenomenology concerning inter-face growth and phase transitions into absorbing states (Sec. II). Then we will discuss the problem of growing interfaces in disordered media with quenched disorder, in which tran-sitions in the DP class or in the class of the random field Ising model (RFIM) are the most frequently observed (Sec. III). We will be mainly interested in the problems of domain wall motion in the RFIM and directed percolation depin-ning, introduced in the works by Ji and Robbins [6], Tang and Leschhorn [8] and Buldyrev et al [7]. In those systems, the interface becomes pinned when the concentration of im-purities is high enough to generate a blocking cluster run-ning perpendicular to the growth direction. Subsequently, we will discuss a series of models with deposition and evap-oration of weakly bonded atoms which were introduced by Alon et al [9] (Sec. IV). In these systems, the interface is pinned (but is not static) when evaporation rates are suffi-ciently high. Depending on the symmetries of the model, they show transitions in various classes, DP being one pos-sibility. Finally, in Sec. V we will review some recent con-tributions of the present author, who analyzed models of deposition or etching with formation of poisoning species, showing different connections to DP transitions. Conclud-ing remarks are presented in Sec. VI.
II
Basic theory and phenomenology
A. Interface growth
sur-face relaxation of Family [10], the restricted solid-on-solid (RSOS) model of Kim and Kosterlitz [11] and the ballistic deposition (BD) model [12, 13]. These are called limited-mobility models because the diffusion of a deposited atom, whenever possible, takes place in a restricted time interval before the deposition of another atom. More complex mod-els involve the competition among deposition, diffusion and aggregation [14, 15, 16], being able to represent real sys-tems’ features quantitatively.
During the growth process, the average height of the de-posit,h, increases linearly in time, and the growth rate or growth velocity is given by
v=dh
dt. (1)
In general, it is more interesting for the understanding of the growth dynamics to study the scaling of surface roughness. If deposition occurs in ad-dimensional lattice of lengthL, then we define the interface width at timetas
W(L, t) = "*
1 Ld
X
i ¡
hi−h¢
2
+#1/2
, (2)
which characterizes the global roughness of the surface. In this paper, we will usually refer to growth ind+ 1 dimen-sions instead ofd, in order to avoid confusion with conven-tions of system dimensionality.
At early times, in the so-called growth regime, the inter-face width increases as
W ∼tβG
, (3)
where βG is called the growth exponent. At long times, finite-size effects lead to width saturation at
Wsat(L)≡W(L, t→ ∞)∼LαG
, (4)
whereαGis called the roughness exponent. Here, the index Grefers to growth, in order to distinguish these exponents from those of absorbing phase transitions. Fig. 1 illustrates the typical time behavior of the interface width.
Figure 1. Interface widthW versus timetfor the RSOS model (Ref. [11]) in1 + 1dimensions, in two different lattice lengthsL.
Eqs. (3) and (4) are included in the dynamic scaling re-lation proposed by Family and Vicsek [13],
W =LαG
f¡ tL−zG¢
, (5)
wherefis a scaling function andzGis the dynamical expo-nent, given by
zG= αG βG
. (6)
In Eq. (5), the argument of the scaling function is a ratio of the deposition time and the crossover (or saturation) time τ ∼Lz. This crossover occurs when the lateral correlation length of the growth process, measured along the directions parallel to the surface, equals the lattice lengthL. In the di-rection normal to the surface, the correlation length is of the order of the interface widthW.
The exponentsαG,βG and zG of the discrete models are expected to assume values predicted by related contin-uum theories, which represent those processes in the limits L → ∞,t → ∞, defining the universality classes of in-terface growth. The simplest theory for correlated growth was proposed by Edwards and Wilkinson [17], considering that the height distribution obeys certain symmetry require-ments: translation, rotation and inversion symmetry in the directions parallel to the substrate, invariance under transla-tion in time and translatransla-tion along the growth directransla-tion, and reflection symmetry with respect to the mean height (up-down symmetry). These conditions lead to the Edwards-Wilkinson (EW) equation
∂h ∂t =ν∇
2h+η(~x, t), (7)
wherehis the height at the position~xin a d-dimensional substrate at time t, ν represents a surface tension and η is a Gaussian noise with zero mean and variance
hη(~x, t)η(x~′, t′)i = Dδd(~x−x~′)δ(t−t′). Higher order derivatives ofhwhich satisfy the above symmetry require-ments were not written in Eq. (7) because they are irrelevant under renormalization, not affecting the interface width ex-ponents [2]. The dynamical exponent of the EW theory is zG = 2in any spatial dimension; ind= 1,αG = 1/2and βG= 1/4, while ind= 2,αG=βG= 0, with logarithmic scaling in Eqs. (3) and (4) [2, 17].
The Family model [10] and the Wolf-Villain model [18] are two examples of discrete deposition models that belong to the EW class.
In many growth processes, the up-down symmetry is broken by some mechanism of lateral growth. Thus, non-linear terms are included in the continuum growth equation, the more relevant one being proportional to(∇h)2. Includ-ing this extra term in Eq. (7), we obtain the Kardar-Parisi-Zhang (KPZ) equation [19]
∂h ∂t =ν∇
2h+λ
2(∇h)
2
+η(~x, t), (8)
zG = 3/2[19]. Ind= 2, which is the more relevant dimen-sion for real applications, numerical works and renormaliza-tion studies giveαG∼0.4andβG∼0.25[2].
Several discrete models belong to the KPZ class, such as BD [12], the RSOS model [11] and a recently introduced etching model of Mello et al [20].
If the interest is MBE deposition, surface diffusion is an essential mechanism to describe interface width scaling. Its main effects led to the proposal of fourth order linear and nonlinear growth equations, which are reviewed in Refs. [2] and [3].
B. Phase transitions in systems with absorbing states
Here we will review the basic phenomenology of non-equilibrium phase transitions in models with absorbing states, i. e. configurations which can be reached by the dynamics but from which the system cannot leave. Good reviews on this topic and related subjects are in Refs. [4] and [21].
A simple model for the spreading of an infectious dis-ease without immunization qualitatively illustrates this type of transition. Suppose that each individual of a population may be healthy or infected. A healthy individual may be infected upon contact with infected neighbors, while an in-fected one may recover from the disease. At long times, de-pending on the probabilities of contamination and recovery, the spreading process survives or the infection is completely eliminated. In the latter case, the system has evolved into an absorbing state, with no infected individual, and cannot leave that state. Related problems suitable for analytical so-lution are presented in Ref. [21].
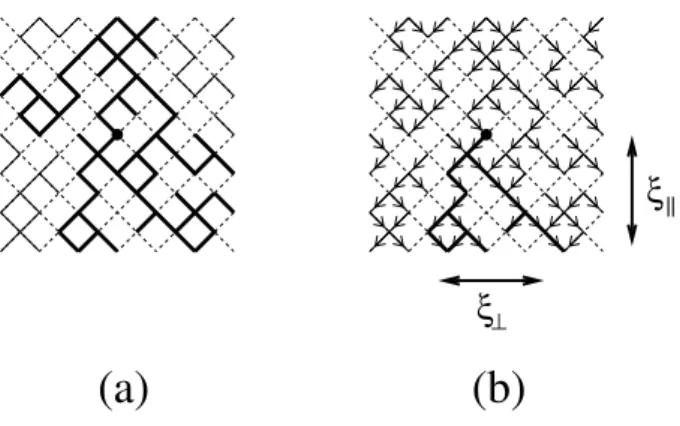
One of the oldest lattice models showing a transition into an absorbing state is directed percolation [22] (DP), which was introduced as a variant of isotropic percolation [23, 24]. Fig. 2 illustrates the formation of clusters in cases of bond percolation, with the same fractionpof active lattice bonds. In isotropic percolation (Fig. 2a), starting from the central lattice site, a cluster is formed with all bonds that are con-nected to the center by a path of active bonds. Some isolated clusters of active bonds appear at the edges of the lattice. On the other hand, in DP, bond connectivity has a preferen-tial direction, illustrated by arrows in Fig. 2b (down-right and down-left directions). Starting from the central site, the cluster of connected bonds is formed following the ar-rows. Thus, bonds which were present in the cluster of the isotropic problem are not present here, since a path with up-wards movements would be necessary to reach them from that starting point.
The order parameter of both models is the probabilityP of a lattice site to belong to an infinite (percolating) clus-ter. For small values ofp, we haveP = 0, because only finite clusters are formed. Aspincreases, the average size of the clusters grow and, at a certain critical probabilitypc, one infinite cluster appears. In two or more dimensions, the transition is continuous, with an increasing fraction of the lattice sites belonging to the infinite cluster forp > pc. The critical behavior of P and other geometric quantities, such
as correlation lengths, are very different in isotropic perco-lation and in DP.
DP ind+ 1dimensions (1 + 1in Fig. 2b) may be in-terpreted as a dynamical process in ad-dimensional system, with time as the additional dimension [4]. The preferential direction of the lattice bonds (vertical in Fig. 2b) is the time direction. Another simple dynamical process with the main features of DP is the contact process [25] (CP), which was introduced as a lattice model for the spreading of an infec-tion, as discussed above. One of the possible versions of the1 + 1-dimensional CP is the particle-hole problem illus-trated in Fig. 3. An empty site at timetmay be occupied by a particle at timet+dtif it has at least one occupied neighbor. The rate of particle creation isnλ/2, wherenis the number of neighboring particles. On the other hand, a particle may be annihilated with rate1, independently of its neighborhood. Thus, the parameterλ, which represents the infection rate, plays the same role of the probability pin the DP problem. In1 + 1dimensions, its critical value is λc = 3.29785±0.00008[26]. The order parameter of the CP process is the occupied fractionρof the lattice, equiva-lent to the probabilityP in the DP model.
ξ
ξ
(a)
(b)
⊥
||
Figure 2. Illustration of (a) isotropic and (b) directed bond perco-lation in a two-dimensional lattice, with the connectivity in the DP problem restricted to the directions indicated by arrows. Solid lines represent active bonds and dashed lines represent inactive bonds, with the same (random) spatial distribution in both figures. Clus-ters generated from the central site are indicated by bold lines. The longitudinal and transversal correlation lengths in the DP problem are indicated.
The order parameters of these dynamical systems are ob-tained from configurational and time averages in their steady states. Near the critical points, they behave as
P ∼(p−pc)βT
i−1 i i+1
t+dt
t
λ/2
λ/2
λ
1
(a)
(b)
Figure 3. The contact process in1 + 1 dimensions, where full (empty) circles represent particles (holes) and crossed circles may represent a particle or a hole; (a) a scheme showing that the state of siteiat timet+dtdepends on its state and on the state of its neigh-bors at timet; (b) the rates associated to creation and annihilation processes.
Other critical exponents describe the spatial and tempo-ral correlations in these dynamical processes, whose charac-teristic lengths are illustrated in Fig. 2a. The longitudinal correlation lengthξkofd+ 1-dimensional DP is a temporal length scale from the point of view of a dynamical process, characterizing the time correlations in this system. On the other hand, correlations along thedspatial dimensions are described by the transversal correlation lengthξ⊥. Near crit-icality, they behave as
ξk∼ |p−pc|νk (10) and
ξ⊥∼ |p−pc|ν⊥. (11) Usually, the critical exponentsνkandν⊥are very different. The best known estimates ind = 1areνk = 1.733847± 0.000006andν⊥ = 1.096854±0.000004[27], and ind= 2 they areνk= 1.295±0.006andν⊥= 0.734±0.004[28]. No exact value of DP exponents ind = 1andd = 2is known yet.
One of the more interesting features of the DP class is that it includes systems defined with very different micro-scopic rules. Models with depinning transitions illustrate this fact, as will be shown in the next sections. Other im-portant examples are forest-fire models [29] and models of catalytic reactions [30]. This observation led Janssen and Grassberger [31, 32] to conjecture that a model should be-long to the DP class if it obeys the following conditions: 1) the model displays a continuous transition from a fluctuating active phase into a unique absorbing state; 2) the transition is characterized by a positive one-component order parameter; 3) the dynamical rules involve only short-range processes; 4) the system has no special attributes, such as additional symmetries or quenched randomness.
This conjecture has not yet been proved rigorously, but it is supported by a large amount of numerical results.
Sur-prisingly, the DP class also includes some models which do not obey one of the above rules [4, 21]. The field-theoretical formulation of DP helps to understand the robustness of the DP class - see e.g. Ref. [4] and references therein.
There are also many non-equilibrium phase transitions into absorbing states that do not belong to the DP class. A class which deserves to be mentioned here is the parity conserving (PC) one, in which the simplest representative model is that of branching annihilating random walks with an even number of offspring [33]. This model is defined by the following reaction-diffusion scheme:
A→λ (n+ 1)A , 2A→α 0, (12) wheren = 2,4,6, . . . denotes the number of offspring and the reaction rates are indicated above the arrows. This dy-namical process conserves the number of particles modulo 2. An absorbing transition is observed for allnwith finite annihilation ratesα. In1 + 1dimensions, the best known estimates of critical exponents for the PC class areβT = 0.92±0.02,νk= 3.22±0.06andν⊥ = 1.83±0.03[34].
III
Growing interfaces in disordered
media
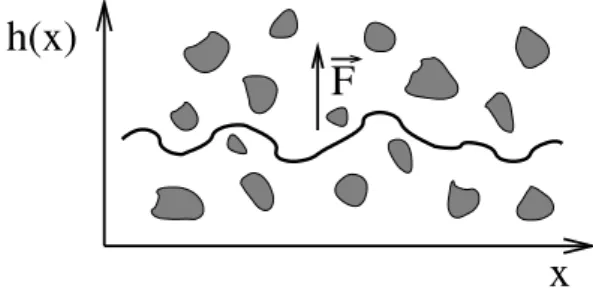
In Fig. 4, we show a schematic representation of the prob-lem of an interface in a disordered medium driven by an external force of modulus F. The disorder acts as an in-homogeneous friction force which pins some parts of the interface. For small values ofF, the interface moves in the direction of the force but will eventually become pinned by the impurities. The interface is depinned with a critical driv-ing forceFc. Near and above this critical value, the growth velocity scales as
v∼(F−Fc)θ, (13) whereθis called the velocity exponent. This exponent and the interface width exponents of the critical interface char-acterize the universality class of the depinning transition.
F
x
h(x)
Figure 4. Schematic representation of a driven interface in a disor-dered media.
They are usually separated in two groups, depending on the effects of anisotropy at the transition points. The first group is that of isotropic growth models, whose main rep-resentative is the problem of domain wall motion in the random-field Ising model [6, 35, 36] (RFIM), and the sec-ond one includes models of directed percolation depinning (DPD) [7, 8]. The common ingredient of these models is the presence of quenched disorder, which eventually form spanning clusters that block an interface growth.
The different universality classes are related to the pres-ence of nonlinear terms in the expected hydrodynamic de-scription of the interface at criticality. The most general equation is the quenched KPZ (QKPZ) equation
∂h
∂t =F+ν∇
2h+λ
2(∇h)
2
+η(~x, h), (14)
where the thermal noiseη(~x, t)of the KPZ equation (8) is replaced by a quenched noiseη(~x, h)[37, 38, 39]. Here, the main idea is that, at criticality, this quenched noise domi-nates the depinning process over the thermal noise. While the models in the DPD class show finite (possibly infinite) coefficientsλof the nonlinear term at criticality, the models in the RFIM class, in the self-affine regimes, have vanish-ing nonlinear terms. Eq. (14) in the caseλ = 0is called quenched EW (QEW) equation. These distinct critical be-haviors reflect the symmetries of the underlying media [40]. Before going further into the discussion of continuum theories, we will introduce the main lattice models.
First we consider depinning transitions in the RFIM. In this problem, spins with possible valuessi =±1at sitesi of a lattice interact through the Hamiltonian
H ≡ −JX hi,ji
sisj− X
i
(hi+H)si, (15)
where the first sum is over pairs of nearest neighbors,J is a ferromagnetic coupling, H is an external uniform field andhi is a quenched local field which represents the dis-order in this system. In the simplest version of the model, J = 1(fixed) andhi is randomly distributed in the interval [−∆,∆]. Thus,∆characterizes the strength of the disorder andHplays the role of the driving force.
The dynamics of an interface separating domains of+1 and−1spins is usually simulated at zero temperature, start-ing from a flat interface, with up (+1) spins above it and down (−1) spins below it. For simplicity,H ≥ 0 is con-sidered. The interface advances by flipping down spins ad-jacent to the interface if it lowers the energy of the system. Regions of down spins which become surrounded with up spins become trapped in that state. Parallel or random up-dates may be considered [35].
For small values ofH, the stable phase of+1spins be-gins to advance at the expense of the−1phase. However, the system will eventually attain a static configuration, in which −1 spins at the interface are frozen by random lo-cal fieldshifavoring this configuration. For a critical field H =Hc(a function of∆), the interface becomes depinned, and moves with finite velocity forH > Hc.
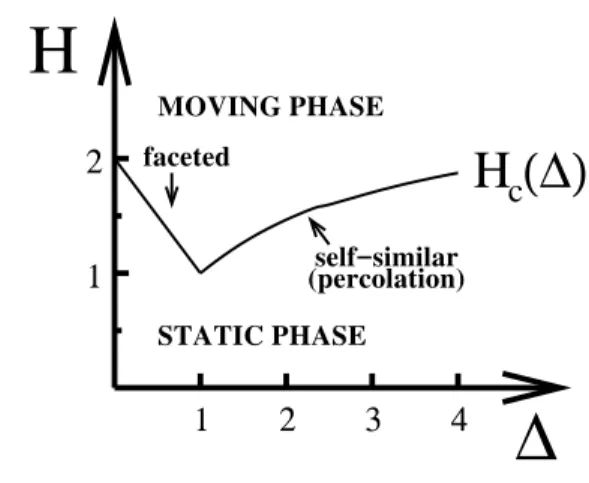
In the1 + 1-dimensional RFIM, two different morpholo-gies may be observed in the critical region: for∆ < 1.0, the interface is faceted, while for∆ > 1it is self-similar. A schematic representation of the phase diagram is shown in Fig. 5. In the self-similar regime (∆ > 1), the in-terface problem cannot be represented by the QEW equa-tion (Eq. 14 with λ = 0), but can be mapped onto site percolation. The local fieldH +hi alone determines the stability of spinsi, then all spins with high enough local fields will eventually be flipped, while the other spins block the growth. At criticality, a critical percolation cluster of
−1spins blocks the growth, the interface being the perime-ter of this clusperime-ter [35, 36]. Consequently, the critical in-terface is self-similar, with roughness exponentαG = 1. Scaling arguments [35] give the velocity exponent θ = ν(dmin+ 1−dF), whereν is the correlation length expo-nent of the percolation problem,dF is the fractal dimension of the critical percolation cluster anddminis the dimension of the shortest paths along that cluster [24].
In2 + 1dimensions, the RFIM shows a transition line in the(∆, H)diagram with a faceted region, a self-similar region and a self-affine region. In this self-affine region, numerical results suggest that the critical interfaces can be represented by the QEW equation. Among these results are the measure of growth velocities of tilted interfaces and of critical roughness exponents [41].
H
1
2
3
4
1
2
Η (∆)
c
∆
STATIC PHASEMOVING PHASE faceted
self−similar (percolation)
Figure 5. Schematic representation of the phase diagram of the random-field Ising model in1 + 1dimensions, whereHis the ex-ternal field and∆is an amplitude of random local fields.
Experiments on fluid flow in porous media are possi-ble realizations of the isotropic class [42, 43, 44]. The for-mer estimates of roughness exponents were scattered in the range0.65−0.91. However, some recently developed meth-ods were applied to analyze theoretical and experimental data and showed that fluid flow in random media formed by packed glass beads were indeed in the RFIM class [45].
results of experiments on paper wetting. Fig. 6a illustrates the process on a square lattice with a fractionpof blocked sites and a fraction1−pof empty sites. Att= 0the inter-face is flat (all heightsh= 0), with all sites below it being wet. Growth proceeds as follows: first, an empty site which is a nearest neighbor of the interface is chosen; then, this site is wet and any other site below it (samex, lowerh) is also wet, independently of being empty or blocked. Thus, the model excludes overhangs.
For smallp, the interface advances with finite velocity. The fraction1−pof empty sites plays the role of the driv-ing force in this model. Whenpattains a sufficiently large value that a DP cluster is formed in the x direction (per-pendicular to the growth direction), the interface becomes pinned. Fig. 6b illustrates the formation of such cluster and the resulting pinned interface. The condition of wetting a whole column justifies the requirement of a DP cluster to stop the growth, since an isotropic percolation cluster would be crossed by the wetting process at the overhangs. Conse-quently, the depinning transition occurs at the DP threshold p= pc ≈0.469of this geometry (connectivity of blocked cells through next nearest neighbors in the square lattice is assumed - see Fig. 6b).
The mapping of this transition onto DP is possible only in1 + 1 dimensions. In higher dimensions, the transition can be mapped onto the problem of percolation of directed surfaces [47].
x
h
x
h
t
1t
2t
3t = t
(a)
(b)
0
Figure 6. (a) The directed percolation depinning model, with empty squares, crossed squares and filled squares representing empty cells, blocked cells and wet cells, respectively. At timet0, the interface (heavy line) is flat. Att=t1andt=t2, one empty cell which has a neighboring wet cell is wet. Att=t3, an empty cell neighboring the interface is wet, and the blocked cell below it is also wet. (b) Pinned interface due to the presence of a directed percolating cluster of blocked cells above it, running along thex direction.
Scaling arguments in1 + 1dimensions give a velocity exponentθ =νk−ν⊥ ≈0.637and a roughness exponent
αG =ν⊥/νk ≈ 0.633at criticality [7, 8]. These relations are supported by numerical estimates of the exponentsθand
αGof the DPD and related models [7, 8, 41].
The first estimate of the roughness exponent in exper-iments on paper wetting were in good agreement with the above theoretical prediction [7], but other authors’ experi-ments provided larger values ofαG[46]. Since it was only
a ratio of exponents that agreed with DP values, it was not clear whether they were indeed experimental realizations of DP. However, experiments on ink flow in a sponge-like ma-terial gave roughness exponents consistent with the exten-sion of the DPD model to2 + 1dimensions [47] (which is not in the DP class), which suggests further experimental studies on these lines.
The above analysis illustrates the fact that the DPD and related models belong to a class of anisotropic depinning. On a phenomenological level, it is believed that the QKPZ equation (14) provides their continuum description at crit-icality [40, 41], with anisotropy being responsible for the presence of a non-vanishing nonlinear term. It contrasts to the usual kinetic origin of nonlinearities in the growth equa-tions (λ∼v) [19], which would giveλ= 0at the transition. That belief is supported by calculations of the growth ve-locities of tilted interfaces, which indicate a non-vanishing (possibly infinite) nonlinear term [41]. The same analysis indicates that some models, such as the RFIM in2 + 1 di-mensions (self-affine regime), correspond to the QEW class. Despite the intense study of this subject in the last ten years, there are some open questions that motivate further analysis of the QKPZ equation, its connection to directed percolation depinning and related topics. See, for instance, the recent works of Neshkov [48], Ramasco et al [49] and Le Doussal and Wiese [50].
IV
Competitive models with
deposi-tion and evaporadeposi-tion
Depinning transitions are also observed in systems with de-position and evaporation of atoms. In some cases, evapo-ration is restricted to the edges of islands, and the transi-tions can be mapped onto DP and other absorbing state tran-sitions. Physically, these processes account for the lower binding energies of adatoms which are isolated above an is-land or aggregated at its border, when compared to the en-ergy inside an island. Extended models may also include evaporation inside the islands, leading to more complicated critical behavior.
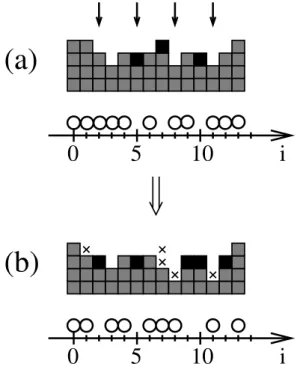
Fig. 7a shows the growth rules of the first model pro-posed with those features [9], in1 + 1dimensions. Atoms are deposited with probabilityq. Evaporation occurs with probability 1−q for isolated atoms (no lateral neighbor) and with probability(1−q)/2for atoms with one lateral neighbor, i. e. atoms at the edge of an island. These pro-cesses must also obey the condition of the RSOS model [11] that|hx−hx±1| ≤1, otherwise the deposition or
evapora-tion attempt is rejected. No evaporaevapora-tion occurs below the bottom layer.
the bottom layer is completely filled, because no evaporation can occur at that layer anymore. Subsequently, higher layers will also become completely filled. The critical evaporation probability obtained in simulations isqc ≈0.189[9].
✁✂✂✁✂✂✂✁✂✂✁✂✂✂✁✂✂✂✁✂✂✁✂✂✂
✄✁✄✂✄✂✄✁✄✂✄✂✄✂✄✁✄✂✄✂✄✁✄✂✄✂✄✂✄✁✄✂✄✂✄✂✄✁✄✂✄✂✄✁✄✂✄✂✄✂✄
x
0 5 10 15bottom layer
contact process
}
q q q q 1−q (1−q)/2 (1−q)/2 0
(a)
(b)
Figure 7. (a) Conditions for deposition and evaporation of particles in the model with evaporation restricted to the edges of the islands, with the respective probabilities. (b) Above thexaxis, some depo-sition and evaporation attempts in the interface problem are shown. Below the axis, the configurations of the associated particle-hole problem before and after the deposition and evaporation processes are shown.
This transition can be mapped onto a CP by associat-ing a particle-hole problem to the dynamics at the bottom layer. In this problem, a particle corresponds to an empty column of the deposit (h = 0), while a hole corresponds to a filled column (h > 0). Some deposition and evapo-ration attempts and the corresponding configuevapo-rations of the particle-hole system (before and after those processes) are shown in Fig. 7b. The annihilation process (particle →
hole) of the CP corresponds to the deposition of an atom at an empty column. Offspring production (hole → parti-cle) corresponds to the evaporation of an atom at the bottom layer. This is possible only if that atom has an empty neigh-bor in the interface problem (Fig. 7a), which corresponds to a neighboring particle in the particle-hole system. The rates of annihilation and offspring production cannot be obtained analytically fromqbecause the deposition and evaporation processes must obey the RSOS condition and, consequently, those rates depend on the heights distribution. However, for an unrestricted model, the exact mapping on a CP is possi-ble, with the annihilation rate given byλ=q/(1−q)[51]. This analysis shows that this depinning transition is also in the DP class, with the smooth phase (rough phase) corre-sponding to the active phase (absorbing phase) of DP. How-ever, there is an important difference from the problems of interfaces growing in disordered media: in the pinned phase, the deposit dynamically evolves through different configura-tions, i.e. it is not blocked.
The scaling of the interface velocity is obtained as fol-lows. Forqslightly aboveqc, a large time∆tis necessary to fill the bottom layer. This is the characteristic time of survival of isolated empty sites at the bottom layer, which correspond to particles in the CP. Thus,∆t∼ξk. Since this
is the typical time for filling one layer (∆h≈1), we obtain
v∼∆h
∆t ∼ξk
−1∼(q−q
c)νk. (16) The bottom layer occupation n0 in the smooth phase
cor-responds to the fraction of particles in the corresponding particle-hole problem, then its critical behavior obeys
n0∼(qc−q)βT, (17) with the DP exponent βT. On the other hand, finite-size scaling relations of various quantities involve the lateral cor-relation exponentν⊥ of DP [51]. These relations and the scaling forms in Eqs. (16) and (17) are confirmed by numer-ical simulations of the model [9, 51].
The interface width at the smooth phase saturates, while at the rough phase it scales with KPZ exponents [51]. At criticality, it was recently shown [52] that, in lattices of lengthL,W obeys the finite-size scaling relation
W2(L, t) =alnL+f(t/Lzc), (18) where ais a constant and f is a scaling function. In Eq. (18), the critical dynamical exponent is given by zc =
νk/ν⊥ [51], and logarithmic scaling meansβG = αG = 0 at criticality.
Another interesting feature of this depinning transition is the scaling of the occupations nk of the first few lay-ers (k = 1,2, . . .), which is connected to unidirectionally coupled DP processes. Numerical simulations and field-theoretical renormalization techniques were applied to this problem [51, 53]. One important conclusion is that the scal-ing exponents νk(k)andν
⊥(k) of the dynamical processes at higher layers are the same of DP [51], although the crit-ical behavior ofnk (analogous to Eq. 17) is governed by
k-dependent exponents.
Concerning possible experimental realizations of this transition, the main limitation is the exclusion of adatom diffusion in the model, which typically occurs with much higher rates than desorption.
6.7), [54] and [57], the latter presenting an extended wetting model.
Another interesting model is that of dimer deposition and desorption in which desorption is allowed only at the edges of the plateaus, similarly to the model in Fig. 7 [58]. Fig. 8a illustrates the growth rules of the dimer model, with probabilityqfor deposition and1−qfor desorption, respect-ing the RSOS condition. Moreover, both atoms of the pair must be at the same layer to aggregate or to evaporate. Con-sequently, the number of particles at each layer is conserved modulo 2.
A depinning transition is observed atqc ≈ 0.317. The dynamics at the bottom layer corresponds to a particle-hole problem with parity conservation, illustrated in Fig. 8b. Dimer deposition corresponds to pair annihilation and dimer desorption (possible only with an empty neighbor at the bot-tom level) corresponds to creation of a pair from one parti-cle. A mapping onto a BAWE (Eq. 12) is possible, so that the transition belongs to the PC class (Sec. II.A). Numerical results confirm this hypothesis [58].
At criticality, the interface width and the average height increase as W2 ∼ hhi ∼ logt. One curious feature of
this model is that, in the depinned phase, the average height and the interface width also increase logarithmically, as
hhi ∼ W ∼ logt, i. e. the interface does not move with a constant velocity. This is related to the fact that random deposition of dimers does fill a line completely, but leaves isolated holes between islands, in which new dimers cannot be deposited. In Fig. 8b, this is the case atx= 6after de-position and atx = 15before desorption. In the interface model, it leads to the formation of mounds, with the one-site valleys between them acting as pinning centers. In order to deposit a new dimer, it is necessary that two pinning centers diffuse until they meet. However, this diffusion is very slow because it depends on the evaporation of entire mounds in a phase where deposition is dominant.
✁✂✁✂✁✂✁✂✁✂✁✂✁✂✁✂✁✂✁✂✁✂✁✂✁
✄✁✄✂✄✁✄✂✄✁✄✂✄✁✄✂✄✁✄✂✄✁✄✂✄✁✄✂✄✁✄✂✄✁✄✂✄✁✄✂✄✁✄✂✄✁✄✂✄✁✄
(a)
(b)
q q q
q 1−q 1−q 1−q 0
x 0 5 10 15
}
bottom layer
particle−hole problem
Figure 8. (a) Conditions for dimer deposition and evaporation in the model with evaporation restricted to the edges of the islands, with the respective probabilities. (b) Above thexaxis, some de-position and evaporation attempts in the dimer dede-position problem are shown. Below the axis, the configurations of the associated particle-hole problem before and after the deposition and evapora-tion processes are shown.
For a more detailed review on the problems discussed in this Section and related models, the interested reader may consult Ref. [4] and references therein.
V
Growth with poisoning species
In 1983, Wang and Cerdeira [59] introduced a class of depo-sition models with two kinds of incident particles,AandB, and with production of an inactive speciesCafter reactions between an incidentB and an aggregatedA. Some years later, works on2 + 1-dimensional versions of this model and its extensions suggested the existence of a morpholog-ical transition for high fluxes of particlesB [60, 61] (the nature of this transition was not analyzed there). Motivated by these works and by some experiments mentioned below, related (and apparently different) models were recently con-sidered. They involve the competitive deposition of a main species and a poisoning one, showing depinning transitions as the relative fluxes are varied [62, 63]. The most interest-ing cases are those with transitions in the DP class, which will be the central point of discussion in this section.
In the following models, we will denote the active species byA and the poisoning species byB. AnA par-ticle is released with probability1−pand aB particle is released with probabilitypabove the deposit. The role of speciesB is to block the surface for future aggregation of any incident particle at its neighborhood.
The most simple transition occurs in a RSOS ver-sion [62] of the originalAC model [59]. Its rules are illus-trated in Fig. 9. Any incident particle can aggregate at the top of the column of incidence only if: 1) it has a neighbor-ingAat that position; 2) the aggregation respects the con-dition that heights differences of neighboring columns do not exceed1[11]. In the RSOS model (p= 0) the interface grows with finite velocity. A first order dynamic transition is observed atp= 0because any small flux ofBleads to the formation of pinning centers that will eventually block the growth process. A region of a blocked deposit forp= 0.1 is shown in Fig. 10a, while Fig. 10b shows the structure of the most probable pinning centers. No deposition occurs at valleys with those triplets of particlesBdue to condition 1 above, while no deposition occurs at the sloped regions of the surface due to condition 2. In the blocked phase, scal-ing arguments show that the interface width and the average height saturate asWs ∼ Hs ∼ p−3/2, which agrees with numerical results [62].
column, thus the growth velocity (or growth rate) is equal to the fractionρof active columns.
Figure 9. Examples of applications of the growth rules of the model with active (gray squares) and poisoning (black squares) particles, and the RSOS condition for aggregation.
Figure 10. (a) A region of a blocked deposit in the model with poi-soning species and RSOS condition for aggregation, forp= 0.1. (b) Structure of a triplet that blocks the growth at the valleys of the deposit.
As the flux of speciesB increases, the growth velocity decreases, and a pinning transition is observed atpc≈0.207 in1+1dimensions andpc ≈0.490in2+1dimensions [63]. The relation to DP is explained by the mapping of the inter-face problem ind+ 1dimensions onto ad-dimensional CP. In the particle-hole problem, a particle is associated to a top Aand a hole is associated to a topB, as shown in Fig. 11b. Note that this correspondence is the inverse of that consid-ered in the problems of deposition and desorption in Sec. IV. Here, the deposition of aB in a column with a topA cor-responds to the annihilation of a particle in theCP. On the other hand, the deposition of anAin a column with a topB corresponds to offspring production in theCP, since it re-quires a topAat a neighboring column. The stability of the absorbing state is illustrated by process 4 in Fig. 11b. The probabilities of annihilation and offspring production in the CP are not trivially related topbecause they also depend on the heights’ distribution.
(1) (2) (3) (4) (5)
INITIAL:
INCIDENT A: INCIDENT B:
(a)
(b)
Figure 11. Ballistic-like deposition with a poisoning species. (a) Examples of deposition attempts ind = 1. Open squares repre-sent particlesA, filled squares represent particlesB and crossed squares represent incident particles (AorB). In processes (1), (2) and (3), aggregation occurs at the positions marked with a crossed circle. In processes (4) and (5) the aggregation attempt is rejected. In processes (3) and (4), lateral aggregation to the right is not pos-sible because the neighboringAis not at the top of its column. (b) The equivalent one-dimensional contact process, in which a topA corresponds to a particle (filled circles) and a topBcorresponds to a hole (empty sites). The initial configuration and the possible final configurations, for the cases of incidentAand incidentB, are shown.
The growth phase (p < pc) of this model corresponds to the active phase of the CP or DP. This correspondence is the opposite in all depinning transitions previously discussed: in growth in disordered media, depinning is observed if the im-purities do not form a directed percolating cluster, and in the deposition-desorption models depinning occurs with a filled bottom layer, corresponding to absorbing phases of certain dynamic processes at that layer.
In an infinite lattice, a steady state with a fluctuating fi-nite fraction of active columns is attained. Thus, the growth velocity is the order parameter of this transition and scales as
v∼ǫβT
, ǫ≡pc−p. (19) Here, the velocity exponentθ, in the language of driven in-terfaces, is equal to the order parameter exponentβT of DP. At the transition point, the growth velocity is expected to decrease asvc ∼t−βT/νk. These scaling relations are sup-ported by numerical results [63].
Figure 12. Critical deposit in1 + 1dimensions for the ballistic-like model with a poisoning species. Open squares represent active particles and filled squares represent poisoning particles.
Figure 13. Interface width scaling in the ballistic-like model with a poisoning species below the critical point. Shown islnWversus
lnx, with the scaling variablex≡tǫνk, forp= 0.15(solid line),
p= 0.17(dotted line) andp= 0.18(dashed line), in a lattice with lengthL = 4096. The regions of critical DP and KPZ behaviors are indicated.
Similar crossover was observed in the study of dynam-ical phase transitions in the Domany-Kinzel cellular au-tomata by de Sales et al [64]. Those authors calculated the transition points with accuracy by mapping cellular au-tomata patterns onto an interface problem, which showed a crossover from random deposition behavior (βG = 1/2) to critical DP behavior (βG= 1).
In the pinned (or blocked) phase, the deposit grows un-til attaining a limiting average heightHs, where the whole surface is poisoned by speciesB. Since surface poisoning corresponds to the absorbing phase in the CP,Hsis of the order of the longitudinal correlation lengthξkof DP, which also agrees with numerical results [63]. The interface width of the blocked deposits also scales asξk.
Another interesting feature of this model (not discussed in Ref. [63]) is that the critical roughness exponentαG is larger than one, i. e. it exhibits super-roughening [65]. Consider growth in finite lattices at the critical probability
pc, so that a finite fraction of the deposits will attain the steady state regime. At certain probability p < pc, the transversal DP correlation length equals the lattice length, i. e. ξ⊥ ∼ ǫ−ν⊥ ∼ L, and saturates at this value in the whole critical region, as expected from finite-size scaling theory [66, 67]. On the other hand, height fluctuations satu-rate at a value of the order of the longitudinal DP correlation length, thenW ∼ǫ−νk. Thus, the saturation widths (Eq. 4) at the critical point scale with a roughness exponent
α(Gc)=νk/ν⊥. (20)
This relation was confirmed numerically in1 + 1 dimen-sions. In Fig. 14a we showWsat(L)versusLat criticality (128 ≤ L≤4096), and in Fig. 14b we show the effective exponentsα(Gc)(L)(local declivities of the previous log-log plot), which suggests an asymptotic exponentα(Gc) ∼ 1.6. On the other hand, the best known estimates of DP expo-nents giveνk/ν⊥≈1.581[27].
Figure 14. Interface width scaling in the ballistic-like model with a poisoning species at the critical point: (a) saturation width ver-sus lattice lengthLat the critical point in1 + 1dimensions, for
128≤L ≤4096; (b) effective roughness exponents (successive declivities of the data in (a)) versus1/L1/2
. This abscissa was chosen to clarify the evolution of the data withL.
Although the applicability of this ballistic-like model to real deposition processes is very limited, the robustness of the DP class suggests that systems with deposition of poi-soning species but different aggregation mechanisms may also present transitions in that class. In various processes, the presence of different chemical species improves films’ properties but leads to undesired features, such as the de-crease of growth rates. In many cases, a poisoning species is responsible for the saturation of dangling bonds at the surface, such as deposition of Si films doped with P by
CV D orM BE, in atmospheres with phosphine [68, 69]. Poisoning effects also appear in diamond CV D in atmo-spheres with boron and nitrogen [70], where high fluxes of boron cancel out diamond growth, leading to a transition to a blocked or pinned phase.
reactions at the surface [71]. The lattice model without im-purities (p= 0) was proposed in Ref. [20]. At each etching attempt, a random column iis chosen and the top particle is removed. Then, any neighboring column whose height is larger than the previous height of columni(h0(i)) is etched
until its own height becomesh0(i). These processes will be
called normal and lateral erosion, respectively. Lateral ero-sion accounts for the removal of highly exposed parts of the solid after a normal erosion process. The rules of the ex-tended model with a poisoning species are illustrated in Fig. 15. The solid contains a single chemical speciesA, similarly to the original model, and any column with a topAis said to be exposed. An erosion process (normal or lateral) at a certain column may leave an inactive particle B at the top of this column with probabilityp. Any attempt of normal erosion at a column with a topA(B) is accepted (rejected), then speciesB blocks the interface for this process. How-ever, a column with a topBwill be subject to lateral erosion if: 1) a neighboring column was subject to normal erosion; 2) there is an exposed particleAbelow the topB. This is the case of columni= 7in Fig. 15.
i
0
5
10
(a)
i
0
5
10
(b)
Figure 15. Etching model with a poisoning species: (a) examples of etching attempts ind= 1, with selected columns indicated by arrows,Aparticles in gray andBparticles in black. The corre-sponding configuration of the associated one-dimensional particle-hole problem is shown below the solid, with particles (circles) cor-responding to topA and holes corresponding to topB. (b) The solid after the etching attempts in (a), with positions of removed atoms indicated by crosses. Normal erosion at column2and lat-eral erosion at columns9and12leftBparticles at those columns. In column 7, aBparticle was removed by lateral erosion. The con-figuration of the associated particle-hole problem is also shown.
It is also possible map this model onto a CP. A column of the solid with a top A is associated to a particle in a
d-dimensional lattice, while a column with a top B is as-sociated to a hole. This relation is also illustrated in Fig.
15. Normal and lateral erosion in the etching model give rise to particle annihilation and offspring production in this particle-hole system. Since lateral etching may occur at two (d = 1) or more (d > 1) columns, two or more offspring may be produced. Moreover, this CP also includes particle diffusion [71]. However, these features are not sufficient to change the class of the transition, which is confirmed to be DP by numerical simulations [71].
One of the motivations for this etching model is the fact that, in some experiments, deposition of poisoning species is observed. One example isSietching byN aOH, where some clusters ofHSi(OH)3 remain on the surface, block-ing the corrosion process [72]. However, the applicability of the above model depends on being possible to vary the rate of formation of the poisoning species.
Finally, it is important to mention that related models were also proposed to represent the formation of passive layers at the interface between lithium metal and a sol-vent [73, 74]. The simplest version of this model is an ex-tension of the Eden model starting from a line of seeds (see Ref. [2], ch. 8). The growth proceeds by incorporation of new particles at any site neighbor to the cluster. These par-ticles may be active or poisoning ones, with probabilitiesp
and1−p. Numerical studies indicate an isotropic perco-lation transition in this system. This is expected because, contrary to the above models, there is no anisotropy.
VI
Concluding remarks
This review discussed various classes of lattice growth mod-els which exhibit depinning transitions, i. e. transitions from a growth phase to a blocked or pinned phase. Most of those transitions are in the directed percolation class, although some important examples fall into other classes. Moreover, depending on the mechanisms of interface growth, differ-ent relations are obtained between growth expondiffer-ents and the exponents of a certain class of dynamical transition. Conse-quently, those models suggest a large variety of plausible physical situations in which those transitions may be ob-served, which is certainly a motivation for further theoretical and experimental studies.
Acknowledgements
The author thanks Sergio Botelho, Dante Franceschini, Anna Chame, Robin Stinchcombe and Sergio Queiroz for helpful discussions, suggestions and collaboration in scien-tific work during the last years.
This work was partially supported by CNPq and FAPERJ (Brazilian agencies).
References
[3] J. Krug, Adv. Phys.46, 139 (1997). [4] H. Hinrichsen, Adv. Phys.49, 815 (2000). [5] H. Hinrichsen, Braz. J. Phys.30, 69 (2000).
[6] H. Ji and M. O. Robbins, Phys. Rev. A44, 2538 (1991). [7] S. V. Buldyrev, A.-L. Barab´asi, F. Caserta, S. Havlin, H. E.
Stanley and T. Vicsek, Phys. Rev. A45, R8313 (1992). [8] L.-H. Tang and H. Leschhorn, Phys. Rev. A 45, R8309
(1992).
[9] U. Alon, M. R. Evans, H. Hinrichsen, and D. Mukamel, Phys. Rev. Lett.76, 2746 (1996).
[10] F. Family, J. Phys. A19L441 (1986).
[11] J. M. Kim and J. M. Kosterlitz, Phys. Rev. Lett. 62, 2289 (1989).
[12] M. J. Vold, J. Coll. Sci.14(1959) 168; J. Phys. Chem.63, 1608 (1959).
[13] F. Family and T. Vicsek, J. Phys. A18, L75 (1985). [14] M. C. Bartelt and J. W. Evans, Phys. Rev. B46, 12675 (1992). [15] S. Clarke and D. D. Vvedensky, J. Appl. Phys. 63, 2272
(1988).
[16] C. Ratch, A. Zangwill, P. Smilauer, and D. D. Vvedensky, Phys. Rev. Lett.72, 3194 (1994).
[17] S. F. Edwards and D. R. Wilkinson, Proc. R. Soc. London
381, 17 (1982).
[18] D. Wolf and J. Villain, Europhys. Lett.13, 389 (1990). [19] M. Kardar, G. Parisi and Y.-C. Zhang, Phys. Rev. Lett.56,
889 (1986).
[20] B. A. Mello, A. S. Chaves and F. A. Oliveira, Phys. Rev. E
63, 41113 (2001).
[21] J. Marro and R. Dickman,Nonequilibrium Phase Transitions in Lattice Models(Cambridge University Press, Cambridge, 1999).
[22] S. R. Broadbent and J. M. Hammersley, Proc. Camb. Phyl. Soc.53, 629 (1957).
[23] J. W. Essam, Rep. Prog. Phys.43, 833 (1980).
[24] D. Stauffer and A. Aharony,Introduction to Percolation The-ory, 2nd. ed. (Taylor & Francis, London/Philadelphia, 1992).
[25] T. E. Harris, Ann. Prob.2, 969 (1974).
[26] R. Dickman and J. K. da Silva, Phys. Rev. E58, 4266 (1998). [27] I. Jensen, J. Phys. A32, 5233 (1999).
[28] C. A. Voigt and R. M. Ziff, Phys. Rev. E56, R6241 (1997). [29] E. V. Albano, J. Phys. A: Math. Gen.27, L881 (1994). [30] R. M. Ziff, E. Gulari, and Y. Barshad, Phys. Rev. Lett.56,
2553 (1986).
[31] H. K. Janssen Z. Phys. B42, 151 (1981) [32] P. Grassberger, Z. Phys. B47, 365 (1982).
[33] D. Zhong and D. ben Avraham, Phys. Lett. A 209, 333 (1995).
[34] I. Jensen, Phys. Rev. E50, 3623 (1994).
[35] C. S. Nolle, B. Koiller, N. Martys, and M. O. Robbins, Phys-ica A205, 342 (1994).
[36] C. S. Nolle, B. Koiller, N. Martys, and M. O. Robbins, Phys. Rev. Lett.71, 2074 (1993).
[37] R. Bruinsma and G. Aeppli, Phys. Rev. Lett.52, 1543 (1984). [38] J. Koplik and H. Levine, Phys. Rev. B32, 280 (1985). [39] D. A. Kessler, H. Levine and Y. Tu, Phys. Rev. A43, 4551
(1991).
[40] L.-H. Tang, M. Kardar, and D. Dhar, Phys. Rev. Lett.74, 920 (1995).
[41] L. A. N. Amaral, A.-L. Barab´asi, and H. E. Stanley, Phys. Rev. Lett.73, 62 (1994).
[42] M. A. Rubio, C. A. Edwards, A. Dougherty, and J. P. Gollub, Phys. Rev. Lett.63, 1685 (1989).
[43] V. K. Horv´ath, F. Family, and T. Vicsek, J. Phys. A: Math. Gen.24, L25 (1991).
[44] S. He, G. L. M. K. S. Kahanda, and P.-Z. Wong, Phys. Rev. Lett.69, 3731 (1992).
[45] R. Albert, A.-L. Barab´asi, N. Carle and A. Dougherty, Phys. Rev. Lett.81, 2926 (1998).
[46] F. Family, K. C. B. Chan, and J. Amar, inSurface Disorder-ing: Growth, Roughening and Phase Transitions, edited by R. Jullien, J. Kert´esz, P. Meakin and D. E. Wolf (Nova Sci-ence, New York, 1992).
[47] S. V. Buldyrev, A.-L. Barab´asi, S. Havlin, J. Kert´esz, H. E. Stanley and H. S. Xenias, Physica A191, 220 (1992). [48] N. Neshkov, Phys. Rev. E61, 6023 (2000).
[49] J. J. Ramasco, J. M. L´opez and M. A. Rodr´ıguez, Phys. Rev. E64, 66109 (2001).
[50] P. Le Doussal and K. J. Wiese, Phys. Rev. E67, 16121 (2003). [51] U. Alon, M. R. Evans, H. Hinrichsen, and D. Mukamel, Phys.
Rev. E57, 4997 (1998).
[52] H. Hinrichsen, Phys. Rev. E67, 16110 (2003).
[53] U. C. T¨auber, M. J. Howard, and H. Hinrichsen, Phys. Rev. Lett.80, 2165 (1998).
[54] H. Hinrichsen, R. Livi, D. Mukamel, and A. Politi, Phys. Rev. Lett.79, 2710 (1997).
[55] Y. Tu, G. Grinstein, and M. A. Mu ˜noz, Phys. Rev. Lett.78, 274 (1997).
[56] M. A. Mu˜noz and T. Hwa, Europhys. Lett.41, 147 (1998). [57] H. Hinrichsen, R. Livi, D. Mukamel, and A. Politi, Phys. Rev.
E61, R1032 (2000).
[58] H. Hinrichsen and G. ´Odor, Phys. Rev. Lett.82, 1205 (1999). [59] W. Wang and H. A. Cerdeira, Phys. Rev. E47, 3357 (1993). [60] H. F. El-Nashar and H. A. Cerdeira, Phys. Rev. E601262
(1999).
[61] H. F. El-Nashar and H. A. Cerdeira, Phys. Rev. E616149 (2000).
[62] S. S. Botelho and F. D. A. Aar˜ao Reis, Phys. Rev. E65, 32101 (2002).
[63] F. D. A. Aar˜ao Reis, Phys. Rev. E66, 27101 (2002). [64] J. A. de Sales, M. L. Martins and J. G. Moreira, J. Phys. A:
Math. Gen.32, 885 (1999).
[66] M.N. Barber, inPhase Transitions and Critical Phenomena Vol. 8, edited by C. Domb and J.L. Lebowitz (Academic, New York, 1983).
[67] M. E. Fisher, inCritical Phenomena, Proceedings of the In-ternational School of Physics “Enrico Fermi”, Course LI, Varenna, 1970, edited by M. S. Green (Academic, New York, 1971).
[68] C. Li, J. E. Quinones, and S. Banerjee, J. Vac. Sci. Technol. A14, 170 (1996).
[69] F. Gao, D. D. Huang, J. P. Li, Y. X. Lin, M. Y. Kong, D. Z. Sun, J. M. Li, and L. Y. Lin, J. Crystal Growth220, 461 (2000).
[70] J. H. Edgar, Z. Y. Xie and D. N. Braski, Diamond Relat. Mater.7, 35 (1998).
[71] F. D. A. Aar˜ao Reis, to appear in Phys. Rev. E (2003).
[72] M. E. R. Dotto and M. U. Kleinke, Phys. Rev. B65, 245323 (2002).
[73] I. Nainville, A. Lemarchand, and J.-P. Badiali, Phys. Rev. E
53, 2537 (1996).
[74] M. Lafage, V. Russier, and J. P. Badiali, J. Electroanal. Chem.
![Figure 1. Interface width W versus time t for the RSOS model (Ref. [11]) in 1 + 1 dimensions, in two different lattice lengths L.](https://thumb-eu.123doks.com/thumbv2/123dok_br/18979852.456629/2.892.150.416.828.1074/figure-interface-width-versus-dimensions-different-lattice-lengths.webp)