Polarographic and Spectrophotometric Study of Lead Complexes
with Diethanoldithiocarbamate
A.L.B. Marquesa, and G.O. Chiericeb
a
Departamento de Tecnologia Química, UFMA, Campus Universitário, Bacanga,
65.080-040 São Luis - MA, Brazil
b
Instituto de Física e Química de São Carlos, USP C.P. 369, S. Carlos - SP, Brazil
Received: June 4, 1997
Foram estudados aspectos experimentais e teóricos sobre o comportamento do complexo de chumbo com dietanolditiocarbamato (DEDC), em solução. A reação ocorre através da formação de um precipitado amarelo, o qual é solúvel em excesso de ligante e alguns solventes polares. Os resultados das análises, elementar e gravimétrica, mostram uma relação estequiométrica de 1:2 (Pb:DEDC), comprovada nos estudos potenciométricos. A aplicação da equação de Lingane, nas formas estendida e simplificada, foi avaliada na determinação da constante de estabilidade global e do número máximo de coordenação, por Polarografia convencional. Os resultados indicam que são coordenados três ligantes, com uma constante de estabilidade, βMLn , aproximadamente igual a 4 x 10¹⁶. Estes resultados mostram boa concordância com outros prévios resultados, obtidos por potenciometria, para o mesmo sistema. Estudos cinéticos-espectrofotométricos foram conduzidos para avaliar a estabilidade do ligante puro e complexado em meio ácido.
Experimental and theoretical aspects concerning the behaviour of lead-dietanoldithiocarbamate complexes in aqueous solutions were studied. The reaction occurs through complexation and formation of a yellow precipitate, which is soluble in ligand excess and in some polar solvents. The results from elementary and gravimetric analyses show a stoichiometric relationship of 1:2 (Pb(II): DEDC). Some ambiguous interpretations have been clarified on the application in this system of Lingane’s equation. Polarographic measurements were used to determine the coordination number (≅ 3.0) and overall formation constant βMLn (≅ 4 x 10¹⁶), of the lead complexes with ammonium diethanoldithiocarbamate, which show a good agreement with previous potentiometric results for the same system. A kinetic-spectrophotometric study was carried out in order to establish the decomposition of these complexes in acid medium.
Keywords:lead, dithiocarbamate complexes, spectrophotometry, polarography, poten-tiometry
Introduction
Dithiocarbamate (dtc) is a class of compounds used extensively for extraction and spectrophotometric analysis of heavy metals1. Its high sensitivity and ability to form
stable complexes over a wide pH range has resulted in numerous applications2-3. The properties of this ligand have been studied since the beginning of this century4.
However, there is almost no information in the literature about the behaviour of the dithiocarbamates in aqueous or
acid media. This compound possesses two sulfur atoms that allow it to form strong complexes5.
The stability constant of a complex is an important basic datum in analytical chemistry, particularly, for predicting interfering elements and for choosing optimum experimental conditions6-8, such as pH and concentration. Apart from diethildithiocarbamate (DEDTC), diethanoldithiocarbamate (ADEDC) is one of the most commonly used forms of the ligand but very little is known about its complexes mainly in aqueous acid media. As a part of the continuing studies on the
Article
dithiocarbamate applications9-15 we report here the polaro-graphic and spectrophotometric study of the reaction between lead (II) and ADEDC. Among the studies developed in our laboratory we describe results concerning as the adsorptive voltammetric behaviour14 of five dithiocarbamates (dtcs) at
a static mercury drop electrode. In this work linear and cyclic wave forms were applied to perform measurements in open and close circuits. Results revealed that the radicals bonded to the nitrogen atom have a significant influence on the adsorptive properties of these ligands which decrease in the following series: phenyldtc > benzyldtc > ethylene-bisdtc > diethanoldtc > diethyldtc. In an other study11 a voltammetric method, based on the adsorptive properties of the nickel-phenyldithiocarbamate complex, was pro-posed to determine traces of this metal in sea water. This study showed that only cobalt and zinc interfere, but not under the present conditions. After optimization of the instrumental and experimental parameters, the possibility of determining nickel (II) in sea water was evaluated. Optimal experimental conditions were found to be: Cphenyldtc = 3 x 10⁻³ M; Epre = -0.85V; pH = 9.2; tpre = 3-5
min. The limit of detection is 0.026µg/L after 15 min. and the results of precision and recovery were 4.39% and 101% ± 10%, respectively. Other studies have been carried out on spectrophotometric potentialities9, and the crystal and
mo-lecular structure10 of copper and zinc complexes with
diethanoldithiocarbamate, have been determined. In our recent study13 the lead(II)-ADEDC system was evaluated
by potentiometric experiments using a lead electrode for the determination of solubility and stepwise constants. In the present work these same complexes have been exam-ined in more detail and very good agreement has been found between the values determined in this work with the13 previous results. The overall stability constant of the
lead (II) complex of diethanoldithiocarbamate in aqueous medium was determined by polarographic measurements using NaNO3 or NaClO4, as supporting electrolyte.
Experimental
Equipment and reagents
D.C. polarographic measurements were obtained with a PAR apparatus (model 174A), equipped with a conven-tional three electrode jacketed glass cell and an X-Y re-corder (PAR model 0089). The pH was measured with a pH glass electrode (Metrohm, model AG9100) and a pH meter (Corning model 130). The spectra were recorded in the visible region (Diode-Array HP, model 8451 UV-Vis spectrophotometer) from 190 nm to 800 nm using 1cm quartz cuvette. All analytical measurements were carried out at constant temperature (25 ± 0,1 °C). The ionic strength in all solutions was supported with 0.1M NaClO4 or
NaNO3. The experiments were performed with analytical
reagent grade chemicals, pure solvents and deionized
water. The synthesis of the ADEDC was described else-where16.
Pb(NO3)2 solutions were standardized
gravimetri-cally17 (0.1 M and 0.5 M) and complexometrically18 (0.01
M) while ADEDC 0.1 M was standardized potentiometri-cally using lead (II) as titrant solution and lead as working electrode13.
Polarographic procedure
A solution containing ADEDC, supporting electrolyte, poliacrylamid, Triton-X-100 (maximum suppresser mix-ture) and water was deaerated with N2 for 20 min. Then, a
pre-deaerated aliquot of lead (II) solution was added. The polarograms were recorded in the following order: pure supporting electrolyte, after lead (II) addition, and after addition of each aliquot of ADEDC.
Spectrophotometric procedure
Spectrophotometric experiments were carried out con-sidering the inverse order used in the polarographic experi-ments, i.e., addition of the aliquot of lead after the ADEDC ligand.In order to avoid different times of decomposition, the procedure used to prepare all complex solutions was carried out in such a way that the absorbances were meas-ured two minutes after the addition of the dithiocarbamate.
Results and Discussion
Spectrophotometric behaviour and preliminary experiments
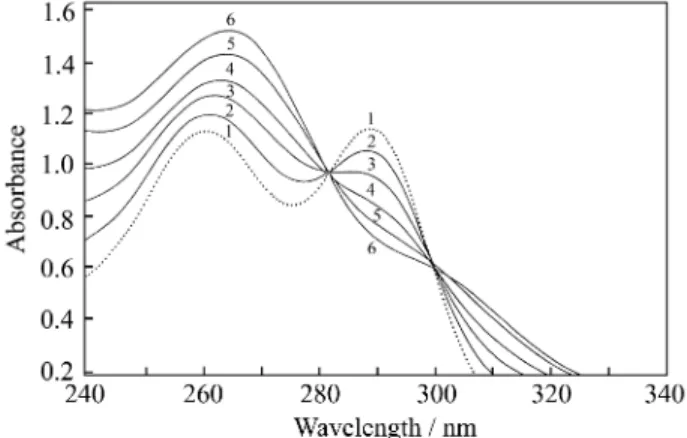
When the ligand was added to the metal solution, it was not possible to observe the reactivity of the Pb-ADEDC system. Both, ligand and complex, absorb in the same spectral region, which shows only an increase of the ligand peak, despite the formation of the complex. In contrast, by adding metal to the ligand solution it was possible to see a clear change in the spectrum. If the ADEDC concentration is maintained constant and lead concentration is increased, from 1 x 10⁻⁵ to 5 x 10⁻⁵ M, two isosbestic points can be
seen between 200 and 400 nm. Outside this spectral range there is no change. The absorption spectra of the diethanoldithiocarbamate exhibit two peaks with maxi-mum at 260 nm and 290 nm19-20, as shown in Fig. 1. The
addition of lead ions only affects the first of these two peaks which corresponds to the sulfur absorption2,5. This could
mean that the lead ion can support at least three dithiocar-bamate ligands in order to justify its coordination number. In the present work the complexation reaction was investi-gated by polarography and spectrophotometry.
a regular behaviour and that two isosbestic points could not be seen between 200 and 400 nm. It can be seen that the absorbance increases at 260 nm while it decreases at 290 nm. The most important parameters affecting the spectro-photometric behaviour are the reaction time and the order of reagent addition. However, this behaviour can be ade-quately adjusted to optimize the method. The order of reagent addition should be considered and the time between the dithiocarbamate addition (after lead) and the absor-bance measurements should be the same for all solutions with different lead concentrations. Resolution is thus im-proved in such a way that two isosbestic points are ob-tained, as shown in Fig. 2. The extent to which the spectra change (Fig. 2), strongly depends on the narrowing ratio between lead and the diethanoldithiocarbamate ligand. For clear observation of the spectrophotometric reaction shown in Fig. 2, a fivefold excess of ligand to metal concentration was used. The complexation reaction has been ideally
observed by spectrophotometry by measuring the absor-bance of a 1 x 10⁻⁴ M ADEDC solution. Thus, lead is added in the ideal concentration range between 1 x10⁻⁵ M and 5 x10⁻⁵ M.
The formation of a yellow precipitate was observed when lead and ADEDC were mixed in a 1:2 (Pb:ADEDC) ratio. The precipitate is soluble in ligand excess and in some polar solvents such as ethanol and acetone. The solubiliza-tion of the precipitate indicates the formasolubiliza-tion of a new species, that means, an other complex. The determination of lead by gravimetric and elementary analyses of the compound showed a good agreement with the previous proposed stoichiometry13, as shown in Table 1.
Polarographic behaviour
The polarographic behaviour of dithiocarbamates is very well known and the anodic waves of mercury com-plexes have been the object of many studies21-25. These
anodic waves have limited the analytical application of many metal-dithiocarbamate complexes due to the narrow potential range. Lead (II) is one of the ions that can be studied by polarography in the presence of dithiocar-bamate. A 1 x 10⁻³ M lead (II) solution in 0.1 M NaNO
3,
shows a DC polarographic wave at 400 mV (vs. SCE). The complexation reaction has been investigated by measuring the potential shift (∆E1/2) after adding the dithiocarbamate
ligand to the lead (II) solution. To be able to characterize the equilibrium and to compare the present results with the ones obtained previously13, the polarographic
measure-ments were carried out under identical experimental con-ditions as in the potentiometric method.
To avoid any precipitation, the polarographic behaviour of Pb-ADEDC system could only be studied in a solution containing a tenfold excess of ligand. Using this condition it was not possible to determine the successive stepwise constants by polarography. The lead concentration was maintained constant at 10-3 M. This value was chosen considering the polarographic sensitivity of the solution. A ligand concentration range of 10-2 to 10-1 M was used due to the low solubility of the complex, especially in the 1:2 (Pb:ADEDC) ratio.
Figure 3 shows the D.C. polarograms for the pure supporting electrolyte (a), after adding 10-3 M Pb(NO3)2
(b), and after adding 1 x10⁻² M ADEDC ligand (c). The complexation reaction has been investigated by measuring
Figure 2. Spectra of the Pb-DEDCA system obtained in a solution containing a constant ligand concentration and increasing metal concen-trations, obeying the time between the dithiocarbamate addition and the order (after lead), for all solutions with different lead concentrations: µ = 0,1 (NaClO4); T = 25 ± 0,1 °C; CADEDC = 1 x 10⁻⁴ M; CLead(II) = 1 x 10⁻⁵ M (2), 2 x 10⁻⁵ M (3), 3 x 10⁻⁵ M (4), 4 x 10⁻⁵ M (5) 5 x 10⁻⁵ M.
Figure 1. Absorption spectra of the lead (a) and ammonium diethanoldithiocarbamate with maximum absorption peaks at 260 nm and 290 nm (b): lead = 1 x 10⁻⁵ M; ADEDC = 1 x 10⁻⁴ M; 0.1 M NaClO4; T = 25.0 ± 0.1 °C.
Table 1. Gravimetric and microanalysis results for the Pb(DEDC)2 salt.
Results Elementary analysis Gravimetric results
C N H Pb
Theoretical (%) 21.00 4.90 3.50 36.50
the potential evolution of the polarographic wave of 1 x 10⁻³ M lead solution at increasing concentrations of ligand, from 1 x 10⁻² M to 1 x 10⁻¹ M. The lead reduction potential is nearly 400mV less negative than that of the ADEDC li-gand. The large negative potential shift of the lead wave
indicates the formation of complex between this ion and ADEDC and its high stability, as shown in Tables 2 and 3. The polarograms obtained by polarographic reduction of the lead (II) in 0.1 M NaNO3 or 0.1 M NaClO4, are
reversible and controlled by diffusion; the coefficient of charge transfer is very close to the unit (in HCl 0.1 M HNO3
and aPb = 0.921)26. The logarithmic analysis of Lead(II)
polarograms shows a linear dependence of log (id - i/i) vs.
Edc (Fig. 4), the slope corresponds toa reversible reduction.
Addition of the ligand to lead (II) solution in 0.1 M NaNO3
or 0.1 M NaClO4 provoke the shift of half-wave potentials
leading to the reduction of this cation at more cathodic values (Fig. 3 and Tables 2 and 3). In the Pb-ADEDC system the reduction waves of the complexed ion is revers-ible and diffusion-controlled; the logarithmic analysis of the polarograms shows a linear dependence of log (id - i/i)
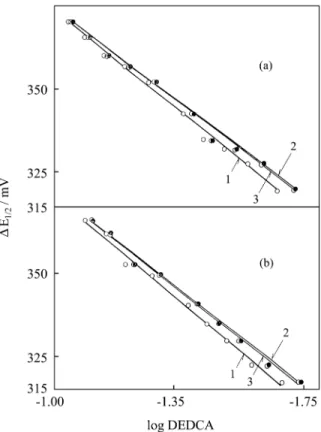
vs. Edc, (Fig. 5). Figure 6 shows that the half wave potential
represented by ∆E1/2 has a linear correlation with the ligand
concentration, this proves that there is only one complex in the solution, the slopes of linear plots area in agreeement
Figure 3. Typical D.C. polarograms of (a) pure supporting electrolyte, 0.1 M NaNO3; (b) 1 x 10⁻³ M lead(II) in 0.1 M NaNO3; (c) 1 x 10⁻³ M lead(II) + 1 x 10⁻² M ADEDC in 0.1 M NaNO3.
Table 2. Variation of the potential (vs. Ag/AgCl/NaCl), ∆E1/2, diffusion current, and pH of a 1 x 10⁻³ M lead solution as a function of the ligand concentration in the presence of 0.1 M NaNO3.
CADEDC ∆E1/2(mV) id(µA) pH -logCL [L]1 -log[L]1 [L]2 -log[L]2 aLX102 -logaL
0.0208 319.55 5.82 7.94 1.6819 0.0181 1.7418 0.0183 1.7376 1.576 1.8022
0.0256 327.25 5.62 8.04 1.5917 0.0229 1.6398 0.0231 1.6364 1.940 1.7121
0.0304 332.25 5.82 8.10 1.5171 0.0277 1.5572 0.0279 1.5545 2.304 1.6374
0.0352 334.60 6.08 8.15 1.4534 0.0325 1.4878 0.0327 1.4855 2.668 1.5740
0.0400 342.40 5.70 7.90 1.3979 0.0373 1.4280 0.0375 1.4260 3.032 1.5183
0.0512 352.30 5.67 7.91 1.2907 0.0485 1.3141 0.0487 1.3125 3.881 1.4111
0.0608 356.80 6.00 7.91 1.2161 0.0581 1.2357 0.0583 1.2344 4.608 1.3364
0.0704 359.95 5.65 7.98 1.1524 0.0677 1.1693 0.0679 1.1682 5.335 1.2727
0.0800 365.50 5.60 7.99 1.0969 0.0773 1.1117 0.0775 1.1107 6.064 1.2172
0.0896 370.10 5.86 7.99 1.0477 0.0869 1.0608 0.0871 1.0600 6.791 1.1680
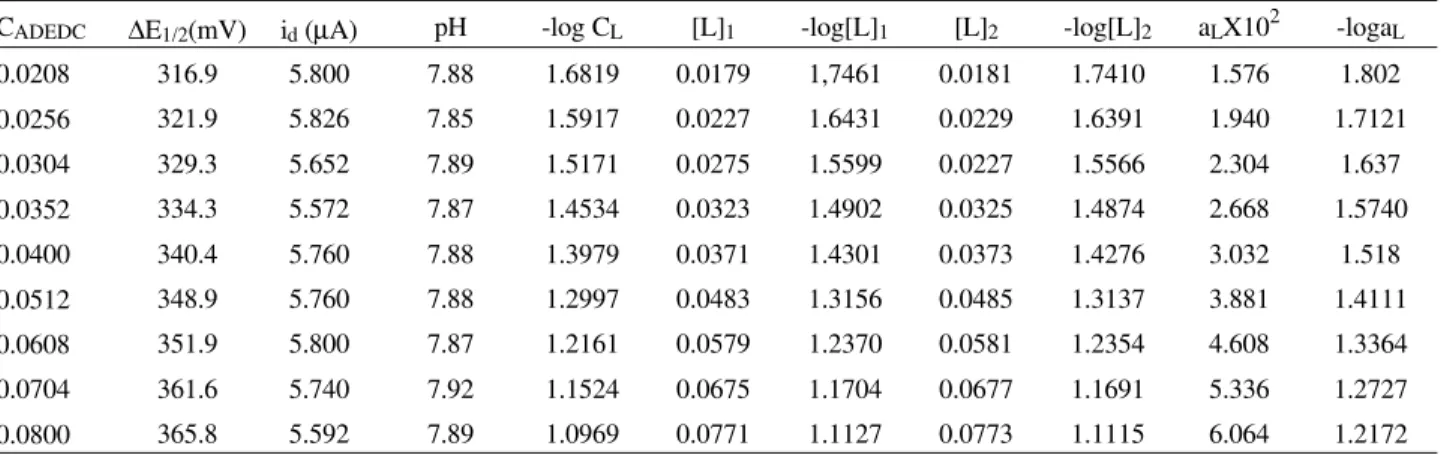
Table 3. Variation of the potential (vs. Ag/AgCl/NaCl), ∆E1/2, diffusion current, and pH of a 1 x 10⁻³M lead solution as a function of the ligand concentration in the presence of 0.1 M NaClO4.
CADEDC ∆E1/2(mV) id (µA) pH -log CL [L]1 -log[L]1 [L]2 -log[L]2 aLX102 -logaL
0.0208 316.9 5.800 7.88 1.6819 0.0179 1,7461 0.0181 1.7410 1.576 1.802
0.0256 321.9 5.826 7.85 1.5917 0.0227 1.6431 0.0229 1.6391 1.940 1.7121
0.0304 329.3 5.652 7.89 1.5171 0.0275 1.5599 0.0227 1.5566 2.304 1.637
0.0352 334.3 5.572 7.87 1.4534 0.0323 1.4902 0.0325 1.4874 2.668 1.5740
0.0400 340.4 5.760 7.88 1.3979 0.0371 1.4301 0.0373 1.4276 3.032 1.518
0.0512 348.9 5.760 7.88 1.2997 0.0483 1.3156 0.0485 1.3137 3.881 1.4111
0.0608 351.9 5.800 7.87 1.2161 0.0579 1.2370 0.0581 1.2354 4.608 1.3364
0.0704 361.6 5.740 7.92 1.1524 0.0675 1.1704 0.0677 1.1691 5.336 1.2727
with a 1:1 type complex. The half wave potentials of the Lead(II), free and complexed, were determined from the intercepts of the straight lines of Figs. 4 and 5.
Determination of coordination number and overall stability constants
The following equation (Lingane’s simplified equa-tion27-28) was used to calculate the coordination number and the overall stability constants of the complexes formed in the system studied.
∆E 1⁄ 2=
0.0591
n log βMLn+ N 0.0591
n log CL (1)
The results obtained using this equation (log βMLn =
15.4 in NaNO3 and log βMLn = 15.6 in NaClO4) area not in
agreement with previous results13 obtained for the same system. Thus, a reevaluation was carried out in order to
validate the approximations between the extended Lin-gane’s Eq. (2) and Eq. (1).
∆E 1⁄2=0.0591
n log [ IMLn
IM ] [
fM f Ln
fMLn
] [βMLn CLn] (2)
The Eq. (2), was first obtained by Heyrovsky and Ilk-ovic29 and later by Van Stackelberg and Freyhold30 as well
as Lingane31. This equation can be applied only when one
complex is present and its stability is relatively high. The Lingane treatment for the formation of simple complexes allows the calculations of overall stability con-stant and the maximum coordination number, where CL is
the analytical ligand concentration, ∆E1/2 is the difference
in the half-wave potential when CL = 0 and when CL≠ 0,
IM and IMLn are the corresponding diffusion current
con-stants and βMLn values are the stoichiometric overall
stabil-ity constants at constant ionic strength.
Validity of the aproximations
Equation (2), named the extended Lingane’s equation, can be simplified to Eq. (1), considering CL = [L]; IM = IMLn
and (fM.fLn / fMLn) = 1,0.
To verify the validity of the approximation CL = [L],
the correct correlation between ∆E1/2 x log [L] was evalu-Figure 4. Linear dependence of log (id - i/i) vs. Edc for the lead(II) solution
in 0.1 M NaNO3. Other conditions as described in Experimental section.
Figure 5. Linear dependence of log (id - i/i) vs. Edc for the complex in 0.1 M NaNO3. Other conditions as described in Experimental section.
ated by successive approximations between Eq. (1) and the known equation [L] = CL - N’ CM32. The slope of the Eq.
(1) (∆E1/2 x log CL) was determined considering, firstly, CL
and later [L], in this equation. The iterative cycle of ap-proximations was repeated until the convergence of the results (constant values) for N and log βMLn (Tables 2 and
3 and Fig. 6). Errors of 6% for N were considered good results and 0.98% for log βMLn, insignificant. Therefore, the
approximations were considered valid.
In the second approximation the diffusion current was evaluated by substituting the values of IMLn and IM
(5.782 µA and 7 µA, respectively) in Eq. (2). In this case, CL was used instead of activity. The error obtained was
0.54% for log βMLn and no error was found for N.
To eliminate (fM.fLn / fMLn) in the Eq. (2), the ionic
strength and the concentrations of the species should be considered. The experiments were carried out in an ionic strength of 0.1 M and the activity coefficient of the ligand (fL) was found to be 0.758. Considering that the ideal value
for (fM.fLn / fMLn) ratio should be 1.0, this approximation
was not recommended. In order to support this conclusion, Lingane’s equation was applied considering the activity instead of the ligand concentration. The following results were obtained: N = 2.68 (NaNO3) and 2.86 (NaClO4); log
βMLn = 15.80 (NaNO3) and 15.92 (NaClO4). The
compari-son between these values and the one obtained using CL,
reveals that there was no difference for the coordination number. However, the error was 3% for log βMLn, and we
concluded that Lingane’s equation should be used in the extended form, and that approximations are not valid. Therefore, the correct values for N and βMLn were obtained
from a plot of ∆E1/2vs. ligand activity, as shown in Fig. 7.
Finally, to check the results obtained in the present work, the constant (log βMLn) and the coordination number
(N) of the same system were also determined using a lead electrode developed in our laboratory13. The results are
presented in Table 4. Table 5 gives a general comparison between the polarographic and potentiometric methods.
Kinetic evaluation on the stability of diethanoldithiocarbamates
The ideal concentration range for lead (1 x 10⁻⁵ to 5 x 10⁻⁵ M) to observe spectrophotometrically its reaction with ADEDC, corresponds to a molar ratio between 10 and 2, for a constant ligand concentration of 1 x 10⁻⁴ M. This range is very short to permit a comparison among the spectro-photometric, polarographic and potentiometric results per-formed in the present work. The corresponding spectral variation for this concentration range shows high depend-ence of kinetic factors, since the two isosbestic points are a function of the time control. Linear dependence of the absorbance on metal concentration also depends on time control of the reaction.
The kinetic decomposition rate was investigated in a solution containing 10-4M ADEDC with ionic strength 0.1 M (NaClO4) at pH 4.0 (acetate buffer). Figure 8 shows the
fast decomposition of the ADEDC in acid media, as re-ported in the literature20. The apparent rate constant (Kobs)
was determined as being 0.37 min-1 with a t1/2 of
approxi-mately 2 min, as shown in Fig. 9.
Figure 7. Linear dependence of half wave potential (∆E1/2) on the ligand activity (ADEDC), in 0.1 M NaNO3 (a) and 0.1 M NaClO4 (b). Other conditions as described in the Experimental section.
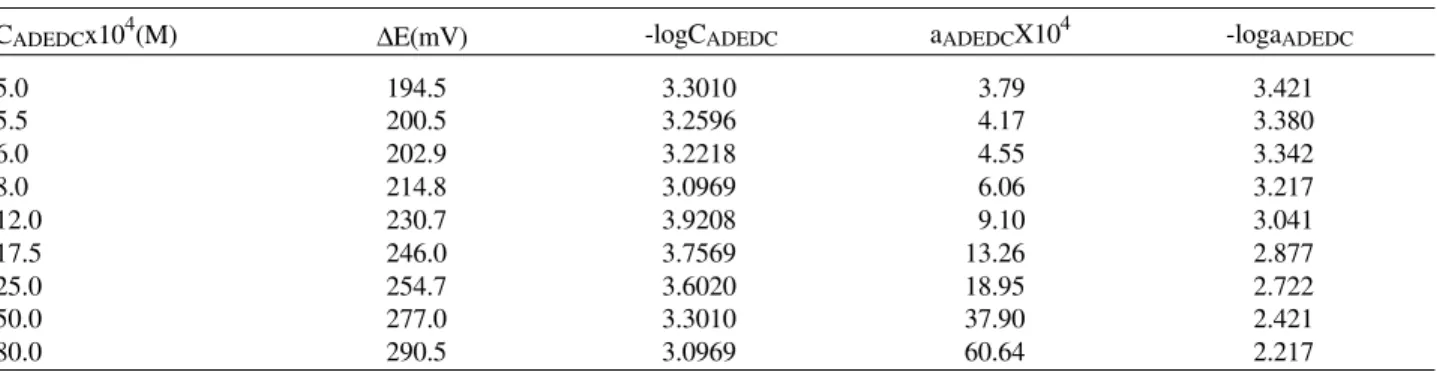
Table 4. Potentiometric data referent the determination of N e βn (0.1M NaNO3) using extended Lingane’s equation and ligand activity.
CADEDCx104(M) ∆E(mV) -logCADEDC aADEDCX104 -logaADEDC
5.0 5.5 6.0 8.0 12.0 17.5 25.0 50.0 80.0
194.5 200.5 202.9 214.8 230.7 246.0 254.7 277.0 290.5
3.3010 3.2596 3.2218 3.0969 3.9208 3.7569 3.6020 3.3010 3.0969
3.79 4.17 4.55 6.06 9.10 13.26 18.95 37.90 60.64
The same study was carried out at pH 8.0 and the ADEDC compound presented, under these conditions, a half life time of 2.26 h, and only after eleven hours, the decomposition reached 90%. The kinetic behaviour was
also evaluated for the lead complex and the results can be seen in Table 6. According to the high stability of the complex, its decomposition was considered slow (10%, at pH 8.0 during approximately one hour of reaction) when compared to the ligand under the same conditions (50% of decomposition after 2.26 h of reaction). These results show a very good agreement with the high stability constant of the system, studied in the present work.
Conclusion
This work presents a polarographic study of the Pb-AD-EDC system in aqueous media. The results indicate that the complex can only be polarographically studied after addi-tion of a mixture of maximum suppreser soluaddi-tion contain-ing Triton-X-100 and polyacrylamide. Under these conditions, N (3.0) and log βMLn (16.0) were determined,
after evaluation of all possible Lingane’s equation approxi-mations. According to the results and evaluations carried out in this work it was observed that the Lingane’s equation may be used in the extended form, without considering any approximations. A complete graphical and numerical cal-culation of the extended Lingane’s equation shows its
Table 6. Spectrophotometric data on the stability (decomposition) of the lead complexes of diethanoldithiocarbamates. µ = 0.1 (NaClO4); T = 25 ± 0.1 °C.
Abs (262 nm) t (min.) Decompositon (%)
1.3150 1.2920 1.2733 1.2481 1.2346 1.2241 1.2155 1.2083 1.2021 1.1966 1.1899 1.1849 1.1791 1.1737
1.24 3.00 5.00 10.00 15.00 20.00 25.00 30.00 35.00 40.00 45.00 50.00 55.00 60.00
- 1.53 3.05 4.73 6.10 6.87 7.63 7.78 8.24 9.16 9.23 9.92 10.00 10.68
Table 5. General results of the determination of N e βn for the Pb-ADEDC system.
Data
Polarography Potentiometry
Lingane’s Method Lingane’s Method Leden’s Method
(NaNO3) (NaClO4) (NaClO4) (NaClO4)
N 2.7 2.9 2.7 2.9
logβN
15.80* 15.92* 15.91*
16.62
16.11** 16.28** 16.27**
* simple Lingane’s Equation. ** complete Lingane’s Equation.
Figure 8. Spectra referent the ADEDC decomposition in acid media: pH = 5.0 (acetate buffer); T = 25 ± 0.1 °C.
importance in the determination of the coordination num-ber and overall stability constant of this complex. The present evaluation of the Lingane’s equation shows that it is not always possible to use the simplified form in order to avoid the inherent statistical erros.
Acknowledgment
The authors gratefully acknowledge financial support from FAPESP, a fellowship from CAPES. Helpful discus-sions with Dr. O.E.S. Godinho, Dr. M.T. Grassi and Dr. M.M.K. Takiyama are also acknowledged.
References
1. Ovenston, T.C.J.; Paker, C.A. Anal. Chim. Acta1950,
4, 135.
2. Thorn, G.D.; Ludwig, R.A. The Dithiocarbamates and Related Compounds, Elsevier Publishing Com-pany, Amsterdam, 1962, 298p.
3. Magee, R.J.; Hill, J.O. The Analytical Chemistry of Metal Dithiocarbamate Complexes. Reviews in Anal. Chem. 1985, VIII 5-72.
4. Delepine, M. Compl. Rend.1907, 144, 1125. 5. Hulanicki, A. Talanta, 1967, 14, 1371.
6. Inczedy, J. In Analytical Applications of Complex Equilibrium, J. Tyson (translated ed.), Ellis Horwood, 1976.
7. Ringbom, A. Complexation in Analytical Chemistry. Wiley, New York, 1963.
8. Sillen, L.G.; Martell, A. Stability Constants of Metal-Ion Complexes. The Chemical Society, London, 1964. 9. Marques, A.L.B., and Chierice G.O. Química Nova
1990, 13 (2), 133.
10. Marques, A.L.B.; Chierice, G.O.; Gambardella, A.M.; Santos, R. Química Nova1990, 13 (2), 125.
11. Marques, A.L.B.; Chierice, G.O. J. Braz. Chem. Soc. 1993, 4 (1), 17.
12. Marques, A.L.B.; Chierice, G.O. Química Nova1991,
14 (4), 30.
13. Marques, A.L.B.; Chierice, G.O. An. Assoc. Bras. Quím.1998, 47 (2) 85.
14. Breviglieri, S.T.; Cavalheiro, E.T.G.; Chierice, G.O.
Polyedron1996, 15 (5-6),839.
15. Gríolli, T.M.; Cavalheiro, E.T.G.; Gomes Neto, J.A.; Chierice, G.O. J. Sol. Chem.1994, 23 (7) 543. 16. Haas, W.; Schwarz, T. Mikrochim. Acta1963, 2, 253. 17. Vogel, A.I. Análise Inorgânica Quantitativa, 4a. ed.
Guanabara Dois, RJ, 1981.
18. Manual da Merck. Métodos Complexométricos de Valoracion con Titriplex, 3a. ed., E. Merck, Darmstadt.
19. Smith, R.M.; Hurdley, T.G. Anal. Chim. Acta1984,
166, 271.
20. King, J.L.; Fritz, J.S. Anal. Chem.1985, 57, 1016. 21. Randle, T.H.; Cardwell, T.J.; Magee, R. J. Aust. J.
Chem. 1975, 28, 21.
22. Budnikov, G.K.; Ulakhovich, N.A. Comunication 1.
Zh. Anal. Khim.1973, 28 (03), 448
23. Budnikov, G.K.; Toropova, V.F.; Ulakhovich, N.A.; Viter, I.P. Comunication 5. Zh. Anal. Khim. 1975,
30(11), 2120.
24. Budnikov, G.K.; Toropova, V.F.; Ulakhovich, N.A.; Medyantseva, E.P.; Frolova, V.P. Zh. Anal. Khim. 1977, 32(2), 212.
25. Randle, T.H.; Cardwell, T.J.; Magee, R. J. Aust. J. Chem. 1976, 29,85.
26. Luca, C.K.; Azab, H.A.; Tanase, I. A. Anal. Letters,
1985, 18 (A4), 449.
27. Lingane, J. J. Chem. Rev. 1941, 29, 1.
28. Crow, D.R. Polarography of Metal Complexes. Aca-demic Press, London, N.Y., 1969.
29. Heyrovsky, J.; Ilkovic, D. Coll. Czech. Chem. Com-mun. 1935, 7, 198.
30. Stackelberg, M.V.; Freyhold, H. Z. Elektrochem. 1940, 46,120.
31. Lingane, J. J. Chem. Rev. 1941, 29, 1.
32. Rossoti, F.J.C.; Rossoti, H. The Determination of Sta-bility Constants. Mc Graw Hill, London, 1961.