Article
0103 - 5053 $6.00+0.00
*e-mail: [email protected]
Screening Process for Activity Determination of Conductive
Oxide Electrodes for Organic Oxidation
Geoffroy R. P. Malpass and Artur J. Motheo*
Instituto de Química de São Carlos, Universidade de São Paulo, CP 780, 13560-970 São Carlos-SP, Brazil
Um método modificado para o cálculo da carga faradaica normalizada (qfN) é proposto. O método envolve a simulação de um processo de oxidação, por voltametria cíclica, empregando potenciais na região da reação de desprendimento de oxigênio (RDO). Este método é aplicável a espécies orgânicas, cuja oxidação não é manifestada por um pico de oxidação definido em eletrodos de óxidos condutores. A variação de qfN para eletrodos de composição nominal Ti/RuXSn1-XO2 (x = 0,3; 0,2 e 0,1), Ti/Ir0,3Ti0,7O2 e Ti/Ru0,3Ti0,7O2, na presença de diferentes concentrações de formaldeído foi investigada. Foi observado que eletrodos contendo SnO2 são os mais ativos frente à oxidação de formaldeído. Subseqüentemente, para investigar a aplicabilidade do modelo proposto, eletrólises galvanostáticas (40 mA cm-2) de formaldeído foram efetuadas em duas concentrações
distintas (0,10 e 0,01 mol dm-3). Os resultados estão de acordo com o modelo proposto e indicam
que este novo método pode ser usado para determinar a atividade relativa de eletrodos de óxido. De acordo com trabalhos prévios, pode ser concluído que não somente a natureza do material eletródico, mas também a espécie orgânica em solução e a sua concentração são fatores importantes a serem considerados na oxidação de espécies orgânicas.
A modified method for the calculation of the normalized faradaic charge (qfN) is proposed. The method involves the simulation of an oxidation process, by cyclic voltammetry, by employing potentials in the oxygen evolution reaction region. The method is applicable to organic species whose oxidation is not manifested by a defined oxidation peak at conductive oxide electrodes. The variation of qfN for electrodes of nominal composition Ti/RuXSn1-XO2 (x = 0.3, 0.2 and 0.1), Ti/Ir0.3Ti0.7O2 and Ti/Ru0.3Ti0.7O2 in the presence of various concentrations of formaldehyde was analyzed. It was observed that electrodes containing SnO2 are the most active for formaldehyde
oxidation. Subsequently, in order to test the validity of the proposed model, galvanostatic electrolyses (40 mA cm-2) of two different formaldehyde concentrations (0.10 and 0.01 mol dm-3)
were performed. The results are in agreement with the proposed model and indicate that this new method can be used to determine the relative activity of conductive oxide electrodes. In agreement with previous studies, it can be concluded that not only the nature of the electrode material, but also the organic species in solution and its concentration are important factors to be considered in the oxidation of organic compounds.
Keywords:DSA®, aldehydes, oxidation, normalized faradaic charge
Introduction
Dimensionally stable anodes have been used extensively in electro-organic chemistry in the last decade, especially as prospective materials for the treatment of waste materials. The general mechanism proposed by Comninellis1
discriminates between “active” and “non-active” materials where both mechanisms occur via the initial formation of
•OH
ads. It is said that “active” materials (e.g. RuO2) promote
a selective oxidation via the formation of higher oxides, which, in turn, oxidize the organic species. On the other hand, “non-active” materials (e.g. SnO2) do not present higher oxidation states and the •OHads interacts directly with the organic species to promote complete oxidation to CO2. It should be noted, however, that the mechanism described1
does not consider the adsorption of the organic molecule on the electrode surface. According to the proposed scheme1
electro-synthesis would require an “active” material. However, it has been shown that not only the electrode material, but also the type of organic species present,2 its concentration3,4
and the solvent/supporting electrolyte used5 can play an
important role. It is interesting to note that often a trial and error approach is employed when choosing oxide materials for electro-oxidation reactions.
In this study a screening process for determining the activity of oxide electrodes for the oxidation of formaldehyde is presented. Electrodes of the following compositions were used: Ti/RuXSn1-XO2 (x = 0.3, 0.2 and 0.1), Ti/Ir0.3Ti0.7O2 and Ti/Ru0.3Ti0.7O2. The screening method involves the variation of the organic concentration and calculation of the resultant effect on the voltammetric charge. The results obtained are then compared to results obtained during the galvanostatic oxidation of formaldehyde.
It is the aim of this paper to demonstrate that it is not necessarily the nature of the electrode material, but also the organic species and its concentration determine the activity. It is hoped that such a “screening process” will aid in the choice of electrode material for a given organic reaction.
Experimental
A two-compartment filter-press cell, separated by an ion exchange membrane (IONAC AM 3470), was used with a conductive oxide anode (nominal area, 14 cm2) and
a stainless steel plate cathode (area 14 cm2) as described
elsewhere.3,6
The Ti/RuxSn1-xO2 electrode was prepared in the laboratory by the standard technique of thermal decomposition of the appropriate mixtures of precursor salts (0.2 mol dm-3 SnCl
2 and RuCl3.nH2O) dissolved in
1:1 HCl (v/v). For the Ti/Ir0.3Ti0.7O2 electrode the precursor salts were IrCl3 and TiCl4 (both 0.2 mol dm-3) dissolved
in 1:1 HCL (v/v). The calcination of the electrode was performed at 400 °C under a flux of oxygen (5 cm3 min-1).
After each addition of chloride precursors the electrode was calcinated for 10 min. When the desired mass was achieved the electrode was calcinated at 400 °C for a further hour. The electrode of nominal composition Ti/Ru0.3Ti0.7O2 was obtained commercially from De Nora, Brazil.
The cyclic voltammetry measurements were carried out in 0.5 mol dm-3 H
2SO4 using a potentiostat (EG&G/PAR
model 273). The potentials in this study are referred to the mercury sulfate electrode (MSE).
Acetaldehyde (CH3CHO 99%) and propionaldehyde (CH3CH2CHO 98%) were obtained from Merck and used without further purification. The other reagents: formaldehyde (H2CO 37% solution with 12.5% methanol), sulfuric acid (H2SO4 98%), formic acid (HCOOH 94.8%),
were obtained from Mallinckrodt and also used without further purification.
Experimental procedure
The concentration of the organic species was varied in the range of 0.01 to 0.50 mol dm-3. For each concentration
voltammograms were recorded in the potential range of −0.40 to 1.00 V vs. MSE at sweep rates of 20 to 500 V s-1. Although it is not common that such high anodic
potentials are used in the study of oxide electrodes, in this study the aim was to imitate the conditions encountered during galvanostatic electrolysis (i.e. under conditions of simultaneous oxygen evolution).1 The anodic charge (q
A)
was determined by integration of the anodic component of the voltammogram, as will be described in the following section.
Results and Discussion
Cyclic voltammetry: normalized faradaic charge (qfN)
There is often some difficulty when comparing the catalytic properties of distinct electrode materials. Differences in electrode morphology can lead to misleading results. With this in mind, it is important to eliminate morphological differences when, for example, studying the oxidation of organic compounds.
The anodic voltammetric charge (qA/mC cm-2) is
generally considered a measure of the electroactive area of conductive oxides.4 The value of q
A is a consequence of
different factors that include the mobility of the supporting electrolyte ion, the potential sweep rate as well as the preparation method.4 q
A is calculated in the potential region
where the decomposition of water does not occur (normally 0.4 to 1.4 V vs. RHE). In acid media, in accordance with equation 1, the value of qA is the result of proton exchange with the electrolyte and the capacitive charge (pseudo-capacitive charge).6
MOx(OH)y + δH+ + δe–↔ MO
x-δ(OH)y+δ (1)
Thus, qA can be considered the active area available for H+ exchange with the solution. This active area can
of the organic molecules that limits their diffusion to the electrochemically active sites to which the smaller H+ has
access. Hence a large qA value is no guarantee of increased catalytic activity for organic oxidation.
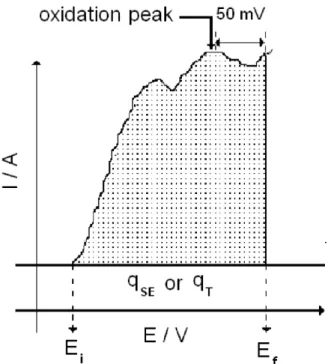
The normalized faradaic charge (qfN)5 is a parameter
that can be used to provide an idea of catalytic activity of different materials. The value of qfN is determined by calculating the charge of the anodic component of the voltammogram that corresponds to the oxidation peak (qT) and subtracting from this the charge over the same potential interval solely in the presence of the supporting electrolyte (qSE, see Figure 1). Thus the faradaic charge (qf), which is the charge associated with the oxidation of the organic species, is determined according to the following relationship:
qT – qSE = qf (2)
The normalized faradaic charge is then calculated according to:
qf / qA = qfE (3)
This gives a value in which the morphological effects have been eliminated and thus permits the comparison of the global catalytic activity of distinct electrode materials. However, it should be noted that the oxidation of organic
species at conductive oxide electrodes is not always manifested in the form of a distinct peak. In fact, oxidation is often represented by the dislocation (anodically or cathodically) of the current associated with the oxygen evolution reaction (OER) and thus the method presented by Zanta et al.5 is difficult to apply.
In this study, a modification of the method of determination of qfN for oxidation of organic species, which is not manifested in the form of a clear peak, is proposed. Thus, the determination of qfN was achieved by establishing the potential at which oxidation of the organic takes place (E > 0.5 V vs. MSE at high organic concentrations). With this in mind, the anodic potential limit was set at 1.0 V, which is sufficiently positive to result in copious oxygen evolution. Thus, the charge was calculated from 0.5 V to 1.0 V in the absence of the organic species and denoted qSE (i.e. the charge due to the supporting electrolyte). In the presence of the organic species the charge was then calculated over the same potential range and denoted as qT. The value of qf and qfN were calculated as previously described in equations 1 and 2. The calculation is represented schematically in Figure 2.
In this manner, a modified method for comparing the catalytic activity of different electrode materials, which considers simultaneous oxygen evolution,1 is presented
here.
Figure 1. Method of calculation of the normalised faradaic charge (qfN) presented in literature. Information taken from information provided in reference 5.
Cyclic voltammetry in absence of organic species
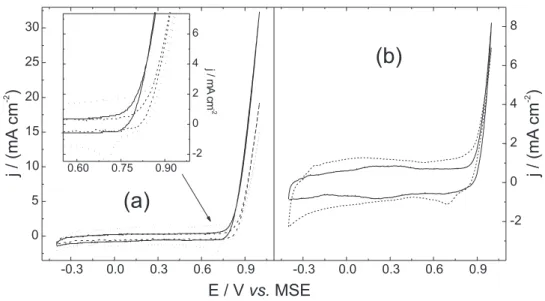
The voltammograms in 0.5 mol dm-3 sulfuric acid are
shown in Figure 3. The anodic charge (qA / mC cm-2, calculated
in the region of water stability, −0.20 to 0.50 V vs. MSE) has the order Ti/Sn0.3Ti0.7O2 > Ti/Ru0.3Ti0.7O2 > Ti/Ir0.3Ti0.7O2 > Ti/Sn0.1Ti0.9O2 > Ti/Sn0.2Ti0.8O2. The magnitude of qA is considered a measure of the electro-active area of the electrode6 and hence might be considered an indicator of
the overall catalytic power of a given material.
Typically, the effect of increasing the sweep rate is manifested by a decrease in the value of qA. This is attributed to the exclusion of less easily accessible sites located in the inner part of the electrode.7 It was observed
that the electrodes containing SnO2 present a much more accentuated decrease in the anodic charge than the Ti/Ir0.3Ti0.7O2 or Ti/Ru0.3Ti0.7O2 electrode.
Cyclic voltammetry in presence of formaldehyde
The addition of formaldehyde to the electrolyte results in typical DSA® type behavior for all electrodes in the
presence of this organic species (Figure 4).3,8,9 This is
exemplified by an increase in the value of the anodic charge in the potential region above 0.5 V vs. MSE and an increase in the current associated with the oxygen evolution reaction (OER). The effect of increasing the concentration of formaldehyde is manifested by a quasi-linear increase in the magnitude of qfN for all electrodes.
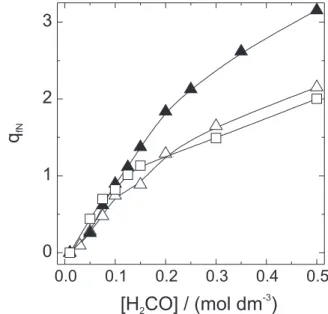
The behavior of qfN with H2CO concentration for the electrodes with nominal compositions Ti/Ir0.3Ti0.7O2, Ti/Ru0.3Ti0.7O2 and Ti/Ru0.3Sn0.7O2 is presented in Figure 5.
Analysis of Figure 5 would indicate the following order of activity (considering the final values of qfN at 0.5 mol dm-3
H2CO):
Ti/Ru0.3Sn0.7O2 > Ti/Ru0.3Ti0.7O2 >> Ti/Ir0.3Ti0.3O2 (4)
This indicates that any prospective process for the oxidation of formaldehyde would be more fruitful if electrodes of nominal composition Ti/RuXSn1-XO2 are used. The reaction orders presented above will be tested and verified for galvanostatic electrolyses in a later section of this paper.
Figure 3. Cyclic voltammograms in 0.5 mol dm-3 H
2SO4 of the electrodes employed. (a) Electrodes of composition Ti/RuXSn1-XO2: x = 0.3 (dotted line),
0.2 (solid line) and 0.1 (dashed line). (b) Ti/Ir0.3Ti0.7O2 (solid line) and Ti/Ru0.3Ti0.7O2 (dashed line). v = 20 mV s-1.
Figure 4. Cyclic voltammograms of the Ti/Ru0.3Sn0.7O2 electrode in 0.5 mol dm-3 H
2SO4 + 0.00 (solid line); 0.05 (dashed line); 0.20 (dotted line)
mol dm-3 H
When the results obtained are considered together with the work of Zanta et al.,5 it is interesting to consider the
behavior of Ti/RuO2 electrodes in non-aqueous solvents, where the possibility of forming MO(S), instead of the MO(OH) observed in water, is suggested.5 At higher currents
an oxidation process was observed, which was attributed to the oxidation of the solvent.5 If the current associated with
OER increases with formaldehyde concentration, as observed in this study, the mechanism of oxidation must follow a direct electron transfer step between the formaldehyde and the electrode. In this light it is probable that the formation of some kind of MO(H2CO) species is involved, which is then oxidized by a direct mechanism:
MO(H2CO) →MO + HCOOH (5)
This kind of mechanism does not fall within that presented by Comninelliis,1 as the mechanism does not
consider interaction of the organic species with electrode. The hypothesis presented here is supported by the fact that in previous studies in this laboratory we have shown that the OER current increases in the presence of formaldehyde.3
However, O2 production in fact decreases,3 indicating that
the current increase is not associated with O2 production. Thus, considering the direct electron transfer mechanism, the rate of O2 evolution is decreased, however, the mechanism probably remains the same.
Effect of electrode material and organic concentration
Up to this point it has been shown that the difference in the electrode material heavily affects the global catalytic
activity for oxidation. If the series of electrodes of nominal composition Ti/RuXSn1-XO2 are compared with each other, the behavior seen in Figure 6 for formaldehyde is observed. A cursory glance at Figure 6 would indicate the following sequence of activity (considering the final values of qfN at 0.5 mol dm-3 H
2CO):
Ti/Ru0.2Sn0.8O2 > Ti/Ru0.3Sn0.7O2 > Ti/Ru0.1Sn0.9O2 (6)
However, if the data in Figure 6 is separated in to low (0.01-0.05 mol dm-3) and high (0.10-0.50 mol dm-3)
concentration domains, the behavior shown in Figure 7 is observed.
The slopes calculated from the data in Figure 7 are given in Table 1. It apparent that the electrodes present different activities in different concentration ranges. At low concentrations the electrode with nominal composition Ti/Ru0.1Sn0.9O2 presents the greater increase in qfN, whereas at higher concentrations the greater increase is seen for the electrode Ti/Ru0.2Sn0.8O2. Thus, considering the values
Figure 5. Variation of qfN with H2CO concentration: () Ti/Ru0.3Ti0.7O2;
() Ti/Ir0.3Ti0.7O2; () Ti/Ru0.3Sn0.7O2. Figure 6. Variation of qfN with H2CO concentration for electrodes
of nominal composition Ti/RuXSn1-XO2: () Ti/Ru0.1Sn0.9O2; () Ti/ Ru0.2Sn0.8O2; () Ti/Ru0.3Sn0.7O2.
Table 1. Variation of qfN / [R] (dm3 mol-1)
Electrode Low High
Ti/Ru0.3Ti0.7O2 0.0018 0.0012
Ti/Ru0.1Sn0.9O2 0.0110 0.0025
Ti/Ru0.2Sn0.8O2 0.0064 0.0049
Ti/Ru0.3Sn0.7O2 0.0069 0.0034
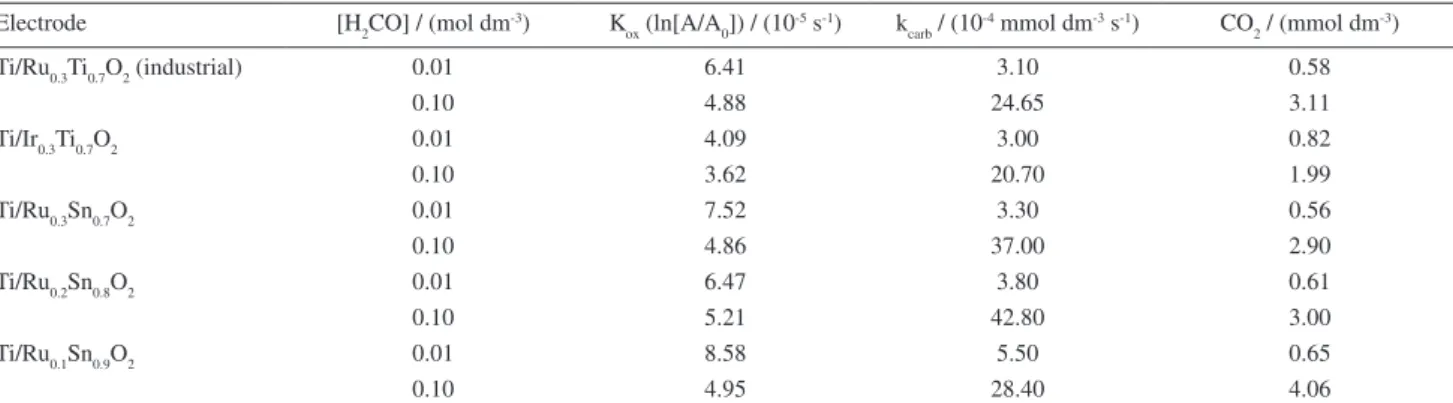
Table 2. Data obtained during the oxidation of formaldehyde solutions
Electrode [H2CO] / (mol dm-3) K
ox (ln[A/A0]) / (10
-5 s-1) k carb / (10
-4 mmol dm-3 s-1) CO
2 / (mmol dm -3)
Ti/Ru0.3Ti0.7O2 (industrial) 0.01 6.41 3.10 0.58
0.10 4.88 24.65 3.11
Ti/Ir0.3Ti0.7O2 0.01 4.09 3.00 0.82
0.10 3.62 20.70 1.99
Ti/Ru0.3Sn0.7O2 0.01 7.52 3.30 0.56
0.10 4.86 37.00 2.90
Ti/Ru0.2Sn0.8O2 0.01 6.47 3.80 0.61
0.10 5.21 42.80 3.00
Ti/Ru0.1Sn0.9O2 0.01 8.58 5.50 0.65
0.10 4.95 28.40 4.06
kcarb:Rate of formation of respective carboxylic acid.
Figure 7. Variation of qfN at (a) low and (b) high concentrations with H2CO concentration: () Ti/Ru0.3Ti0.7O2; () Ti/Ir0.3Ti0.7O2; () Ti/Ru0.1Sn0.9O2; () Ti/Ru0.2Sn0.8O2.
presented in Table 1 it is possible to suggest the following order of activity for formaldehyde oxidation:
Low concentrations:
Ti/Ru0.1Sn0.9O2 > Ti/Ru0.3Sn0.7O2 > Ti/Ru0.2Sn0.8O2 > Ti/Ru0.3Ti0.7O2 >> Ti/Ir0.3Ti0.3O2 (7)
High concentrations:
Ti/Ru0.2Sn0.8O2 > Ti/Ru0.3Sn0.7O2 > Ti/Ru0.1Sn0.9O2> Ti/Ru0.3Ti0.7O2 >> Ti/Ir0.3Ti0.3O2 (8)
These orders of activity suggest that different concentrations might require different materials for optimization of a given process. This is important as industrial waste discharges can vary in concentration depending on the nature of the manufacturing process.
Galvanostatic electrolysis
By comparing the variation of qfN for different electrodes, it is possible to establish a sequence that predicts the order
Figure 8. Concentration-time profile obtained during oxidation (40 mA cm-2) of a 0.10 mol dm-3 formaldehyde solution. () Ti/Ir
0.3Ti0.7O2;
() Ti/Ru0.3Ti0.7O2; (X) Ti/Ru0.2Sn0.8O2; () Ti/Ru0.3Sn0.7O2; ()Ti/Ru0.1Sn0.9O2.
of activity for different oxide electrodes. The measurements were obtained under conditions of simultaneous oxygen evolution, which permits the simulation of a galvanostatic oxidation process.
The galvanostatic oxidation of formaldehyde-containing solutions was performed at 40 mA cm-2 in order to compare
with previous studies performed in this laboratory.3,8 Two
different concentrations were investigated, one in the higher concentration domain (0.10 mol dm-3) and the other in the
lower range (0.01 mol dm-3), in order to compare the results
obtained in the previous section.
The only detected products of formaldehyde oxidation were formic acid and CO2. Figure 8 presents the concentration-time profile of the oxidation of a 0.10 mol dm-3
values of the constants (kox) are presented in Table 2. Analysis of the values presented in Table 2 for higher concentrations gives the following order of reaction:
Ti/Ru0.2Sn0.8O2>Ti/Ru0.3Sn0.7O2 > Ti/Ru0.1Sn0.9O2> Ti/Ru0.3Ti0.7O2 >>Ti/Ir0.3Ti0.3O2 (9)
This sequence of reaction is the same as that presented in Figure 7. Following the same method for lower concentrations:
Ti/Ru0.1Sn0.9O2 > Ti/Ru0.3Sn0.7O2 Ti/Ru0.2Sn0.8O2>
Ti/Ru0.3Ti0.7O2 >> Ti/Ir0.3Ti0.3O2 (10)
which is the same as Figure 8.
It should be noted that the reaction sequence can be applied to the data presented in Table 2 only in the case of the rate of formaldehyde disappearance and formic acid formation. The activity for formation of CO2 is not predicted by the reaction sequence given. This indicates that the variation of qfN can only be applied considering the predominant reaction that occurs (and subsequently the formation of any relatively stable product), but not to the formation of secondary products and so on.
The results obtained indicate that it is possible to predict the activity of oxide electrodes towards galvanostatic oxidation.
Conclusions
A relatively quick and easy method, which employs cyclic voltammetry, for the “screening” of electrode materials for a given reaction has been presented. The method involves the simulation of an oxidation process by employing potentials that enter the region of the oxygen evolution reaction. A modified method for the calculation of the normalized faradaic charge (qfN) is presented. Although the calculation of qfN has already been described in the literature, the current modification enables the method to be applied to organic species whose oxidation is not manifested by a defined oxidation peak at conductive oxide electrodes. It is hoped that the method presented enables a rapid triage of electrode materials before any
time consuming electrolysis assays are performed. It is suggested that the oxidation of formaldehyde may occur via direct electron transfer at the electrode surface mediated by the formation of an MO(H2CO) species indicating that not only the nature of the electrode material, but also the organic species in solution and its concentration are important factors to be considered in the oxidation of organic compounds. This can be important as any one given prospective treatment process might be optimized by the use of a certain electrode material, whereas another process would require the use of another.
Acknowledgments
The authors wish to thank the Brazilian financing agency FAPESP (process No. 04/09588-1 and 99/07599-6) for the financial support.
References
1. Comninellis, Ch.; Electrochim. Acta 1994, 39, 1857. 2. Bock, C.; MacDougall, B.; J. Electrochem. Soc. 1999, 146,
2925.
3. Malpass, G. R. P.; Motheo, A. J.; J. Appl. Electrochem. 2001,
31, 1351.
4. Burke, L. D.; Murphy, J.; J. Electroanal. Chem.1979, 101,
351.
5. Zanta, C. L. P. S.; De Andrade, A. R.; Boodts, J. F. C.;
Electrochim. Acta 1999, 44, 3333.
6. Trasatti, S.; Electrochim. Acta 1991, 36, 225.
7. Kodinstev, I. M.; Trasatti, S.; Rubel, M.; Wieckowski, A.; Kaufner, N.; Langmuir 1992, 8, 283.
8. Malpass, G. R. P.; Motheo, A. J.; J. Braz. Chem. Soc. 2003, 14, 645.
9. Motheo, A. J.; Gonzalez, E. R.; Tremiliosi-Filho, G.; Olivi, P.; Andrade, A. R.; Kokoh, B.; Léger, J. -M.; Belgsir, E. M.; Lamy,
C.; J. Braz. Chem. Soc. 2000, 11, 16.
Received: September 28, 2007 Web Release Date: April 2, 2008