69
Darkening of the Greenland ice sheet due to the
melt-albedo feedback observed at PROMICE weather stations
Dirk van As, Robert S. Fausto, William T. Colgan, Jason E. Box and the PROMICE project team*
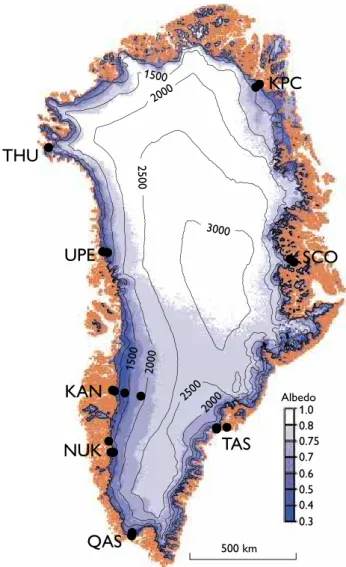
Fig. 1. Map of Greenland showing the locations of the 21 PROMICE weather stations in eight regions. The blue colours show mean satellite (MODIS) derived albedo for the months of June, July and August for 2008–2012. The contour lines show elevations (m) of the ice-sheet sur-face.
© 2013 GEUS. Geological Survey of Denmark and Greenland Bulletin 28, 69–72. Open access: www.geus.dk/publications/bull
*
Andreas P. Ahlstrøm, Signe B. Andersen, Morten L. Andersen, Charalampos Charalampidis, Michele Citterio, Karen Edelvang, Trine S. Jensen, Signe H. Larsen, Horst Machguth, Søren Nielsen, Martin Veicherts and Anker WeidickThe Greenland ice sheet is losing mass (Barletta et al. 2012)
and at least half of this loss is caused by an increase in surface
melt (e.g. Tedesco et al. 2013). The other part is caused by
increased dynamic mass loss, as marine-terminating glaciers
lose resistive stresses (Nick et al. 2009) due to both retreat
and meltwater lubrication at the bed (Sasgen et al. 2012).
In 2007, the Programme for Monitoring of the Greenland Ice Sheet (PROMICE) was initiated with the aim of gain-ing an insight into the causes of the ice-mass budget changes based on quantitative observations. This is primarily done by assessing how much mass is gained as snow accumulation on the surface versus how much is lost by calving and surface
ablation (Ahlstrøm et al. 2008). PROMICE monitors the
surface mass balance by means of automatic weather stations (AWSs) designed to quantify accumulation and ablation, as well as the specific energy sources contributing to ablation. These observations are vital to interpreting the physical mechanisms for ice-sheet response to climate change and for the calibration and validation of both satellite observations and climate models.
In the wake of several record-breaking warm summers –
increasing surface melt rate and extent (Nghiem et al. 2012)
– interest in Greenland’s surface mass balance has increased
(Tedesco et al. 2013). Observations of net ablation at
PROM-ICE stations provided in situ confirmation of extreme
mass-loss events in 2010 (Fausto et al. 2012) and 2012, primarily
documented by other workers through satellite data. In this paper, we present atmospheric temperatures and surface solar reflectivity (known as albedo) of the Greenland ice sheet in the PROMICE period. Albedo modulates the absorption of solar radiation, which is the primary source of melt energy. It is reported to be decreasing in Greenland in recent years (Box
et al. 2012), causing the monitoring of albedo variability to be increasingly important. Air temperatures, besides being strongly correlated to surface melt rates, affect surface albedo by controlling the rate of snow-grain metamorphism and the fraction of summer precipitation falling as rain versus snow. To elucidate the so-called melt-albedo feedback, whereby increased melt darkens the ice sheet and further enhances
melt, the relationship between albedo and air temperature, observed at PROMICE stations, is examined in this study.
1500
2000
2500
2000
0.8 1.0 Albedo
0.7 0.75
0.5 0.6
0.4 0.3
2500
2000
1500
KAN
SCO
UPE
THU
KPC
TAS
NUK
QAS
3000
70 70
PROMICE measurements
The original PROMICE network consisted of 14 AWSs in the regions Kronprins Christian Land (KPC), Scoresbysund (SCO), Tasiilaq (TAS), Qassimiut (QAS), Nuuk (NUK), Upernavik (UPE) and Thule (THU), each region monitored with a lower (L) and an upper (U) station in the ablation area (Fig. 1). PROMICE has both contributed to and received con-tributions from other projects in the Kangerlussuaq, Nuuk and Tasiilaq regions, leading to the installation of seven addi-tional stations. The PROMICE study regions were selected to best complement the spatial distribution of existing ice-sheet weather stations, such as in the Greenland Climate Network
(Steffen et al. 1996), by providing data from the
under-repre-sented ablation area (Ahlstrøm et al. 2008).
The PROMICE AWSs measure meteorological variables
including air temperature (at c. 2.7 m above the surface),
pres-sure and humidity, wind speed, downward and upward solar (shortwave) and terrestrial (longwave) radiation. The AWSs also record temperature profiles in the upper 10 m of the ice, GPS-derived location and diagnostic parameters such as sta-tion tilt angles. A pressure transducer and two sonic rangers measure snow and surface-height change associated with
ab-lation and accumuab-lation (Fausto et al. 2012). Most variables
are measured every ten minutes, with the data stored locally awaiting collection during maintenance visits. Hourly aver-ages of the most transient variables are transmitted via satellite between days 100 and 300 of each year, while the remaining variables are transmitted at six-hour intervals. Transmissions have a daily frequency in the remaining (winter) period. All data and metadata including sensor specifications are archived in the PROMICE database and made freely available for
dis-play and download at www.promice.dk.
In this study, we present monthly mean measurements of air temperature and surface albedo. To obtain the temperature averages, we first calculate daily mean air temperatures for all days in which data coverage of hourly mean values exceeds 80%. Subsequently, we calculate monthly mean air temperature for all months in which data coverage of daily mean values exceeds 24 days. To calculate surface albedo, we divide instantaneous values of upward shortwave radiation by the downward com-ponent before averaging. However, instrument tilt induces significant errors in the measurement of shortwave radiation
(van den Broeke et al. 2004), which is a common problem in
the ice-sheet ablation area due to irregular melting of the ice surface on which the AWS stands. Therefore we employ the tilt correction method as described by van As (2011) that uses the measured AWS tilt to correct downward shortwave radia-tion. In contrast to the temperature averaging, a minimum of one successful hourly mean albedo is sufficient to produce a daily mean, provided that the direct solar radiation (which
oc-curs when skies are not overcast) hits the upper dome of the radiometer at angles exceeding 30°, where measurements are more precise. The low sun angle in winter prevents calculation of albedo values.
Atmospheric temperature
All PROMICE sites record a distinct annual cycle in air perature (Fig. 2A). As is common for Arctic climates, tem-poral variability is largest in winter due to a more vigorous atmospheric circulation. The amplitude in the annual air tem-perature cycle is largest for stations at high latitudes or high elevations since above-freezing temperatures and thus a melt-ing ice surface capable of local thermo-regulation, are least common at these stations. The more northerly stations also show a larger annual temperature cycle due to the increasing contrast in the lengths of polar day and night with
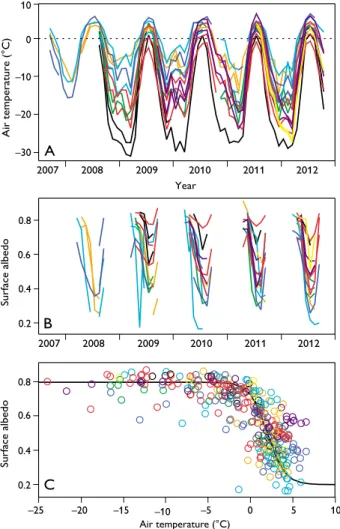
increas-Fig. 2. A: Monthly mean air temperatures at the 18 PROMICE sites
in-stalled on the ice sheet and before 2012. B: Same but for albedo. C: Albedo
versus temperature. Black lines: KPC stations, green: SCO, orange: TAS, light blue: QAS, dark blue: NUK, red: KAN, purple: UPE, yellow: THU.
Year 2008
2007 2009 2010 2011 2012
A
B
C 2008
2007 2009 2010 2011 2012
Air temperature (°C)
10
0
–10
–20
–30
Surface albedo
0.8
0.6
0.4
0.2
–25 –20 –15 –10 –5 0 5 10
Air temperature (°C)
Surface albedo
0.8
0.6
0.4
71
ing latitude. The smallest amplitude in the annual tempera-ture cycle is seen at QAS_L, the most southerly PROMICE site. Here, free-atmospheric temperatures can exceed 20°C, leading to strong melt. In 2010, the large heat content of the atmosphere, low summer albedo and anomalously low winter accumulation combined to yield a long net-ablation season and the largest ever recorded ablation in Greenland in a single
melt season (9 m of ice; Fausto et al. 2012).
As the greater part of mass loss by melt takes place dur-ing the summer, we calculated the four- or five-year trends in combined mean air temperature for the months of June, July and August, for eight stations with a sufficiently long cover-age. Given the relatively short PROMICE record length, these trends are not free from the influence of inter-annual, natural climatic variability and thus not climatological trends. The data show that at all except two sites the summers have be-come warmer over the PROMICE period. Most noteworthy
is that the warming is most pronounced (c. 0.6°C/year) at the
high latitude/elevation sites, where the influence of a melting ice surface is spatially and temporally limited. At the sites that experience the highest temperatures and strongest melt, inter-annual variability of free-atmospheric temperatures has had limited effect on air temperatures over the nearly permanently melting ice-sheet surface in summer.
The inter-annual temperature variability is shown in an anomaly plot (Fig. 3A). It is seen that 2010 was a warm year, especially in West Greenland, and mostly early and late in the year, with anomalies exceeding 5°C. The widespread and large
melt in 2012 (Nghiem et al. 2012) was the result of high
tem-peratures in July, as seen from positive air temperature anoma-lies at all PROMICE sites.
The record-warm years/summers of 2010 and 2012 (e.g.
Tedesco et al. 2013), following the warmest decade in
Green-land’s instrumental temperature record, are consistent with persistent warming observed globally, but are suggested to be a consequence of North Atlantic Oscillation variability
affect-ing atmospheric heat transport (Fettweis et al. 2013).
Atmo-spheric warming has been reported to be highest in South and West Greenland. This is confirmed by the PROMICE observations in West Greenland, but observations at KPC_U in north-eastern Greenland show a similar rate of short-term
warming. These observations provide in situ indications that
the atmospheric warming may be spatially pervasive.
Darkening ice-sheet surface
The surface albedo is generally high in the cold, snow-covered interior of the ice sheet (>0.75), and lower along the ice-sheet margin where melting occurs in summer (Fig. 1). In winter, the ice sheet is fully snow covered except where wind erosion
dominates. Depending on the location of each AWS in the ablation area, snow melt starts in April or May as seen from air temperatures and decreasing albedo (Fig. 2B). Thereaf-ter, albedo drops throughout the melt season until snowfall occurs in autumn, yielding a distinct annual cycle which is largest at the high-melt sites. Surface melt causes this annual darkening of the ice-sheet surface as snow undergoes heat-driven metamorphosis, or completely melts to expose darker bare ice. The ice-sheet surface may also darken as impurities collect on the ice surface or supraglacial meltwater-filled fea-tures become more abundant. We find that on average sur-face albedo drops below fresh snow values as monthly mean
temperatures exceed c. –2°C (Fig. 2C). The hyperbolic shape
of the scatter plot is primarily a consequence of the annual cycle in albedo (α) and can be approximated by
where T is near-surface air temperature and maximum (αmax)
and minimum albedo (αmin) are prescribed as 0.8 and 0.2,
respectively. T0 and C, taken as 2 and 1°C respectively, are
empirical constants characterising a melting point offset and the exponential scaling length of α(T).
Fig. 3. A: Monthly mean air temperature anomalies, i.e. after subtracting
the mean annual cycle for stations with data series spanning a minimum of three years. B: Albedo versus temperature anomalies plotted for months with mean temperatures exceeding –2°C in order to extract melt-season values only.
Year
–4 –2 0 2 4
Air temperature anomaly (°C)
Air temperature anomaly (°C)
5
0
–5
–10
Surface albedo anomaly
0.2
0
–0.4 –0.2
r = –0.59 A
B 2008
72 72
Though there are exceptions, taken as a whole the PROM-ICE data indicate that albedo has decreased over the past five years while temperature has increased. This is most notable at the higher-elevation sites; the lower sites are completely snow-free in every summer and thus exhibit little change. By calculating the temporal correlations between temperature and albedo for all individual stations for the months of June, July and August separately (minimum four-year time series), we isolate the inter-annual variability by eliminating the an-nual cycle. We observe 36 out of 39 correlation coefficients to be negative, implying a widespread association of tempera-ture-induced melt with surface albedo on the ice sheet. Mean correlation is strongest in June (–0.76 ± 0.28), followed by August (–0.54 ± 0.39) and July (–0.43 ± 0.45).
The surface albedo at most AWSs was relatively low in 2010 and 2012, coincident with the warm summers of the past years. In order to assess the impact of atmospheric warming on ice-sheet darkening at any given site on the Greenland ice sheet, we plot the albedo anomalies versus the temperature anomalies in Fig. 3B for monthly temperatures exceeding –2°C, hereby isolating the melt season. The cor-relation of –0.59 between the plotted variables is statistically significant. A linear fit yields that one degree of warming in the near-surface air temperature will lead to an average albe-do reduction of 0.043. This value is sensitive to the tempera-ture cut-off value (here taken at –2°C) and will become more accurate with longer AWS time series. Since the PROMICE stations measure close to the ice surface where temperature variability is dampened over a melting surface, a stronger correlation could be expected between albedo and local free-atmospheric temperatures, although the regions with low temperature variability are also associated with low albedo variability (Fig. 3B).
As mentioned, this darkening is likely due to an increase in surface melt, which cannot be linked to changes in solar radiation in recent years and thus may very well be directly and indirectly caused by changes in air temperature. Al-though absorbed solar radiation is the primary source of melt energy, the melt-albedo feedback is initiated by the energy fluxes that respond to changes in temperature, such as down-ward longwave radiation and the turbulent heat fluxes. Since both atmospheric warming and ice-sheet darkening increase surface melt intensity and melt area, the anticipated future warming will result in a self-reinforcing ice sheet mass-loss contribution from the melt-albedo feedback. While in-creased surface melt is a primary mechanism for ice loss in Greenland, an increase in meltwater may also enhance mass
loss due to ice dynamics, through processes such as basal lu-brication and warming of the ice matrix.
Acknowledgements
PROMICE is funded by the Danish Ministry of Climate, Energy and Building. The AWSs in the Kangerlussuaq region are funded by the Greenland Analogue Project, while partner AWSs in the Nuuk region are co-funded by the Greenland Climate Research Centre. Several other pro-jects also contributed to PROMICE.
References
Ahlstrøm, A.P. & the PROMICE project team 2008: A new programme for monitoring the mass loss of the Greenland ice sheet. Geological Sur-vey of Denmark and Greenland Bulletin 15, 61–64.
Barletta, V.R., Sørensen, L.S. & Forsberg, R. 2012: Variability of mass changes at basin scale for Greenland and Antarctica. The Cryosphere Discussions 6, 3397–3446.
Box, J.E., Fettweis, X., Stroeve, J.C., Tedesco, M., Hall, D.K. & Steffen, K. 2012: Greenland ice sheet albedo feedback: thermodynamics and atmo-spheric drivers. The Cryosphere 6, 821–839.
Fausto, R.S., van As, D. & the PROMICE project team 2012: Ablation observations for 2008–2011 from the Programme for Monitoring of the Greenland Ice Sheet (PROMICE). Geological Survey of Denmark and Greenland Bulletin 26, 73–76.
Fettweis, X., Hanna, E., Lang, C., Belleflamme, A., Erpicum, M. & Gallée, H. 2013: Important role of the mid-tropospheric atmospheric circulation in the recent surface melt increase over the Greenland ice sheet. The Cryosphere 7, 241–248.
Nghiem, S.V., Hall, D.K., Mote, T.L., Tedesco, M., Albert, M.R., Keegan, K., Shuman, C.A., DiGirolamo, N.E. & Neuman, G. 2012: The ex-treme melt across the Greenland ice sheet in 2012. Geophysical Re-search Letters 39, L20502, http://dx.doi.org/10.1029/2012GL053611. Nick, F.M., Vieli, A., Howat, I. & Joughin, I. 2009: Large-scale changes
in Greenland outlet glacier dynamics triggered at the terminus. Nature Geoscience 2, 110–114.
Sasgen, I., van den Broeke, M.R., Bamber, J.L., Rignot, E., Sørensen, S.L.S., Wouters, B., Martinec, Z., Velicogna, I. & Simonsen, S.B. 2012: Timing and origin of recent regional ice-mass loss in Greenland. Earth and Planetary Science Letters 333, 293–303.
Steffen, K., Box, J.E. & Abdalati, W. 1996: Greenland climate network: GC-Net. In: Colbeck, S.C. (ed.): Glaciers, ice sheets and volcanoes: a tribute to Mark F. Meier. CRREL Special Report 96-27, 98–103. Tedesco, M., Fettweis, X., Mote, T., Wahr, J., Alexander, P., Box, J. &
Wouters, B. 2013: Evidence and analysis of 2012 Greenland records from spaceborne observations, a regional climate model and reanalysis data. The Cryosphere 7, 615–630.
van As, D. 2011: Warming, glacier melt and surface energy budget from weather station observations in the Melville Bay region of northwest Greenland. Journal of Glaciology 57(202), 208–220.
van den Broeke, M., van As, D., Reijmer, C. & van de Wal, R. 2004: As-sessing and improving the quality of unattended radiation observations in Antarctica. Journal of Atmospheric and Oceanic Technology 21,
1417–1431.
Authors’ address