Electronic Journal of Plant Breeding, 4(1): 1093-1096 (Mar 2013) ISSN 0975-928X
http://sites.google.com/site/ejplantbreeding 1093
Research Note
Variability and association studies for yield and yield components in
upland cotton (
Gossypium hirsutum
L.) under red chalka soils
P.J.M.Rao and M.Gopinath
Acharya N.G.Ranga Agricultural University, Regional Agricultural Research Station: Warangal - 506 007
(Received: 08 Dec 2012; Accepted: 10 Jan 2013)
Abstract
Studies conducted with 60 cotton genotypes for yield components and fibre quality traits under red chalka soil revealed high genotypic coefficient of variation and genetic gain for number of bolls, boll weight, ginning out turn, lint yield and seed cotton yield and these traits could be improved by simple selection. Correlation and path analysis studies revealed that seed cotton yield is highly influenced by lint yield. Significant positive association exists between number of bolls per plant, boll weight, ginning out turn, bundle strength, lint yield and seed cotton yield. Lint yield registered high order positive direct effect on seed yield. The present study signified the importance of number of bolls per plant , boll weight along with lint yield for overall improvement of seed cotton yield.
Key words:
Cotton, correlation coefficient, path analysis, fibre quality
Cotton is one of the most important cash crops in India. The cotton production of the country is high but the productivity is still lower than that of other countries. Cotton is predominantly grown in black soils, but in peninsular India, especially in Andhra Pradesh, other crops being not equally remunerative to that of cotton, cotton is grown in considerable area in red Chalka soils also. These soils have low water holding capacity, in seasons of low precipitation, cotton crop is exposed to frequent droughts and thus low yields are being realised. Keeping in view, the ample scope to sustain productivity in this cropping pattern, the present investigation has been undertaken with 60 genotypes of Gossypium hirsutum in red chalka soil to assess and to understand the degree and direction of association of various traits with seed cotton yield and to study the direct and indirect contribution of different traits to seed cotton yield.
The experimental material consists of 60 genotypes received under All India Coordinated Research Improvement Project in Cotton. The experiment was conducted in Randomized Block Design with three replications at Gorrekunta Farm, Regional Agricultural Research Station, Warangal during kharif 2010. The inter and intra row spacing adopted was 90 x 60 cm. Each plot consisted of one row of 6 meter length. Recommended package of practices and plant protection measures were adopted to raise a good crop. Observations were recorded on five randomly selected plants from each genotype per replication for Number of bolls per plant, Boll weight (g), Lint yield per plant (g) and Seed cotton yield per plant (g), where as Ginning Out Turn (%), 2.5% Span length (mm), Micronaire (10-6 g/in), Bundle strength (g/tex), Uniformity ratio and Fibre elongation (%) were recorded on plot basis.
The fibre quality characters were analysed at CIRCOT, Regional Unit, Lam, Guntur.
The mean value of all the biometrical traits were taken for statistical analysis. From mean values. Variability parameters were computed using standard statistical procedures as per Johnson et al.
(1955). Genotypic and phenotypic correlation coefficients were estimated as per Falconer (1964) and path coefficient analysis was also done (Dewey and Lu, 1959).
Electronic Journal of Plant Breeding, 4(1): 1093-1096 (Mar 2013) ISSN 0975-928X
http://sites.google.com/site/ejplantbreeding 1094
Correlation studies: Correlation coefficient studies revealed that genotypic correlation coefficient values in general were higher than phenotypic values. Genotypic correlation coefficients are given in Table 2. Number of bolls per plant, boll weight, ginning out turn, bundle strength and lint yield per plant showed significant positive correlation with seed cotton yield. Similar results were reported by Tuteja et al., (2006), Leela Pratap et al., (2007), Vijayalaxmi et al.,(2008) and Srinivasulu et al.,(2010). The association between span length, micronaire uniformity ratio, fibre elongation and seed cotton yield was non significant. Number of bolls per plant had positive association with lint yield per plant (Dedaniya and Pethani, 1994). Boll weight showed significant positive association with lint yield and micronaire. Similar observations were reported by Murthy et al., (2006). 2.5% span length showed significant positive association with bundle strength and micronaire. Micronaire value showed positive significant association with uniformity ratio and lint yield. These findings are in accordance with that of Padmavathi (2008). The correlation analysis revealed that the number of bolls, boll weight and lint yield should be given due weightage in selection process for seed cotton yield improvement.
Path analysis: Path coefficient analysis (Table 3& 4) revealed that lint yield per plant recorded high order positive direct effect on seed cotton yield followed by boll weight and number of bolls per plant. Similar results were reported by Leela Pratap et al., (2007). Moderate positive direct effects on seed cotton yield was expressed by ginning out turn, span length and micronaire. Whereas characters viz., bundle strength, uniformity ratio and fibre elongation registered negative direct effect on seed cotton yield. Similar results were reported by Padmavathi (2008) for ginning out turn and fibre elongation.
In the present study, the association and path coefficients revealed that major emphasis should be given to yield traits such as number of bolls per plant and boll weight along with lint yield
balancing with other quality traits for overall improvement of seed cotton yield.
References
Dewey, D.R. and Lu, K. H. 1959. A correlation and path coefficient analysis of components of crested wheat grass seed production Agron. J.,51(9): 515-518.
Dedaniya, A. D. and Pethani, K. V. 1994. Genetic variability, correlation and path analysis in desi cotton (G. arboreum L.). Indian J. of Genet. 5(3):229-234.
Falconer, D. S. 1964. An introduction to quantitative genetics, Oliver and Boyd, Edinburg, London, pp. 312-324.
Johnson, H. W., Robinson, H. F. and Comstock, R. E. 1955. Estimates of genetic and environmental variability in soybean. Agron. J.,47: 314-318. Leela Pratap, K., Chenga Reddy,V. Ramakumar, P.V.
and Srinivasa Rao, V. 2007. Correlation and path coefficient analysis for yield and yield components traits in cotton (Gossypium hirsutum L.). The Andhra Agric. J., 54(1&2): 31-35.
Murthy, J.S.V.S., Chamundeshwari, N. and Udayasree, P. 2006. Assessment of genetic variability and relationship of yield attributes in introgressed lines of American cotton. The Andhra Agric.J.,
53(3&4):129-132.
Padmavathi, A. 2008. Characterization of cotton germplasm (G hirsutum L.) M.Sc (Ag) thesis submitted to, Acharya N.G.Ranga Agril Univeristy, Rajendranagar, Hyderabad. Srinivasulu, P., Sambamurthy, J.S.V., Ramakumar, P. V.
Srinivasa Rao,V. 2010. Character Association and Path Coefficient Analyses for yield and Yield components traits in upland cotton (Gossypium hirsutum L.). The Andhra Agric. J., 57 (1):69-74.
Tuteja, O. P., Sunil Kumar and Mahendar Singh. 2006. Selection parameters and yield enhancement of upland cotton (G.hirsutum L.) under irrigated ecosystem of North India. Indian J of Agric. Sci.,76(2): 77-80.
Vijayalaxmi, G. Chenga Reddy, V., Panduranga Rao, C., Satish Babu, J. and Srinivasulu, R. 2008. Character association and path coefficient analysis in cotton (G hirsutum L.). The Andhra Agric. J.,55(2): 156-160.
Electronic Journal of Plant Breeding, 4(1): 1093-1096 (Mar 2013) ISSN 0975-928X
http://sites.google.com/site/ejplantbreeding 1095
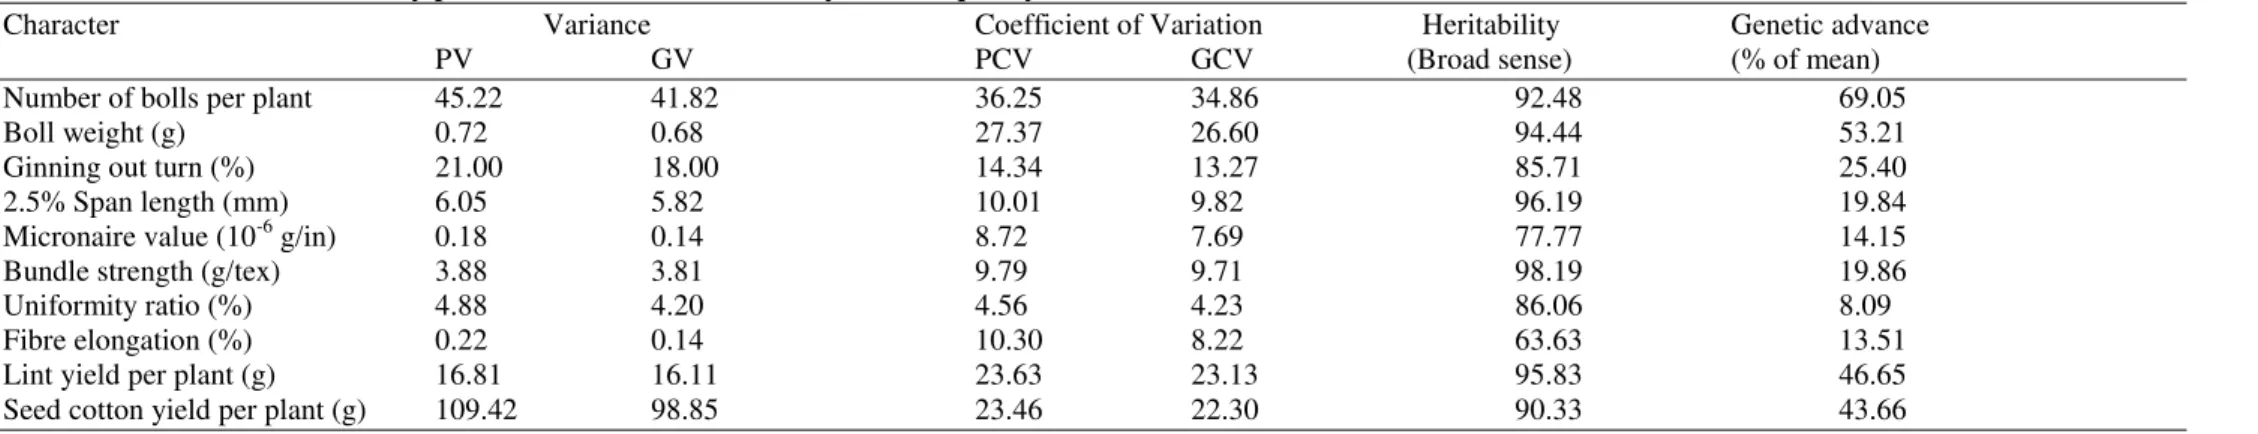
Table 1. Estimates of variability parameters in G. hirsutum for yield and quality traits
Character Variance Coefficient of Variation Heritability Genetic advance
PV GV PCV GCV (Broad sense) (% of mean)
Number of bolls per plant 45.22 41.82 36.25 34.86 92.48 69.05
Boll weight (g) 0.72 0.68 27.37 26.60 94.44 53.21
Ginning out turn (%) 21.00 18.00 14.34 13.27 85.71 25.40
2.5% Span length (mm) 6.05 5.82 10.01 9.82 96.19 19.84
Micronaire value (10-6 g/in) 0.18 0.14 8.72 7.69 77.77 14.15
Bundle strength (g/tex) 3.88 3.81 9.79 9.71 98.19 19.86
Uniformity ratio (%) 4.88 4.20 4.56 4.23 86.06 8.09
Fibre elongation (%) 0.22 0.14 10.30 8.22 63.63 13.51
Lint yield per plant (g) 16.81 16.11 23.63 23.13 95.83 46.65
Seed cotton yield per plant (g) 109.42 98.85 23.46 22.30 90.33 43.66
PV-Phenotypic variance: GV-Genotypic variance: PCV-Phenotypic coefficient of variation: GCV-Genotypic coefficient of variation.
Table 2. Genotypic correlation coefficient for different character pairs of Gossypium hirsutum genotypes
Character BW GOT 2.5%SL Micronaire BS UR FE LYP SCYP
NBPP -0.15 0.10 0.20 0.19 0.26 -0.20 -0.08 0.28** 0.292**
BW -0.26** 0.02 0.36** -0.16 0.10 -0.07 0.28** 0.802**
GOT -0.04 0.18 -0.11 0.05 0.08 0.43** 0.425**
2.5%SL 0.32** 0.39** 0.03 -0.12 0.14 0.066
Micronaire -0.16 0.32** 0.15 0.18* 0.185
BS -0.19** -0.20** 0.35** 0.328**
UR 0.71** 0.12 0.181
FE 0.07 0.044
LYP 0.922**
NBPP- Number of bolls per plant;BW-Boll weight (g); GOT-Ginning out turn (%);SL-2.5% Span length (mm); BS-Bundle strength (g/tex); UR-Uniformity ratio (%); Fe-Fibre elongation (%); LYP-Lint yield per plant (g); SCYP-Seed cotton yield per plant (g)
Electronic Journal of Plant Breeding, 4(1): 1093-1096 (Mar 2013) ISSN 0975-928X
http://sites.google.com/site/ejplantbreeding 1096
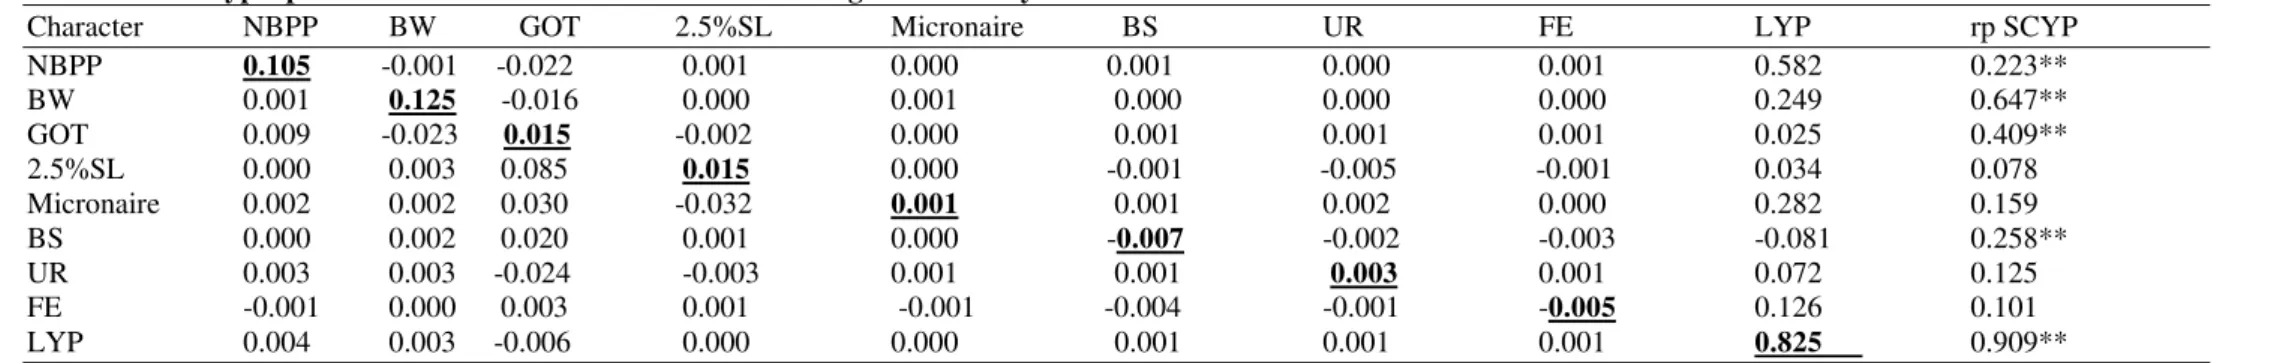
Table 3. Phenotypic path coefficients of various traits influencing seed cotton yield
Character NBPP BW GOT 2.5%SL Micronaire BS UR FE LYP rp SCYP
NBPP 0.105 -0.001 -0.022 0.001 0.000 0.001 0.000 0.001 0.582 0.223**
BW 0.001 0.125 -0.016 0.000 0.001 0.000 0.000 0.000 0.249 0.647** GOT 0.009 -0.023 0.015 -0.002 0.000 0.001 0.001 0.001 0.025 0.409** 2.5%SL 0.000 0.003 0.085 0.015 0.000 -0.001 -0.005 -0.001 0.034 0.078
Micronaire 0.002 0.002 0.030 -0.032 0.001 0.001 0.002 0.000 0.282 0.159
BS 0.000 0.002 0.020 0.001 0.000 -0.007 -0.002 -0.003 -0.081 0.258**
UR 0.003 0.003 -0.024 -0.003 0.001 0.001 0.003 0.001 0.072 0.125
FE -0.001 0.000 0.003 0.001 -0.001 -0.004 -0.001 -0.005 0.126 0.101
LYP 0.004 0.003 -0.006 0.000 0.000 0.001 0.001 0.001 0.825 0.909**
NBPP- Number of bolls per plant;BW-Boll weight (g); GOT-Ginning out turn (%);SL-2.5% Span length (mm); BS-Bundle strength (g/tex); UR-Uniformity ratio (%); Fe-Fibre elongation (%); LYP-Lint yield per plant (g); SCYP-Seed cotton yield per plant (g)
*,** significant at 5% and 1% respectively
Table 4. Genotypic path coefficients of various traits influencing seed cotton yield
Character NBPP BW GOT 2.5%SL Micronaire BS UR FE LYP rg SCYP
NBPP 0.325 -0.014 -0.016 0.006 0.020 -0.012 0.001 0.014 0.549 0.292**
BW -0.022 0.429 -0.028 0.002 0.009 0.008 0.002 0.001 0.252 0.802**
GOT -0.031 -0.041 0.056 -0.003 0.008 -0.003 0.000 0.005 -0.027 0.425**
2.5%SL 0.012 0.012 -0.042 0.045 -0.031 0.019 -0.003 -0.001 0.002 0.066
Micronaire 0.112 0.042 0.029 -0.031 0.040 -0.012 0.002 0.010 0.250 0.185
BS -0.072 0.043 -0.010 0.014 -0.018 -0.029 -0.001 -0.042 -0.102 0.328**
UR 0.017 0.008 0.032 -0.031 0.038 0.016 0.009 0.015 0.087 0.181
FE -0.001 -0.006 -0.010 0.006 -0.004 0.044 -0.002 -0.028 0.142 0.044
LYP 0.312 0.080 -0.019 0.001 0.022 -0.002 0.000 0.018 0.669 0.922**
NBPP- Number of bolls per plant;BW-Boll weight (g); GOT-Ginning out turn (%);SL-2.5% Span length (mm); BS-Bundle strength (g/tex); UR-Uniformity ratio (%); Fe-Fibre elongation (%); LYP-Lint yield per plant (g); SCYP-Seed cotton yield per plant (g); rg-genotypic correlation