HESSD
9, 5931–5953, 2012Downscaling ERA-Interim temperature data in
complex terrain
L. Gao et al.
Title Page
Abstract Introduction
Conclusions References
Tables Figures
◭ ◮
◭ ◮
Back Close
Full Screen / Esc
Printer-friendly Version Interactive Discussion
Discussion
P
a
per
|
Dis
cussion
P
a
per
|
Discussion
P
a
per
|
Discussio
n
P
a
per
|
Hydrol. Earth Syst. Sci. Discuss., 9, 5931–5953, 2012 www.hydrol-earth-syst-sci-discuss.net/9/5931/2012/ doi:10.5194/hessd-9-5931-2012
© Author(s) 2012. CC Attribution 3.0 License.
Hydrology and Earth System Sciences Discussions
This discussion paper is/has been under review for the journal Hydrology and Earth System Sciences (HESS). Please refer to the corresponding final paper in HESS if available.
Downscaling ERA-Interim temperature
data in complex terrain
L. Gao, M. Bernhardt, and K. Schulz
Department of Geography, Ludwig-Maximilians-Universit ¨at M ¨unchen, Munich, Germany
Received: 27 March 2012 – Accepted: 6 April 2012 – Published: 9 May 2012
Correspondence to: M. Bernhardt ([email protected])
HESSD
9, 5931–5953, 2012Downscaling ERA-Interim temperature data in
complex terrain
L. Gao et al.
Title Page
Abstract Introduction
Conclusions References
Tables Figures
◭ ◮
◭ ◮
Back Close
Full Screen / Esc
Printer-friendly Version Interactive Discussion
Discussion
P
a
per
|
Dis
cussion
P
a
per
|
Discussion
P
a
per
|
Discussio
n
P
a
per
|
Abstract
Air temperature controls a large variety of environmental processes, and is an essen-tial input parameter for land surface models e.g. in hydrology, ecology and climatology. However, meteorological networks, which can provide the necessary information, are commonly sparse in complex terrains, especially in high mountainous regions. In or-5
der to provide temperature data in an adequate temporal and spatial resolution for local scale applications, we have developed a new downscaling method able to scale 3-hourly ERA-Interim temperature data. The scheme is based on model internal ver-tical lapse rates derived from different ERA-Interim pressure levels. The results are validated for three meteorological stations, located within the same ERA-Interim grid 10
element: Zugspitze, Garmisch-Partenkirchen and Zugspitzplatt, in the German Alps; they are also compared with two other statistical, lapse rate based downscaling ap-proaches. The results indicate that the use of model internal ERA-Interim lapse rates can significantly improve the downscaling performance when compared to the standard procedure of using fixed lapse rates.
15
1 Introduction
The surface air temperature (Ta) is an important control for a large variety of environ-mental processes and influences the local as well as the global water, energy and matter cycle (Prince et al., 1998; Prihodko and Goward, 1997; Bolstad et al., 1998). Changes in Ta have a distinct influence on biogeochemical processes, the turbulent
20
HESSD
9, 5931–5953, 2012Downscaling ERA-Interim temperature data in
complex terrain
L. Gao et al.
Title Page
Abstract Introduction
Conclusions References
Tables Figures
◭ ◮
◭ ◮
Back Close
Full Screen / Esc
Printer-friendly Version Interactive Discussion
Discussion
P
a
per
|
Dis
cussion
P
a
per
|
Discussion
P
a
per
|
Discussio
n
P
a
per
|
reliable data for decision-makers (e.g. tourism planning) and model developers (Dod-son and Marks, 1997; Minder et al., 2010; Maurer et al., 2002; Mooney et al., 2011).
The most common sources forTatime series are meteorological stations. However, meteorological networks are sparse in complex terrains, in particular at high altitudes, such as in mountains. This is mainly due to difficulties with the installation and mainte-5
nance of the stations (Kunkel, 1989; Rolland, 2003). Hence, information aboutTahas to be calculated on the basis of surrounding stations, which are usually far away from the point of interest. TheTacan also be calculated with the help of climate models, which usually have a limited spatial resolution (Dodson and Marks, 1997; Vicente-Serrano et al., 2003; Ishida and Kawashima, 1993). Both methods tend to work well in homoge-10
neous terrains, but tend to fail in heterogeneous terrains, where changes in the surface temperature can occur over short distances. Reasons for failure are the misrepresen-tations of key relationships betweenTa and elevation (DeGaetano and Belcher, 2007) and the limitations of climate models to consider small-scale variations of the land surface.
15
Hence, lapse rates (Γ), which display the empirical relationship between Taand al-titude are often used to interpolate measurements or to scale model results ofTawith respect to elevation as well as for generating the required small-scale information ofTa. The most common methods typically assume lapse rates in the range of
−6.0◦C km−1(e.g. Dodson and Marks, 1997) to−6.5◦C km−1(e.g. Maurer et al., 2002;
20
Lundquist and Cayan, 2007; Stahl et al., 2006) and assuming some similarity to the the-oretical pseudo adiabatic lapse rate (Hamlet and Lettenmaier, 2005) or to the monthly variability of the temperature gradient within the atmosphere (Kunkel, 1989; Liston and Elder, 2006). However, many studies have proven that a fixed lapse rate may be prob-lematic since the values of the lapse rate can vary significantly within short time periods 25
HESSD
9, 5931–5953, 2012Downscaling ERA-Interim temperature data in
complex terrain
L. Gao et al.
Title Page
Abstract Introduction
Conclusions References
Tables Figures
◭ ◮
◭ ◮
Back Close
Full Screen / Esc
Printer-friendly Version Interactive Discussion
Discussion
P
a
per
|
Dis
cussion
P
a
per
|
Discussion
P
a
per
|
Discussio
n
P
a
per
|
to the incoming radiation (Rolland, 2003; Blandford et al., 2008) and diurnal variations, e.g. due to a changing cloud cover (Minder et al., 2010). This lapse rate variability can only be monitored by dense meteorological station networks or by using alternative strategies that are able to cover the temporal and spatial variability of air temperature.
We here present a newly developed statistical downscaling (SD) approach that is 5
based on the European Centre for Medium Range Weather Forecast (ECMWF) re-analysis product ERA-Interim (Dee et al., 2011; Berrisford et al., 2011). The method accounts for the temporal variability of lapse rates by using model internal tempera-ture profiles and is therefore independent of local station measurements. It allows for a scaling of 0.25◦ results to the point scale and is tested and validated against two
10
different, standard SD methods (one based on station measurements, and another one that uses fixed data from literature) at three meteorological stations located in a mountainous environment in southern Germany.
2 Data and methods
2.1 ERA-Interim data
15
We make use of the European Centre for Medium Range Weather Forecast (ECMWF) reanalysis product ERA-Interim, which provides data from 1979 onwards, and contin-ues in real time (Berrisford et al., 2009; Dee et al., 2011). The ERA-Interim project was launched in order to improve key aspects of ERA-40, such as the representation of the hydrological cycle, the quality of the stratospheric circulation, as well as the handling 20
of biases and changes in the observing system (Dee and Uppala, 2009; Simmons et al., 2006; Uppala et al., 2008; Dee et al., 2011). This has been achieved by including many model improvements, as the use of 4-dimensional variation analysis, a revised humidity analysis, the use of variation bias correction for satellite data, and other im-provements in data handling (Berrisford et al., 2009; Dee et al., 2011). Cycle 31r2 of 25
HESSD
9, 5931–5953, 2012Downscaling ERA-Interim temperature data in
complex terrain
L. Gao et al.
Title Page
Abstract Introduction
Conclusions References
Tables Figures
◭ ◮
◭ ◮
Back Close
Full Screen / Esc
Printer-friendly Version Interactive Discussion
Discussion
P
a
per
|
Dis
cussion
P
a
per
|
Discussion
P
a
per
|
Discussio
n
P
a
per
|
model in this configuration comprises 60 vertical levels, with the top level at 0.1 hPa; it uses the T255 spectral harmonic representation for the basic dynamical fields and a reduced Gaussian grid (N128) with an approximately uniform spacing of 79 km (Dee et al., 2011; Uppala et al., 2008). The atmospheric component is coupled to an ocean-wave model resolving 30 ocean-wave frequencies and 24 ocean-wave directions at the nodes of its 5
reduced 1◦
×1◦ latitude/longitude grid. ERA-Interim assimilates four analyses per day
at 00:00, 06:00, 12:00 and 18:00 UTC. Furthermore, two 10-day forecasts with a 3-h resolution are initialized on the basis of the 00:00 and 12:00 UTC analyses (Dee et al., 2011; Uppala et al., 2008).
Here, we apply 3-hourly forecast data (03:00, 06:00, 09:00, 12:00, 15:00, 18:00, 10
21:00 and 24:00 UTC) initialized at 00:00 UTC from 1979–2010 which are projected on a grid of 0.25◦
×0.25◦. This grid is interpolated from the original reduced Gaussian grid.
The used output variables are 2 m temperature, surface pressure, as well as temper-ature and geopotential height at 925 mb, 850 mb and 700 mb levels. The geopotential height is related to the variation of gravity with latitude and elevation, and is calculated 15
by the normalization of the geopotential over the gravity.
2.2 Test site
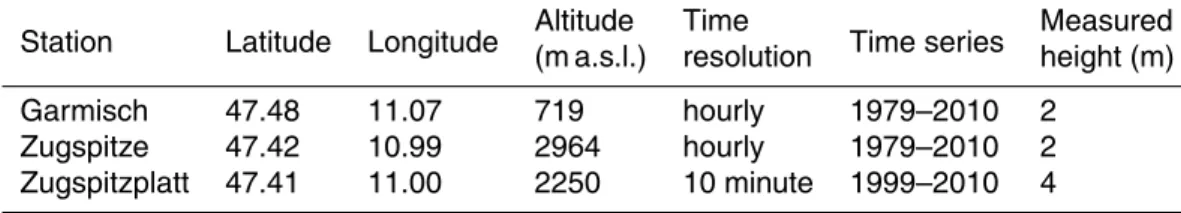
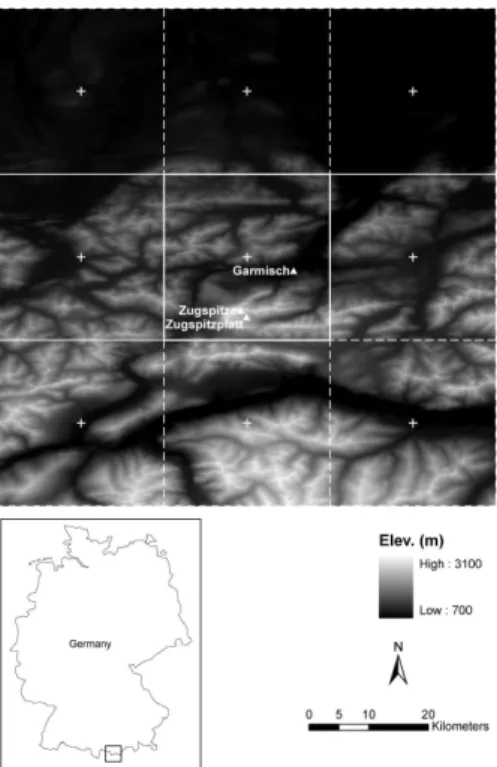
The test site is located in the southern part of Germany, at the frontier to Austria. It is centered at about 11.03◦E and 47.27◦N and stretches from 708 m a.s.l. at Garmisch
Partenkirchen to 2962 m a.s.l. at the Zugspitze summit (Fig. 1). The three meteoro-20
logical stations used in this research are located at the valley bottom (Garmisch-Partenkirchen 719 m a.s.l.), at the crest of the Zugspitze mountain (2964 m a.s.l.) and at the Zugspitzplatt (2250 m a.s.l.). The first two are operated by the German weather service (DWD), the third by the Bavarian Avalanche Warning service (LWD). The DWD provides hourly data, while the LWD is operating at 10-minute resolution (Table 1). The 25
HESSD
9, 5931–5953, 2012Downscaling ERA-Interim temperature data in
complex terrain
L. Gao et al.
Title Page
Abstract Introduction
Conclusions References
Tables Figures
◭ ◮
◭ ◮
Back Close
Full Screen / Esc
Printer-friendly Version Interactive Discussion
Discussion
P
a
per
|
Dis
cussion
P
a
per
|
Discussion
P
a
per
|
Discussio
n
P
a
per
|
Zugspitzplatt). The location of the used ERA-Interim 0.25◦ grid element is illustrated
in Fig. 1.
2.3 Downscaling methods
Lapse rates (Γ) describe the decrease of Ta with elevation. Equation (1) was used for all of the four presented downscaling methods, but the calculation of Tref and Γ
5
varied.Trefwas the reference temperature, which was either defined by the ERA-Interim 2 m temperature (TERA
2 m) or the ERA-Interim temperature at the 850 mb pressure level (TERA
pl).
Tt=Tref+ Γ×∆h (1)
We used three different methods for calculating Γ, Method I specific monthly lapse 10
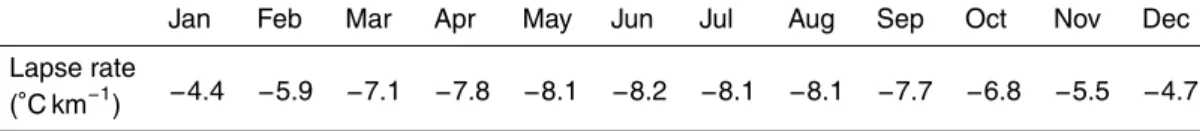
rates (ΓS) extracted from literature, Method II measured lapse rates (ΓM), which were calculated on the basis of the meteorological stations Zugspitze and Garmisch, and Method III ERA-Interim lapse rates (ΓE1 and ΓE2 s/ΓE2 fa) which were calculated on the basis of temperatures at different pressure levels. Method I made use of monthly values ofΓS published by Kunkel (1989) and Liston and Elder (2006) (Table 2). These values 15
are widely applied in earth surface modeling and their temporal resolution of one month can be seen as a standard with respect to generalized lapse rates (Bernhardt and Schulz, 2010; Mernild et al., 2009; Liston et al., 2008).
Method II used measured data from the meteorological stations Zugspitze and Garmisch for calculating 3-hourly lapse rates. Both stations covered a vertical gradi-20
ent of more than 2000 m and represented an optimal but rather unusual station setup for alpine regions. Therefore, Method II was used as a benchmark to compare the other methods to. Since stations at high elevation that are able to properly represent the me-teorology in high mountains are rare, other downscaling methods that are independent of surface measurements have to be developed (Blandford et al., 2008; Pages and 25
HESSD
9, 5931–5953, 2012Downscaling ERA-Interim temperature data in
complex terrain
L. Gao et al.
Title Page
Abstract Introduction
Conclusions References
Tables Figures
◭ ◮
◭ ◮
Back Close
Full Screen / Esc
Printer-friendly Version Interactive Discussion
Discussion
P
a
per
|
Dis
cussion
P
a
per
|
Discussion
P
a
per
|
Discussio
n
P
a
per
|
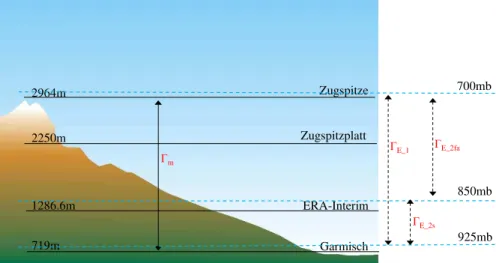
In the following, we introduce two methods, which are based on ERA-Interim internal temperature gradients for addressing this need. Temperatures as well as the geopo-tential heights of the 925 mb and 700 mb level were used for calculatingΓE1.ΓE2 s and
ΓE2 fa on the basis of temperature differences between the 925 mb and 850 mb (ΓE2 s) level and the 850 mb and 700 mb (ΓE
2 fa) level (Fig. 2). 5
A differentiation intoΓE2 s andΓE2 fa was introduced to accommodate for different at-mospheric conditions and therefore dominant controls on surface temperature. While low altitudes are often influenced by local circulation patterns (represented by ΓE
2 s), temperature conditions at higher elevations (represented byΓE2 fa) are more represen-tative to free air flow conditions (Mahrt et al., 2001). Tabony (1985) noted that the 10
transition from local circulation dominated, to free air dominated temperatures can be found at approximately 1400 m a.s.l. in the Austrian Alps. For our test site, the 850 mb level varying around 1500 m a.s.l., was used as a transition level dividing the local cir-culation dominated zone, from the free air flow dominated zone. Figure 2 illustrates the different parameters used in Eq. (1). Method III usedTERA
2 m andΓE1 for the calculation 15
of the temperature at Garmisch station andTERA
pl andΓE1 for Zugspitze and Zugspitz-platt stations. In Method IV,TERA
2 m andΓE2 s are the basis for the calculation of Ta at the Garmisch station andTERA
pl andΓE2 fa for Zugspitze and Zugspitzplatt stations. In order to evaluate the presented downscaling methods, three statistical accuracy measures were used: the root mean square error (RMSE), the mean absolute error 20
(MAE) and the Nash-Sutcliffe efficiency coefficient (NSE) (Nash and Sutcliffe, 1970).
3 Results
3.1 Comparison of ERA-Interim 2 m temperature and local measurements
As a first step, we compared the original 0.25◦, 3-hourly results of ERA-Interim with
measurements of Garmisch, Zugspitze and Zugspitzplatt stations (Fig. 3, Table 3). A 25
HESSD
9, 5931–5953, 2012Downscaling ERA-Interim temperature data in
complex terrain
L. Gao et al.
Title Page
Abstract Introduction
Conclusions References
Tables Figures
◭ ◮
◭ ◮
Back Close
Full Screen / Esc
Printer-friendly Version Interactive Discussion
Discussion
P
a
per
|
Dis
cussion
P
a
per
|
Discussion
P
a
per
|
Discussio
n
P
a
per
|
ERA-Interim and measurements, especially for the higher elevated stations. This is not surprising, given the differences in elevation between sites (see Table 1) and the average pixel elevation (1286.6 m) used by the ERA-Interim model.
The most significant difference between TERA
2 m and
T measured was found for Zugspitze station. The relatively small elevation difference between the Garmisch sta-5
tion and ERA-Interim average grid elevation resulted in the smallest bias.
3.2 Temporal variability of the lapse rates
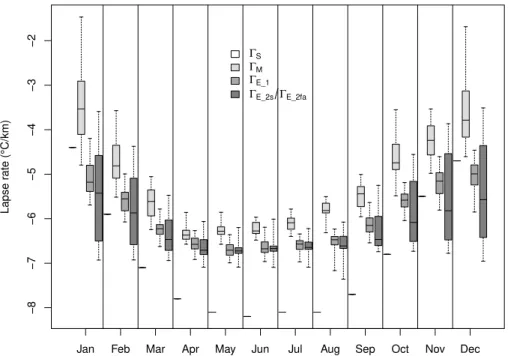
The derived lapse rates (ΓS,ΓM,ΓE1andΓE2 s/ΓE2 fa) showed a different annual variabil-ity. Figure 4 illustrates the seasonal dynamics of measured and modeled lapse rates as well as those obtained from the literature. The latter ones did not show any inter-10
monthly variability as they were defined as a single value per month. It can be seen that the negative lapse rates was generally smaller in winter but showed a higher variability during these colder months (October to February). Warmer months were characterized by lapse rates in the range of−6◦C km−1to−7◦C km−1and by a low inter-monthly
vari-ability (April–August). March and September represent transition months, where the 15
regime changed from winter to summer or from summer to winter conditions.ΓS gen-erally represented the largest temperature gradient and was significantly different from the measurements especially during the summer months.ΓE
1 andΓE2s/ΓE2fashowed larger variations during winter time, similar to the dynamics of the measurements (ΓM). The overall difference between measured and modeled lapse rates was small in sum-20
mertime (June–August) and showed stronger deviations in winter time (November– February), possibly due to frequent local inversion events during winter months at the Garmisch station that cannot be reproduced by the ERA-Interim model.
3.3 Evaluation of downscaling methods
The overall performance of the four downscaling methods with respect to 3-hourly tem-25
HESSD
9, 5931–5953, 2012Downscaling ERA-Interim temperature data in
complex terrain
L. Gao et al.
Title Page
Abstract Introduction
Conclusions References
Tables Figures
◭ ◮
◭ ◮
Back Close
Full Screen / Esc
Printer-friendly Version Interactive Discussion
Discussion
P
a
per
|
Dis
cussion
P
a
per
|
Discussion
P
a
per
|
Discussio
n
P
a
per
|
and tended to underestimate the temperature at Zugspitze and Zugspitzplatt (Fig. 5a, b, c). The RMSE and MAE for the prediction of Zugspitze data could be reduced by approx. 54 % and 62 % and by approx. 27 % and 36 % with respect to Zugspitzplatt when compared to the original ERA-Interim data (Fig. 3). However, the absolute error values for Method I was still high (Fig. 5b and c). The Nash Sutcliff coefficient could 5
also be improved (0.91 for Garmisch, 0.59 for Zugspitze and 0.71 for Zugspitzplatt), but is still low for the two stations located in higher elevations. Method II outperforms the other methods with respect to Garmisch station (Fig. 5d). However, the original ERA-Interim results for Garmisch still fit very well to the measurements (Fig. 3), and the overall improvement was comparably small for all of the methods used.
10
The downscaling results for the two high altitude stations could be significantly im-proved by Methods II, III and IV. Method III performed especially well for Zugspitze station (NSE of 0.96, RMSE of 1.45 and MAE of 1.12) (Fig. 5h), where the RMSE was reduced by 85 % and the MAE by 88 % when compared to the original ERA-Interim results. Methods III and IV performed almost as well as our benchmark method (II), 15
with particular good results for the Zugspitzplatt station. This behavior is extremely en-couraging as both methods (III and IV) are independent of local measurement stations and are therefore applicable for wide parts of the world.
Figure 6 illustrates the performance of all 4 methods with respect to daily average temperatures. While the accuracy of the downscaling results is similar when compared 20
to the use of 3-hourly data, some additional interesting aspects can be analyzed for the aggregated data. For example, daily averages as well as daily minima and maxima temperature data are often used for characterizing local sites given current or predicted future climate conditions. The extrapolation of the original ERA-Interim data or of data downscaled using Method I would therefore lead to a systematic misinterpretation of 25
HESSD
9, 5931–5953, 2012Downscaling ERA-Interim temperature data in
complex terrain
L. Gao et al.
Title Page
Abstract Introduction
Conclusions References
Tables Figures
◭ ◮
◭ ◮
Back Close
Full Screen / Esc
Printer-friendly Version Interactive Discussion
Discussion
P
a
per
|
Dis
cussion
P
a
per
|
Discussion
P
a
per
|
Discussio
n
P
a
per
|
which are only oriented on a theoretical adiabatic temperature gradient, but which do not factor in the local characteristics of a specific site.
4 Conclusions
3-hourly and daily ERA-Interim 2 m temperature data were first compared with mea-surements at Zugspitze, Garmisch-Partenkirchen and Zugspitzplatt in the German 5
Alps, all located within the same ERA-interim grid element. This comparison illustrated the necessity to downscale ERA-Interim data based on temperature lapse rates in or-der to account for elevation driven temperature variations in heterogeneous mountain regions that cannot be represented by a grid average ERA-Interim model prediction.
Four different methods were used to derive lapse rateΓ: (i) a fixed monthly lapse rate 10
(ΓS) extracted from the literature (Method I); (ii) a measured lapse rate (ΓM) retrieved from the Zugspitze and the Garmisch stations (Method II); and (iii) ERA-Interim model internal lapse rates (ΓE1 and ΓE2 s/ΓE2 fa) derived from predictions at different pressure levels, (Methods III and IV).
Observed changes of lapse rates with elevation and with time, demonstrated that 15
the use of fixed lapse rates (ΓS) were not satisfactory and led to large biases between downscaled and locally measured temperature values, especially for high elevation stations. Method II represented an almost ideal situation where the complete verti-cal elevation/temperature gradient is covered by two stations providing continuously measured lapse rates. While this approach provided the best results, it would be in-20
teresting to analyze how far these measured lapse rates could be extrapolated in a spatial context. A major disadvantage of Method II is its dependency on the availabil-ity of meteorological stations; only very few places in mountainous and high altitude regions worldwide can offer such a station setup.
Method III and Method IV represent novel alternatives for deriving temperature lapse 25
HESSD
9, 5931–5953, 2012Downscaling ERA-Interim temperature data in
complex terrain
L. Gao et al.
Title Page
Abstract Introduction
Conclusions References
Tables Figures
◭ ◮
◭ ◮
Back Close
Full Screen / Esc
Printer-friendly Version Interactive Discussion
Discussion
P
a
per
|
Dis
cussion
P
a
per
|
Discussion
P
a
per
|
Discussio
n
P
a
per
|
elevations. This indicates that the ERA-Interim model structure, including various mod-ules considering sub-grid variability of land surface characteristics and fluxes (e.g. the sub grid scale orographic drag in the Cy33r1 land surface scheme), seems to be well suited to represent the dominant controls on lapse rate variations, at least for this test environment. The additional implementation of an internal baseline at approximately 5
1500 m and the calculation of separate lapse rates above and below (Method IV), al-lowed a vertical differentiation and the consideration of local circulation effects (be-low) and the dominance of free air conditions (above) on the temperature distribution... (Mahrt, 2006; Rolland, 2003; Blandford et al., 2008). However, results only showed minimal differences between Method III and IV for this test site and should be tested 10
further.
So far, our analysis has been limited to a single location in the German Alps with 3 meteorological stations providing calibration/validation data sets for testing developed downscaling methods. While this setup is ideal in that it covers a maximum vertical range of over 2000 m, it will be necessary to extend this analysis to different locations 15
around the world. It should also be investigated whether other global reanalysis prod-ucts, using different land surface representations in their climate models. Also, the po-tential of extending our approach to other meteorological variables has to be explored and is a topic of on-going and future research.
Acknowledgements. ERA-Interim data is supported by ECMWF Special Project. We thank
Flo-20
HESSD
9, 5931–5953, 2012Downscaling ERA-Interim temperature data in
complex terrain
L. Gao et al.
Title Page
Abstract Introduction
Conclusions References
Tables Figures
◭ ◮
◭ ◮
Back Close
Full Screen / Esc
Printer-friendly Version Interactive Discussion
Discussion
P
a
per
|
Dis
cussion
P
a
per
|
Discussion
P
a
per
|
Discussio
n
P
a
per
|
References
Barry, R. G.: Mountain Climatology and Past and Potential Future Climatic Changes in Mountain Regions – a Review, Mt. Res. Dev., 12, 71–86, 1992.
Bernhardt, M. and Schulz, K.: SnowSlide: A simple routine for calculating gravitational snow transport, Geophys. Res. Lett., 37, L11502, doi:10.1029/2010gl043086, 2010.
5
Berrisford, P., Dee, D., Fielding, K., Fuentes, M., Kallberg, P., Kobayashi, S., and Uppala, S.: The ERA-Interim archive (version 1.0), ERA Report Series: European Centre for Medium Range Weather Forecasts, 2009.
Berrisford, P., Kallberg, P., Kobayashi, S., Dee, D., Uppala, S., Simmons, A. J., Poli, P., and Sato, H.: Atmospheric conservation properties in ERA-Interim, Q. J. Roy. Meteor. Soc., 137,
10
1381–1399, doi:10.1002/Qj.864, 2011.
Blandford, T. R., Humes, K. S., Harshburger, B. J., Moore, B. C., Walden, V. P., and Ye, H. C.: Seasonal and synoptic variations in near-surface air temperature lapse rates in a mountain-ous basin, J. Appl. Meteorol. Clim., 47, 249–261, doi:10.1175/2007jamc1565.1, 2008. Bolstad, P. V., Swift, L., Collins, F., and Regniere, J.: Measured and predicted air temperatures
15
at basin to regional scales in the southern Appalachian mountains, Agr. Forest. Meteorol., 91, 161–176, 1998.
Dee, D. P. and Uppala, S.: Variational bias correction in ERA-Interim, ECMWF Newsletter, 119, 21–29, 2009.
Dee, D. P., Uppala, S. M., Simmons, A. J., Berrisford, P., Poli, P., Kobayashi, S., Andrae, U.,
20
Balmaseda, M. A., Balsamo, G., Bauer, P., Bechtold, P., Beljaars, A. C. M., van de Berg, L., Bidlot, J., Bormann, N., Delsol, C., Dragani, R., Fuentes, M., Geer, A. J., Haimberger, L., Healy, S. B., Hersbach, H., Holm, E. V., Isaksen, L., Kallberg, P., Kohler, M., Matricardi, M., McNally, A. P., Monge-Sanz, B. M., Morcrette, J. J., Park, B. K., Peubey, C., de Rosnay, P., Tavolato, C., Thepaut, J. N., and Vitart, F.: The ERA-Interim reanalysis: configuration
25
and performance of the data assimilation system, Q. J. Roy. Meteor. Soc., 137, 553–597, doi:10.1002/Qj.828, 2011.
DeGaetano, A. T. and Belcher, B. N.: Spatial interpolation of daily maximum and minimum air temperature based on meteorological model analyses and independent observations, J. Appl. Meteorol. Clim., 46, 1981–1992, doi:10.1175/2007JAMC1536.1, 2007.
30
HESSD
9, 5931–5953, 2012Downscaling ERA-Interim temperature data in
complex terrain
L. Gao et al.
Title Page
Abstract Introduction
Conclusions References
Tables Figures
◭ ◮
◭ ◮
Back Close
Full Screen / Esc
Printer-friendly Version Interactive Discussion
Discussion
P
a
per
|
Dis
cussion
P
a
per
|
Discussion
P
a
per
|
Discussio
n
P
a
per
|
Hamlet, A. F. and Lettenmaier, D. P.: Production of temporally consistent gridded precipitation and temperature fields for the continental United States, J. Hydrometeorol., 6, 330–336, 2005.
Ishida, T. and Kawashima, S.: Use of Cokriging to Estimate Surface Air-Temperature from Ele-vation, Theor. Appl. Climatol., 47, 147–157, 1993.
5
Kunkel, E. K.: Simple Procedures for Extrapolation of Humidity Variables in the Mountainous Western United States, J. Climate, 2, 656–669, 1989.
Laughlin, G. P.: Minimum Temperature and Lapse-Rate in Complex Terrain – Influencing Fac-tors and Prediction, Arch. Meteor. Geophy. B, 30, 141–152, 1982.
Liston, G. E. and Elder, K.: A meteorological distribution system for high-resolution terrestrial
10
modeling (MicroMet), J. Hydrometeorol., 7, 217–234, 2006.
Liston, G. E., Hiemstra, C. A., Elder, K., and Cline, D. W.: Mesocell Study Area Snow Distri-butions for the Cold Land Processes Experiment (CLPX), J. Hydrometeorol., 9, 957–976, doi:10.1175/2008jhm869.1, 2008.
Lundquist, J. D. and Cayan, D. R.: Surface temperature patterns in complex terrain: Daily
vari-15
ations and long-term change in the central Sierra Nevada, California, J. Geophys. Res.-Atmos., 112, D11124, doi:10.1029/2006jd007561, 2007.
Mahrt, L.: Variation of surface air temperature in complex terrain, J. Appl. Meteorol. Clim., 45, 1481–1493, 2006.
Maurer, E. P., Wood, A. W., Adam, J. C., Lettenmaier, D. P., and Nijssen, B.: A long-term
hydro-20
logically based dataset of land surface fluxes and states for the conterminous United States, J. Climate, 15, 3237–3251, 2002.
Mernild, S. H., Liston, G. E., Hiemstra, C. A., Steffen, K., Hanna, E., and Christensen, J. H.: Greenland Ice Sheet surface mass-balance modelling and freshwater flux for 2007, and in a 1995–2007 perspective, Hydrol. Process., 23, 2470–2484, doi:10.1002/Hyp.7354, 2009.
25
Minder, J. R., Mote, P. W., and Lundquist, J. D.: Surface temperature lapse rates over com-plex terrain: Lessons from the Cascade Mountains, J. Geophys. Res.-Atmos., 115, D14122, doi:10.1029/2009jd013493, 2010.
Mooney, P. A., Mulligan, F. J., and Fealy, R.: Comparison of ERA-40, ERA-Interim and NCEP/NCAR reanalysis data with observed surface air temperatures over Ireland, Int. J.
30
Climatol., 31, 545–557, doi:10.1002/Joc.2098, 2011.
HESSD
9, 5931–5953, 2012Downscaling ERA-Interim temperature data in
complex terrain
L. Gao et al.
Title Page
Abstract Introduction
Conclusions References
Tables Figures
◭ ◮
◭ ◮
Back Close
Full Screen / Esc
Printer-friendly Version Interactive Discussion
Discussion
P
a
per
|
Dis
cussion
P
a
per
|
Discussion
P
a
per
|
Discussio
n
P
a
per
|
Nieto, H., Sandholt, I., Aguado, I., Chuvieco, E., and Stisen, S.: Air temperature estimation with MSG-SEVIRI data: Calibration and validation of the TVX algorithm for the Iberian Peninsula, Remote Sens. Environ., 115, 107–116, doi:10.1016/j.rse.2010.08.010, 2011.
Pages, M. and Miro, J. R.: Determining temperature lapse rates over mountain slopes using vertically weighted regression: a case study from the Pyrenees, Meteorol. Appl., 17, 53–63,
5
doi:10.1002/Met.160, 2010.
Pepin, N. C. and Seidel, D. J.: A global comparison of surface and free-air temperatures at high elevations, J. Geophys. Res.-Atmos., 110, doi:10.1029/2004JD005047, 2005.
Prihodko, L. and Goward, S. N.: Estimation of air temperature from remotely sensed surface observations, Remote Sens. Environ., 60, 335–346, 1997.
10
Prince, S. D., Goetz, S. J., Dubayah, R. O., Czajkowski, K. P., and Thawley, M.: Inference of surface and air temperature, atmospheric precipitable water and vapor pressure deficit using Advanced Very High-Resolution Radiometer satellite observations: comparison with field observations, J. Hydrol., 213, 230–249, 1998.
Regniere, J.: Generalized approach to landscape-wide seasonal forecasting with
temperature-15
driven simulation models, Environ. Entomol., 25, 869–881, 1996.
Rolland, C.: Spatial and seasonal variations of air temperature lapse rates in Alpine regions, J. Climate, 16, 1032–1046, 2003.
Simmons, A., Uppala, S., Dee, D., and Kobayashi, S.: ERA-Interim: New ECMWF reanalysis products from 1989 onwards, ECMWF Newsletter, 110, 25–35, 2006.
20
Stahl, K., Moore, R. D., Floyer, J. A., Asplin, M. G., and McKendry, I. G.: Comparison of ap-proaches for spatial interpolation of daily air temperature in a large region with complex topography and highly variable station density, Agr. Forest Meteorol., 139, 224–236, 2006. Tabony, R. C.: The Variation of Surface-Temperature with Altitude, Meteorol. Mag., 114, 37–48,
1985.
25
Uppala, S., Dee, D., Kobayashi, S., Berrisford, P., and Simmons, A.: Towards a climate data assimilation system: status updata of ERA-Interim, ECMWF Newsletter, 115, 12–18, 2008. Vicente-Serrano, S. M., Saz-Sanchez, M. A., and Cuadrat, J. M.: Comparative analysis of
inter-polation methods in the middle Ebro Valley (Spain): application to annual precipitation and temperature, Clim. Res., 24, 161–180, 2003.
HESSD
9, 5931–5953, 2012Downscaling ERA-Interim temperature data in
complex terrain
L. Gao et al.
Title Page
Abstract Introduction
Conclusions References
Tables Figures
◭ ◮
◭ ◮
Back Close
Full Screen / Esc
Printer-friendly Version Interactive Discussion
Discussion
P
a
per
|
Dis
cussion
P
a
per
|
Discussion
P
a
per
|
Discussio
n
P
a
per
|
Table 1.Test sites information.
Station Latitude Longitude Altitude(m a.s.l.) Timeresolution Time series Measuredheight (m)
HESSD
9, 5931–5953, 2012Downscaling ERA-Interim temperature data in
complex terrain
L. Gao et al.
Title Page
Abstract Introduction
Conclusions References
Tables Figures
◭ ◮
◭ ◮
Back Close
Full Screen / Esc
Printer-friendly Version Interactive Discussion
Discussion
P
a
per
|
Dis
cussion
P
a
per
|
Discussion
P
a
per
|
Discussio
n
P
a
per
|
Table 2.Fixed monthly lapse rates extracted from Kunkel (1989) and Liston and Elder (2006).
Jan Feb Mar Apr May Jun Jul Aug Sep Oct Nov Dec
Lapse rate
−4.4 −5.9 −7.1 −7.8 −8.1 −8.2 −8.1 −8.1 −7.7 −6.8 −5.5 −4.7
HESSD
9, 5931–5953, 2012Downscaling ERA-Interim temperature data in
complex terrain
L. Gao et al.
Title Page
Abstract Introduction
Conclusions References
Tables Figures
◭ ◮
◭ ◮
Back Close
Full Screen / Esc
Printer-friendly Version Interactive Discussion
Discussion
P
a
per
|
Dis
cussion
P
a
per
|
Discussion
P
a
per
|
Discussio
n
P
a
per
|
Table 3.Comparison of the ERA-Interim 2 m temperature with 3-hourly and daily data of the three meteorological stations used. The NSE, RMSE and MAE are also listed.
Garmisch Zugspitze Zugspitzplatt NSE RMSE MAE NSE RMSE MAE NSE RMSE MAE
T
3 h 0.85 3.45 2.93 −1.00 9.92 9.22 0.45 5.55 4.84
T
HESSD
9, 5931–5953, 2012Downscaling ERA-Interim temperature data in
complex terrain
L. Gao et al.
Title Page
Abstract Introduction
Conclusions References
Tables Figures
◭ ◮
◭ ◮
Back Close
Full Screen / Esc
Printer-friendly Version Interactive Discussion
Discussion
P
a
per
|
Dis
cussion
P
a
per
|
Discussion
P
a
per
|
Discussio
n
P
a
per
|
Fig. 1.The locations of the meteorological stations (triangles), and ERA-Interim 0.25◦
×0.25◦
HESSD
9, 5931–5953, 2012Downscaling ERA-Interim temperature data in
complex terrain
L. Gao et al.
Title Page
Abstract Introduction
Conclusions References
Tables Figures
◭ ◮
◭ ◮
Back Close
Full Screen / Esc
Printer-friendly Version Interactive Discussion
Discussion
P
a
per
|
Dis
cussion
P
a
per
|
Discussion
P
a
per
|
Discussio
n
P
a
per
|
Zugspitze
ERA-Interim
Garmisch 2964m
1286.6m
719m 925mb
850mb 700mb
Гm
ГE_2s ГE_2fa ГE_1
Zugspitzplatt 2250m
HESSD
9, 5931–5953, 2012Downscaling ERA-Interim temperature data in
complex terrain
L. Gao et al.
Title Page
Abstract Introduction
Conclusions References
Tables Figures
◭ ◮
◭ ◮
Back Close
Full Screen / Esc
Printer-friendly Version Interactive Discussion
Discussion
P
a
per
|
Dis
cussion
P
a
per
|
Discussion
P
a
per
|
Discussio
n
P
a
per
|
a) b) c)
HESSD
9, 5931–5953, 2012Downscaling ERA-Interim temperature data in
complex terrain
L. Gao et al.
Title Page
Abstract Introduction
Conclusions References
Tables Figures
◭ ◮
◭ ◮
Back Close
Full Screen / Esc
Printer-friendly Version Interactive Discussion
Discussion
P
a
per
|
Dis
cussion
P
a
per
|
Discussion
P
a
per
|
Discussio
n
P
a
per
|
−8
−7
−6
−5
−4
−3
−2
Lapse r
ate (°C/km)
Jan Feb Mar Apr May Jun Jul Aug Sep Oct Nov Dec
ΓS ΓM ΓE_1 ΓE_2sΓE_2fa
Fig. 4. Boxplot of monthly lapse rates variability in 1979–2010, ΓS (white), ΓM (light gray), ΓE1 (medium gray) andΓE2 s/ΓE2 fa (dark gray). Thick horizontal lines show the median values.
HESSD
9, 5931–5953, 2012Downscaling ERA-Interim temperature data in
complex terrain
L. Gao et al.
Title Page
Abstract Introduction
Conclusions References
Tables Figures
◭ ◮
◭ ◮
Back Close
Full Screen / Esc
Printer-friendly Version Interactive Discussion
Discussion
P
a
per
|
Dis
cussion
P
a
per
|
Discussion
P
a
per
|
Discussio
n
P
a
per
|
a) b) c)
d) e) f)
g) h) i)
j) k) l)