www.atmos-chem-phys.net/10/10949/2010/ doi:10.5194/acp-10-10949-2010
© Author(s) 2010. CC Attribution 3.0 License.
Chemistry
and Physics
A decadal regional and global trend analysis of the aerosol optical
depth using a data-assimilation grade over-water MODIS and
Level 2 MISR aerosol products
J. Zhang1and J. S. Reid2
1Department of Atmospheric Science, University of North Dakota, Grand Folks, ND, USA 2Marine Meteorology Division, Naval Research Laboratory, Monterey, CA, USA
Received: 2 June 2010 – Published in Atmos. Chem. Phys. Discuss.: 11 August 2010 Revised: 27 October 2010 – Accepted: 5 November 2010 – Published: 24 November 2010
Abstract. Using the ten-year (2000–2009) Data-Assimilation (DA) quality Terra MODIS and MISR aerosol products, as well as 7 years of Aqua MODIS, we studied both regional and global aerosol trends over oceans. This included both operational and data assimilation grade versions of the products. After correcting for what appears to be aerosol signal drift from the radiometric calibration of both MODIS instruments, we found MODIS and MISR agreed on a statistically negligible global trend of±0.003/per decade. Our study also suggests that AODs over the Indian Bay of Bengal, east coast of Asia, and Arabian Sea show increasing trends of 0.07, 0.06, and 0.06 per decade for MODIS, respectively. These regional trends are considered as significant with a confidence level above 95%. Similar increasing trends were found from MISR, but with less relative magnitude. These trends reflect respective increases in the optical intensity of aerosol events in each region: anthropogenic aerosols over the east coast of China and Indian Bay of Bengal; and a stronger influence from dust events over the Arabian Sea. Negative AOD trends, low in confidence levels, are found off Central America, the east coast of North America, and the west coast of Africa, which indicate that longer periods of observation are necessary to be conclusive.
Correspondence to:J. Zhang (jzhang@atmos.und.edu)
1 Introduction
Since 2000, the Moderate Resolution Imaging Spectro-radiometer (MODIS) and Multi-angle Imaging Spectrora-diometer (MISR) on Terra have yielded a decade of reliable aerosol optical depth (AOD) data, unparalleled in quality for their coverage and duration. However, a few studies have shown that uncertainties still exist in current satellite aerosol products attributable to the complex surface, cloud contami-nation, and aerosol models used in the retrieving process (e.g. Zhang and Reid, 2006; Zhang et al., 2005; Kahn et al., 2007, 2009, 2010; Shi et al., 2010; Levy et al., 2010). Those studies also suggested one must be wary of mistakenly interpreting noises and biases in satellite aerosol products as legitimate signals, particularly in demanding application such as data assimilation and long term trend analyses.
AVHRR have large uncertainties related to limitations of the sensors, such as very limited channels for aerosol detection, cloud screening, calibration issues (e.g. Rao and Chen, 1996; Zhang et al., 2001), as well as sampling biases (e.g. Zhang and Reid, 2009). Using a more recent generation of aerosol sensors such as MODIS and the Multi-angle Imaging Spec-troRadiometer (MISR), several studies have attempted to es-timate the decadal variations of aerosol optical depth glob-ally (e.g. Yu et al., 2009). But even here, issues of temporal consistency in the radiometric calibration have been raised (e.g., Remer et al., 2008; Lyapustin et al., 2007). Using mul-tiple sensors over the same time period can be very com-plicated: to de-bias the data, the inter-comparison of aerosol retrievals among different aerosol products must occur on the pixel level where sampling and coverage is problematic (e.g. Kahn et al., 2009).
In addition to instrumentation issues, there are natural variability issues which must be considered. AODs are of course linked to weather phenomena which can show dra-matic inter-annual variability and seasonal sensitivities to clear sky fraction and emissions (e.g., see annual state of the climate summaries in the BAMS, http://www.ncdc.noaa. gov/bams-state-of-the-climate/). Long term changes are as-sumed to be attributable to more background changes of en-ergy use and economic development. Decadal and longer-term changes in AOD could result from land-use change, land surface modification by changing climate, or changes to sea spray source due to climate change. But, through the averaging processes to derive these long term results, one can lose information on the impact of significant events, both in amplitude and frequency. Finally, weather variability also not only effects the actual atmospheric AOD, but also the ar-tifacts in the retrieval.
In this paper we begin to explore these issues using the simplest case possible: the 10 year time series of global MODIS and MISR over ocean AOD data. Because many biases are removed, we also employ the adapted data assim-ilation (DA) grade level-three product of Zhang and Reid (2006) with updated coefficients for data collect 5 by Shi et al. (2010). Limited comparisons to AERONET, Aqua MODIS and MISR are provided to display the range of possi-ble outcomes. Our study period is from March 2000 through December 2009; nearly 10 years of data. The period includes three El Nino and two La Nina events, and major swings in global biomass burning activity in tropical, mid-latitude and boreal regions (e.g. Giglio et al., 2006). We begin with a de-scription of the level 3 product generation process used for this study. This is followed by a discussion of the statistical techniques used to gauge the data. Data are subsequently de-biased and a global time series maps of AOD trends and vari-ability is then presented. Further exploration is made for re-gions with statistically significant trends. We conclude with a discussion of how our findings compare to other recent trend analyses presented in the literature.
2 Data
Six datasets are included in this study: the NASA operational over ocean collection 5 Terra MODIS level-2 aerosol prod-uct (MOD04, since 2000), the subsequent NRL data assim-ilation quality level-3 Terra MODIS aerosol product (Zhang and Reid, 2006; Shi et al., 2010), a similar pair of data prod-ucts from Aqua MODIS (MYD, since 2003), Terra MISR version 22 level 2 product, and Aerosol Robotic Network (AERONET) sun photometer data (Holben et al., 1998).
The MOD04 over ocean product provides retrieved aerosol optical thickness and some aerosol particle size information at spatial resolutions ranging from 10×10 km at nadir to 20x48km at the scan edge. The over water MODIS aerosol product reports aerosol optical depth (AOD) values at seven wavelengths ranging from 0.47 to 2.13 µm (Remer et al., 2008). However, AOD values at 0.55 µm are considered the primary product; henceforth in this manuscript, AOD val-ues refer to 0.55 µm . The uncertainties in the over water MODIS aerosol optical depth retrievals are reported to be
±0.03±0.05τover ocean (Remer et al., 2005). However, re-cent studies have suggested that larger uncertainties exist in the MODIS aerosol data (e.g. Zhang and Reid, 2006; Kahn et al., 2009), especially over cloudy regions (e.g. Zhang et al., 2005). Zhang and Reid (2006) also report additional bias with respect to white-capping and systematic +/−15– 20% microphysical biases also appear to be present for dust and smoke/pollution species, respectively.
To minimize the effects of cloud contamination and/or biased MODIS retrievals to the trend analysis, the Zhang and Reid (2006) MODIS level 3 aerosol product developed for implementation in operational aerosol data assimilation (DA quality), is used in the present study. The DA qual-ity MODIS data were created after extensive qualqual-ity assur-ance procedures for removing possible cloud contamination, empirical corrections for wind to minimize the uncertainties from surface conditions, and aerosol micro-physical correc-tions based on derived fine mode fraction. Originally devel-oped for MOD04 data collection 4, minor alterations to the correction coefficients have been made for data collection 5 (Shi et al., 2010). Currently the total global data loss through screening is 24–26%, with a reduction of absolute errors of 10–30% (e.g. Shi et al., 2010).
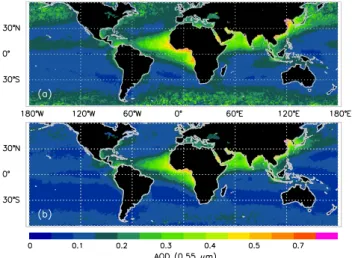
Fig. 1. (a)Yearly mean aerosol optical depth (AOD) plot using the operational over-water Terra MODIS aerosol product for year 2007; (b) Similar to (a) except using the DA quality over-water Terra MODIS aerosol product.
low latitudes are similar, the high AOD band over southern oceans is found in Fig. 1a but not in Fig. 1b, suggesting it is caused mostly by cloud contamination (Zhang and Reid, 2006).
We have found that MISR shows similar cloud biases in the Southern Oceans (Shi, UND, paper in composition). It is also noteworthy that the DA product shows similar qualita-tive differences with the AVHRR GACP AOD product pre-sented in Mischenko et al. (2007b). In particular the GACP product shows very high AODs in the Southern Oceans and the Northern Pacific and Atlantic Oceans, as well as higher AODs tracking the Pacific ITCZ. Although we have not di-rectly studied the GACP product, these features are indica-tive of a high degree of cloud contamination. Hence, given the likely co-linearity of cloud bias in all of the major aerosol products used for trend studies, analysis of the DA version allows us to isolate any possible impacts form clouds and also isolate potential trends in clear sky conservative obser-vations.
Whereas the level 3 products correct individual products for cloud contamination, microphysics and lower bound-ary condition, for a trend study, the stability in the radi-ance calibration on the retrieval is an equally pressing is-sue. We monitored the decadal stability of MOD04 through comparison with available coastal Aerosol Robotic Network (AERONET) sun photometer sites (Holben et al., 1998). AERONET is a federated network of ground-based sun-photometer instruments providing high-precision measure-ments of aerosol properties. AERONET instrumeasure-ments mea-sure Sun and sky radiance at several wavelengths: a well-calibrated instrument, after cloud clearing, can retrieve clear-sky optical depth with an accuracy of about 0.015. Typically, the transfer of calibration to a field instrument occurs within
0.004 uncertainty with reference instruments being swapped out nearly monthly (T. F. Eck of AERONET, personal com-munication, 2010). Hence, the calibration transfer is “ran-dom” from instrument to instrument and year to year. Since there is no AERONET data at the 0.55 µm spectral channel, measurements from 0.50 and 0.67 µm were used to estimate the observations at 0.55 µm based on the method of O’Neill et al. (2003) in a method similar to Zhang and Reid (2006). Only cloud screened, quality assured level 2 AERONET data were used in this study.
In addition, the version 22 MISR aerosol products (Kahn et al., 2009, 2010), and the Collection 5 Aqua MODIS aerosol products (Remer et al., 2005) were included for com-parison purposes. MISR observers the earth and atmosphere with nine different viewing angles, and at 4 spectral bands: 0.446, 0.558, 0.672, and 0.866 µm , with a relatively nar-rower swath of 360km comparing with MODIS. The aerosol optical depth retrievals from the 0.558 µm channel were used in study. The uncertainty of the MISR AOD is estimated to be±0.05 or 0.2×AOD (Kahn et al., 2005). The AERONET measurements from 0.50 and 0.67 µm were also used to es-timate AERONET measurements at the 0.558 µm spectral channel for inter-comparisons with the MISR AOD data at 0.558 µm.
3 Statistical significance test for the trend data analysis The significance of the trend analysis presented here was estimated using the method by Weatherhead et al. (1998), where the ten-year aerosol trend is represented using the fol-lowing equation:
Yt=Yo+ωXt+Nt t=1,...T (1)
WhereYt is the monthly mean global averaged over-ocean
MODIS AOD in each area of examination,ω is the linear AOD trend, andYois the offset at the start of the time series (for example, the offset of the monthly mean AOD at Jan-uary, 2000). T is the total number of months,t is the month index, starting from January 2000,Xtequalst/12 or number
of years since January, 2000, and Nt is the monthly mean
noise that is not represented by the linear trend model. To further representNt, we also assume a first order
auto-gressive model ofNt:
Nt=φNt−1+εt (2)
WhereNt−1is the monthly mean noise from the month of t−1,φis the autocorrelation betweenNt andNt−1, andεtis
the white noise. Based on equation 1 and 2, Weatherhead et al. (1998) suggested that the standard deviation of the yearly trend (σω) can be estimated as
σω≈
σN
n3/2
s
1+φ
WhereσN is the standard deviation of theNt, andnequals
T/12 or the total number of years in the analysis. Also sug-gested by Weatherhead et al. (1998), if the absolute value of ω/σω is larger than 2, the trend is considered as significant
with a confidence level of 95%. This threshold was applied to the rest of the study to detect the significance of the global and regional aerosol trends. Note that this method imposes a linear trend on the data, and that this trend may or may not be significant, depending on whether (a) there is indeed a sec-ular increase or decrease and (b) the secsec-ular trend does not significantly change magnitude during the time window un-der consiun-deration (i.e., there are no “break points”) (Young et al., 1999).
Monthly average AOD was grid-number-weighted over 1x1 degree (i.e., monthly averages are complied from grid daily averages). Two types ofYt values were examined in
this study: (1) the regular monthly mean AOD at each 1×1 degree point; and (2) the monthly mean AOD after remov-ing seasonal variations (will be discussed in section 4 for details). To further differentiate seasonal and inter-seasonal trends, we experimented with both simple boxcar averaging and Fourier analysis. We found that a simple boxcar aver-age (i.e. Averaver-age +/−T from the center point) yielded results nearly identical to the more complicated Fourier analyses. Methods related to these analyses are described in the next section. Note that different averaging methods could intro-duce differences in the monthly mean global averaged AOD values (Levy et al., 2009). However, we are studying the relative differences between global averaged AODs for dif-ferent months, and therefore, we assume the uncertainties in-troduced by the averaging methods for the trend analysis to be low.
4 Results and discussions
4.1 Global analysis from the original and the DA quality collection products
Figure 2a represents the monthly averaged NASA opera-tional Terra MODIS (collection 5, red), DA grade Terra MODIS (blue), and operational MISR (green) aerosol opti-cal depth values over global oceans from March 2000 to De-cember 2009. To compute the monthly mean values (dotted), only the MODIS over water retrievals were used, and bad re-trievals labeled by quality assurance flag were excluded from the study. Also, we excluded two months (August 2000, and June 2001) that each had less than 20 days of valid data. Solid lines represent 11-month centered-boxcar filters (i.e., each point is the averaged +/−5 months). Similar approaches were also applied to the Terra MISR data, and only MISR aerosol retrievals with quality assurance flag labels of “suc-cessful” were used.
Annually, the minimum averaged AOD values are typi-cally found during Northern-hemispheric winters, and the
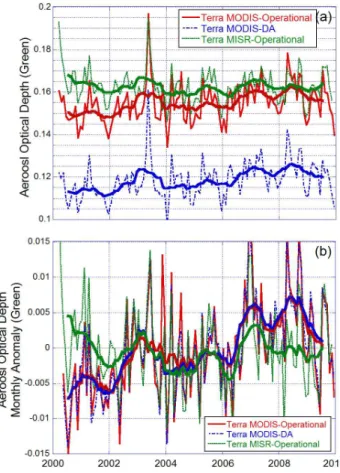
Fig. 2. (a)Ten-year (2000-2009) AOD trend analysis using both the over water collection 5 MODIS aerosol product (operational, red lines), the DA quality level 3 over water Terra MODIS aerosol prod-uct (blue lines), and the version 22 over water Terra MISR aerosol product (green lines). The thin line shows the monthly mean AOD patterns from the three products, and the thick solid lines show the boxcar analysis (window size,±5 months) for the monthly mean Terra MODIS (red), Terra-MISR (green), and DA quality MODIS (blue) over water aerosol products. (b). Similar to (a), but using deseasonalized Terra MODIS (red lines), Terra MISR (green lines), and the DA quality MODIS (blue) over water aerosol products.
maximum monthly averages are found around Northern Hemispheric spring and summer seasons. MODIS and MISR correlate well in this regard. The peak monthly mean AOD value for both sensors was found in northern spring of 2003, and was associated with significant dust activity in Asia. A linear regression analysis was applied to the ten year Terra MODIS monthly mean AOD values, and an increase trend in AOD of about 0.008/per decade was found (i.e., 0.008 over 10 years, with a|ω/σω|value of 1.99). In comparison, the
ten year AOD trend from the Terra MISR aerosol product was found to be−0.003/per decade (with a|ω/σω|value of
0.78).
impacts of cloud contamination on the trend analysis, we also studied the AOD trend using the data assimilation (DA) quality level-3 Terra MODIS aerosol product (Fig. 2a, blue). Since the newly developed data assimilation quality MODIS level 3 data excluded retrievals with reported cloud fraction lager than 80% and isolates, the total averaged AOD values are systematically reduced by 0.04, or roughly 30%. Further microphysical corrections would amplify the fine/coarse par-tition of AOD, hence enhancing anthropogenic signals versus natural dust and sea salt. But, even after the quality assurance procedures, both the thin red line and blue dash lines show remarkably consistent patterns. Also, an increasing trend of 0.009 per decade (with a|ω/σω|value of 2.13) was found,
in-dicating that cloud, microphysical, and wind artifacts affect the total AOD, but not the decadal AOD trend.
Strong seasonal variations exist in both regional and monthly AOD trends. For example, Asian dust storms peak in the spring each year. Biomass burning events in Cen-tral American occur in April and May and, in contrast, biomass burning episodes in South Africa and South Amer-ica are mostly found in late boreal summer months. For the annual trend analysis, it is necessary to remove these seasonal variations. Figure 2b shows the similar plot as Fig. 2a except for using the deseasonalized MODIS AOD data, with April 2003, the month of very high Asian dust activity was removed. To remove seasonal variations, ten-year averages of AOD values for each month for both re-gional and global scale were first calculated, and then sub-tracted from the monthly mean MODIS AOD data for both original and data assimilation quality MODIS aerosol prod-ucts to create an anomaly. Typically, monthly MODIS AOD anomaly variability is within 0.01, with departures as high as 0.018. MISR, having its more limited sampling, shows larger monthly anomalies.
After the baseline difference is removed in the deseason-alized product, the operational and data assimilation qual-ity products are nearly identical (0.009, and 0.010 AOD at 0.55µm per decade respectively). In order to determine sta-tistical significance of the MODIS trend,|ω/σω|was
calcu-lated and found to be 3.60, suggesting that this global trend is statistically significant with a 95% confident level (Weath-erhead et al., 1998). However, the anomaly plot has several suspicious features. Firstly, contrary to MODIS, the MISR instrument does not yield any trend. Second, while one can envision a straight line through the MODIS signal, one can also envision a series of steps in AOD, with the largest in the 2006–2009 period. MISR shows corresponding features. Such AOD signal shifts are suggestive of radiometric shift.
To explore the potential radiometric differences between MODIS and MISR further, Fig. 3a added the boxcar analysis from the original and data assimilation quality Aqua MODIS AOD data to the Terra data. Again, while the boxcar aver-aged monthly mean MISR AOD values show almost no trend for 2001 to 2008 study period, the Aqua and Terra MODIS AOD data show clearly increasing trends for approximately
2005-2006 onwards. Similarly, Fig. 3b shows the boxcared AOD differences for the boxcar analyses from Fig. 3a to the boxcar analysis from the original Terra MODIS AOD data.
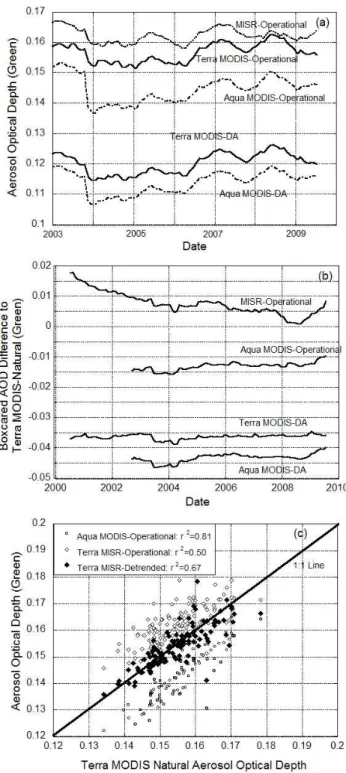
From Fig. 3a and b, we see that trends in both Aqua and Terra MODIS are very similar except that the monthly mean Terra AOD values are consistently higher than those of the Aqua MODIS by 0.012. The data assimilation quality ver-sion of the product shows a slightly smaller offset of 0.008. Remer et al. (2008) suggested the reason for the differences between Terra and Aqua MODIS AOD values is caused by radiometric calibration. Perhaps the AOD trend for Aqua MODIS increases by as much as 0.005 over the study period, largely due to the last few months of the trend line.
The difference between both MODIS and MISR is also clearer as presented in Fig. 3a and b, with steeper biases earlier in the time period. The rapid drop-off in the 2000– 2002 timeframe clearly looks like a radiometric difference between MODIS and MISR, which is not unexpected in the early operations of a satellite sensor. After this point, the difference appears to stabilize except for a dip in the 2008 timeframe.
Our last test is to determine the nature of departures from the trend line. Figure 3c shows the scatter plot of boxcared AOD data from the original Terra MODIS to the original Aqua (open square), and MISR (open diamond) AOD data; good correlations were found in both cases, even though non-zero offsets exist in both cases. We also de-trend the MISR (solid diamond) AOD data by 0.006 per decade. The correla-tion between the de-trended MISR and the original MODIS AOD data from the boxcar analysis is 0.67, with most of points clustered around 1 to 1 lines, showing that the actual monthly AOD variations observed from MISR and MODIS are indeed consistent to a very high level. Note that although not a focus of this study, the absolute differences in Fig. 3 between MODIS and MISR could be due to either algorithm errors (Kahn et al., 2009), or absolute calibration (Lallart et al., 2008).
To summarize from Figs. 2 and 3, Offsets exist between operational data sets on the order of 0.01, and the data assim-ilation quality version of the data is lower by∼0.04 (∼ 20-30%). Lastly, noticeable trends are found in the 2000-2009 period for all Terra and Aqua MODIS AOD products but not for MISR AOD.
Fig. 3. (a)Boxcar analysis (2003-2009) for the monthly mean Terra MISR, Terra MODIS (operational), Aqua MODIS (operational), the DA quality Terra MODIS, and the DA quality Aqua MODIS over water aerosol products for global oceans. The boxcar window size is set to±5 months. (b). The boxcared AOD differences for the boxcar analyses from (a) to the boxcar analysis from the original Terra MODIS AOD data.(c).The scatter plot of the boxcared AOD data from the original Terra MODIS to the original Aqua (open square), the MISR (open diamond) AOD data, and the de-trended MISR (filled diamond) AOD data.
4.2 Uncertainties in the trend analysis related to radiometric calibration and sampling biases Several issues, such as sampling bias (Zhang and Reid, 2009), and perturbations in sensor calibration (Remer et al., 2006, 2008), could introduce biases to the ten-year trend shown in Fig. 2. For example, MODIS-retrieved aerosol properties are only reported over cloud free skies and under satellite overpasses, thus introducing a clear sky/sampling bias to the monthly mean AOD values, and also to the trend analysis. A recently study by Zhang and Reid (2009), how-ever, suggested that although this sampling bias could intro-duce large bias to regional aerosol climatologies, the biases in the seasonal means are insignificant, and are less than 5% for the monthly means if we include all MODIS data over global oceans. Furthermore, Remer et al. (2006) suggested the sampling bias due to the difference in Terra and Aqua equatorial crossing time is on the order of 0.18%. There-fore, it is reasonable to use monthly global mean AOD values from Terra/Aqua MODIS to study the decadal aerosol optical depth trend.
On the other hand, satellite aerosol optical depth retrievals are very sensitive to sensor calibration (e.g. Remer et al., 2006). To study the effect of the perturbations in sensor calibration to the AOD trend, we evaluated the trend of the differences between the collocated AERONET and MODIS AOD values for MODIS observations. Such a study serves two purposes. First, we wish to determine what fraction of the trend may be due to any radiometric shift. Second, and perhaps even more importantly, by comparing MODIS and AERONET data we may be able to determine a baseline un-certainty in the measurement of AOD trends.
As the first step, nine years (2000–2008) of over-water Terra and Aqua MODIS aerosol retrievals were collocated with all available level 2 AERONET data. The year 2009 was not included in the analysis because the complete set of the level 2.0 AERONET data is not yet available. This leaves us with collocated pairs of AERONET and MODIS measurements over coastal and island sun-photometer sites. Secondly, we picked pairs with AERONET AOD<0.2 (low AOD cases close to the mean level in Fig. 2) and MODIS AOD<0.35 (remove any massive MODIS outliers), from which we calculated the yearly averaged difference between MODIS and AERONET AOD (1AOD, 1AODT for Terra, and 1AODA for Aqua MODIS). Also, only very good
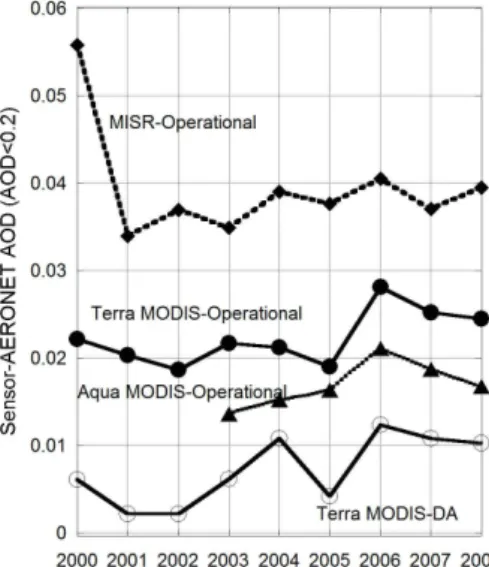
Fig. 4. The yearly averaged differences between the over water satellite AOD values and the AERONET AOD values (1AOD) for the Terra MODIS (operational, filled circles), Aqua MODIS (op-erational, filled triangles), Terra MISR (filled diamonds), and the DA quality MODIS over water aerosol product (open circles). Each open/filled symbol represents a yearly mean of1AOD for all the island and coastal sun-photometer sites for AERONET AOD less than 0.2.
choosing data samples for each run, this approach provides the variations of the yearly mean1AODTvalues (indicated by the error bars), and the nine-year trend of1AODTvalues. The filled circles show the mean yearly averaged1AODT values, and the error bars show the one standard deviation of the yearly averaged1AODTvalues from the 20 000 runs. In most cases, the standard deviations are no bigger than the data-point symbols.
Averaged 1AODT values for the operational Terra MODIS product indicate an average 0.0225 +/−0.005 high bias, with Aqua MODIS being ∼0.005 lower. Given that this is a comparison to AERONET, the difference is not in-dicative of the global product bias, but rather of any micro-physical, lower boundary condition and/or radiometric bias in the product. As AERONET is already cloud screened, the MODIS cloud error is significantly diminished. Even so, the data assimilation grade product, which has some correction for retrieval bias based in part on the year 2005 AERONET comparisons, has a persistent 0.005–0.01 AOD bias. MISR, with the exception of the initial 2000 bias, remains fairly steady at 0.037+/−0.002 bias.
After the initial radiometric stabilization of the sensors over the first year, all sensors suggest some increase in mean bias with time, ranging from 0.007–0.010 per decade for all Terra MODIS products and at 0.006 per decade for MISR. However at year 2006, the data is suggestive of a step in-crease in MODIS1AODTof 0.005 for both Terra and Aqua. The data assimilation quality product also demonstrates the
Fig. 5. (a) Similar to Fig. 2a but for the ten-year AOD trend
analysis over remote oceans (RO, 0◦–40◦S, 180◦W–140◦W) us-ing the Terra MODIS (operational, dark red), Terra-MISR (green), Aqua MODIS (operational, light red), the DA quality Terra MODIS (blue), and the DA quality Aqua MODIS (purple) over water aerosol product. (b).Similar to Fig. 2b, but for the ten-year trend over the remote ocean region. (c). Similar to Fig. 2c, but for the remote ocean region.
There are several possibilities to our observed differences with AERONET. First, the time series is so short that the inclusion, or removal of individual data points makes a sig-nificant difference in interpretation of Fig. 4 as either contin-uous or a jump. Considerations include that the start of the trend (2000), was a period of half data and rapidly changing calibration as the instrument equilibrated. Also consider that the operational and data assimilation quality data points all track each other extremely well, except for 2004 when the DA product is much higher, and 2005 when it is much lower. This is likely due to tautological bias as the algorithm was tuned for that year.
A second potential issue is variability in the AERONET sites used, as sites have frequently moved or turned on and off over the last decade. However, looking at the distribu-tion, there does not appear to be any obvious locality bias. In response to this possibility, we examined data from three individual background AERONET sites which span the en-tire data period, Ascension Island, Midway, and La Paguera. As in the global average, comparison to these sites shows a similar positive trend, but no clear 2006 delineation is visible. Given that, there is considerably more scatter from individual sites (+/−0.01 versus +/−0.005), these values are consistent with standard error propagation for AERONET given uncer-tainties, and such a jump is not resolvable at any individual site. Regardless, this exercise shows that using individual AERONET sites alone could not resolve the bias trend.
To increase signal to noise and determine if there is a lin-ear jump in calibration, the third test was performed over remote clean and subtropical oceans (RO region, 0◦–40◦S,
180◦–140◦W). This region was selected because it is away
from the major aerosol sources and the background aerosol particle concentration should be relatively constant. Also, there was a limited amount cloud bias found here (Zhang and Reid, 2006). Thus, potentially the variations in the MODIS AOD over this region could be used to represent variations due to radiometric calibration changes. Similar to Figs. 2a, 5a shows the monthly mean AODs and 11 month boxcars for the remote ocean region from 2000 to 2009. Similarly, Fig. 5b and c show the differenced to operational MODIS Terra and subsequent scatter plot, respectively. Overall the remote southern Ocean plots look remarkably similar to the global plots, both in shape as well as magnitude of differ-ences. After the removal of seasonal variations, as done in Fig. 2b, this study indicates an averaged 0.006–0.007 in-crease in AOD per decade from 2000 to 2009 due to calibra-tion. This estimation is close to the global averaged increase of 0.007–0.010/per decade in AOD derived from Fig. 4. The
|ω/σω|values were estimated to be 2.35, which means that
the deseasonalized trend estimated is statistically significant with a confident level of 95%. The one interesting exception to consistency with the global data lies in the scatter plot, Fig. 5c. Here a seasonal bias between MODIS and MISR in the June and August time frame is visible.
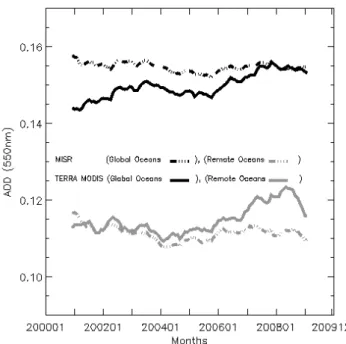
Fig. 6.Boxcar analysis for the monthly mean Terra MODIS (solid line), and MISR (dot dash line) over water aerosol products for both global oceans (black) and the RO region (grey). The boxcar window size is set to±11 months. Only collocated Terra MODIS and MISR AOD data were used in the analysis.
One can still argue that sampling biases could contribute the differences in Figs. 3 and 5. Therefore, we repeated the exercise in Fig. 3 using only the spatially and temporally col-located Terra MODIS and MISR AOD data. To collocate, the two data sets were first processed into daily 1×1 de-gree averages, and only pairs of collocated daily averages of Terra MODIS and MISR AOD data were used in the analysis. Since both Terra MODIS and MISR are on the same satel-lite, and MISR observations are located at the center of the MODIS swaths, we excluded data within the MODIS glint regions. But, there are still sufficient collocated data for the analysis from mid- and high-latitudes. As shown in Fig. 6, solid and dash lines show the monthly mean AOD using the collocated data set for Terra MODIS and MISR respectively. Black colors lines indicate global oceans, and grey lines rep-resent the analysis for the RO region. In both global oceans, and the RO region, almost no trend is found for the monthly mean MISR AOD data. Yet, for the monthly mean Terra MODIS AOD, clearly increase AOD trends are shown from year 2005/2006 to 2008. Since we only included collocated Terra MODIS and MISR data to minimize the sampling dif-ferences, we therefore can conclude that the differences be-tween MODIS and MISR AOD trends as shown in Fig. 3 can be credited to uncertainties in the radiometric calibration.
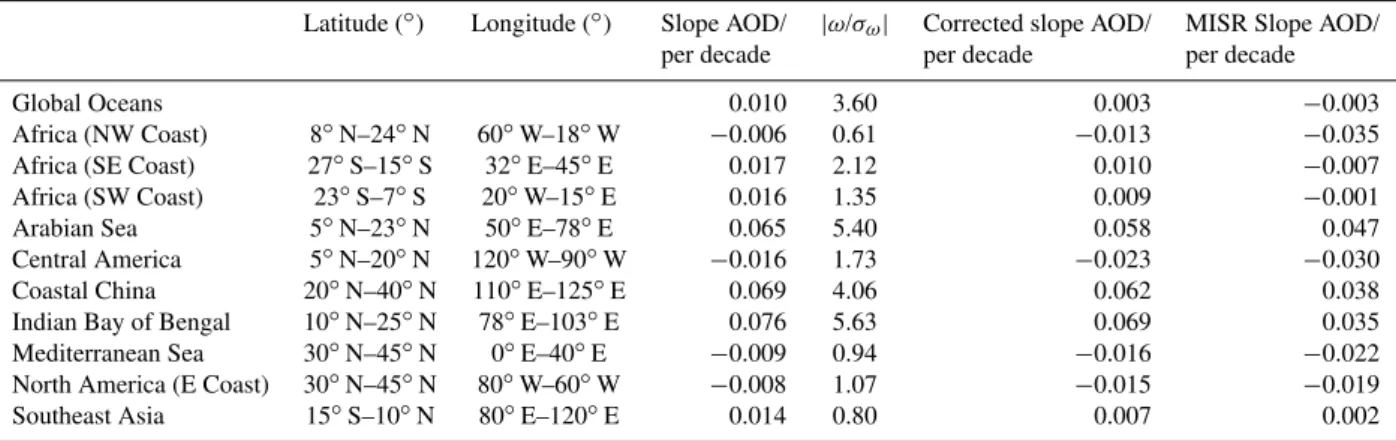
Table 1. Ten-year AOD trend analysis for the selected target regions. The deseasonalized DA quality over-water Terra MODIS aerosol products from March 2000 to December 2009 were used. The correct slope refers to the slope of the AOD trend analysis after the1AOD correction. Trend analysis for global oceans is also included. Note that regions with|ω/σω|>2 are consider to have real trends with a 95% confident level. The last column shows the ten-year AOD trend analysis using the deseasonalized MISR aerosol product.
Latitude (◦) Longitude (◦) Slope AOD/ |ω/σω| Corrected slope AOD/ MISR Slope AOD/ per decade per decade per decade
Global Oceans 0.010 3.60 0.003 −0.003
Africa (NW Coast) 8◦N–24◦N 60◦W–18◦W −0.006 0.61 −0.013 −0.035 Africa (SE Coast) 27◦S–15◦S 32◦E–45◦E 0.017 2.12 0.010 −0.007 Africa (SW Coast) 23◦S–7◦S 20◦W–15◦E 0.016 1.35 0.009 −0.001
Arabian Sea 5◦N–23◦N 50◦E–78◦E 0.065 5.40 0.058 0.047
Central America 5◦N–20◦N 120◦W–90◦W −0.016 1.73 −0.023 −0.030
Coastal China 20◦N–40◦N 110◦E–125◦E 0.069 4.06 0.062 0.038
Indian Bay of Bengal 10◦N–25◦N 78◦E–103◦E 0.076 5.63 0.069 0.035 Mediterranean Sea 30◦N–45◦N 0◦E–40◦E −0.009 0.94 −0.016 −0.022 North America (E Coast) 30◦N–45◦N 80◦W–60◦W −0.008 1.07 −0.015 −0.019
Southeast Asia 15◦S–10◦N 80◦E–120◦E 0.014 0.80 0.007 0.002
bias in both MODIS instruments. MODIS has both onboard and external calibration methods with a solar diffuser used to continuously monitor solar output. But, it is unlikely that both would show bias at the exact same time. Day to day ra-diometric stability of individual channels is measured via the Spectro-Radiometric Calibration Assembly (SRCA), a self calibrating system which uses a didymium glass with known transmission peaks (Montgomery et al., 2000). This al-lows grating step and wavelength relationships to be known. Again, it is unlikely that both Aqua and Terra would suffer similar failures. To provide long term radiometric stability, approximately monthly, the Terra and Aqua spacecraft per-form an orbit maneuver to allow MODIS lunar calibrations (Sun et al., 2007). From these calibrations, coefficients are derived for time and scan angle dependent corrections for long term degradation in each individual channel. A change is possible here either in the algorithm, or the lunar model. We think that if a bias exists, it is possibly here.
Also, “there has been an issue with Terra’s Solar Diffuser, starting in 2003. The door is stuck ‘OPEN’. This means that space dust is collecting on this white plate over time. This degradation of the SD over time has to be corrected. So-lar diffuser data from Terra is almost totally disregarded in calibration because of this issue.” (L. Remer, personal com-munication, 2010).
Regardless of the above hypotheses, we are left with ev-idence that MODIS mean biases against AERONET, with likely increases from ∼2005–2006 onward. We therefore need to adjust the AOD trend to reflect this. After adjust-ing the1AOD trend (1AOD correction) in Fig. 2 based on Figs. 4 and 5, the trend-year AOD trend from the desea-sonalized DA quality Terra MODIS is reduced to 0.003/per decade, comparable to the magnitude of the standard devia-tion of the yearly trend estimated using Eq. (3), implying a
global change in AOD below detectable limits for the past 10 years. In the next section, we repeat our analysis regionally over the globe.
4.3 Regional analysis
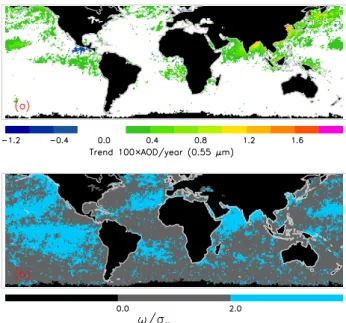
Despite the lack of an observed global trend after correc-tion, we found several coastal regions which did show sta-tistically significant positive and negative trends. Figure 7a shows the yearly AOD trend×100 for every 1 by 1 degree (Lat/Lon) over global oceans using the deseasonalized 10-year’s data assimilation quality MODIS aerosol data. Fig-ure 7b presents the corresponding figFig-ure of statistical signifi-cance (b,|ω/σω|>2). As we would expect from the
compar-isons in the previous section, similar trend results were found for the original MODIS data although, because of the overall reduced mean bias to AERONET, hereafter we will focus on the data assimilation data set.
Some perceivable trend is observable for nearly all regions of major aerosol activity, although only a few meet the level of statistical significance. Positive statistically significant trends are found over SW Asia, India, coastal China, and the east coast of South Africa. Negative trends are found off Central America, and west coast of North Africa. There are many regions of statistical significance but very slight trends, indicating fairly constant background values and little inter-annual variability, most notably in the remote subtrop-ical oceans. No significant trends are found over either the East Coast of North America or Europe.
Fig. 7. (a)Spatial distribution of the ten-year AOD trends for ev-ery 1×1◦(Lat/Lon). The ten-year trends of AOD×100 are plotted with the use of the deseasonalized DA quality MODIS aerosol prod-uct. (b) Spatial distribution of the|ω/σω|values for every 1×1◦ (Lat/Lon) estimated using the same data as used in (a). Note that regions with|ω/σω|>2 are consider to have real trends with a 95% confident level.
and remote ocean averages. Trends were calculated using the deseasonalized data assimilation quality Terra MODIS aerosol product as well as the operational Terra MISR prod-uct (as will be shown, deseasonalized MODIS operational and data assimilation quality versions are nearly identical). The slopes (AOD/per decade) of the MODIS trend analy-sis is both uncorrected, or perceived radiometric correction (simply the slope values after the1AOD correction as dis-cussed in Sect. 4.2). Corresponding trend lines for many of these regions are presented in Fig. 8.
Unlike the global signal, which after correction shows no trend, large differences are found in regional study areas studies that can be categorized into statistically significant positive, neutral or negative trends, as well as regions with low|ω/σω| ratios which indicate large enough inter-annual
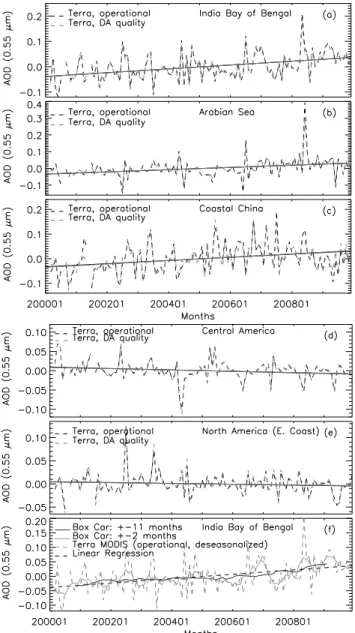
variability to prohibit the determination of a trend. The largest positive changes are found for three regions: Indian Bay of Bengal, coastal China, and the Arabian Sea. For ex-ample, Fig. 8a shows the deseasonalized decadal AOD trend over Indian Bay of Bengal without the1AOD correction. There, mean AOD has increased by∼0.08 over this region for the past 10 years, with a|ω/σω|value of much larger than 2,
indicating the trend is statistically significant. Furthermore, both the maximum and minimum values of the monthly mean AOD are found to be greatly increased, especially for the last few years. Also, large positive AOD trend exists for the In-dian Bay of Bengal region even after the1AOD correction
Fig. 8. (a)Similar to Fig. 2b, but for the ten-year AOD trend anal-ysis over the Indian Bay of Bengal region. The|ω/σω|of 5.45 is found for the trend, indicates the trend is real with a confident level of 95%.(b–e)Similar to (a) but for the Arabian Sea, Coastal China, Central America, and North America (E Coast) regions respectively.
(f)Similar to (a), but using the boxcar analysis for Indian Bay of Bengal.
Donkelaar et al., 2010). Note that based on a previous study (Zhang and Reid, 2009), this is also the region that suffers from regional sampling bias. Therefore, a combined use of model and satellite analysis is necessary to further evaluate the longer term trend of this area. Similar to the Bay of Ben-gal, Fig. 8b and c show the deseasonalized AOD trends for the Arabian Sea and Coastal China regions. Large ten year AOD increases of 0.07 and 0.07 were found for the two re-gions respectively, and for both rere-gions the|ω/σω|values are
larger than 2 showing that both trends are real with a 95% confidence level.
We also repeated this exercise using the deseasonalized MISR AOD data (Table 1), and despite sampling differences, positive increasing trends of 0.04, 0.04, and 0.05 (AOD/per decade) were found for Indian Bay of Bengal, Coastal China, and Arabian Sea respectively. The lower AOD trend values from MISR, in comparing with MODIS, could be due to the difference in spatial sampling of the two instruments.
Other regions over the globe show negative trends, includ-ing Central America (Fig. 8d), East Coast of North America (Fig. 8e), Northwest coast of Africa and the Mediterranean Sea regions. For example, there was a derived 5% drop in AOD over the east coast of North America for the past decade, indicating that the air quality over the coastal region of the eastern US is likely improving. For the remaining five regions, negligible changes are found. However, in all of these regions, the|ω/σω|values are less than 2 for those
re-gions, implying that a longer study period is required for the trends to be statistically significant.
For the three regions with significant AOD increases for the past 10 years (Indian Bay of Bengal, Coastal China, and Arabian Sea), a few questions naturally arise as to the cause and source reasons for the AOD increases. For example, is the increasing AOD trend caused by increases in frequency or in intensity of the aerosol events? And would such in-creases have natural or anthropogenic causes?
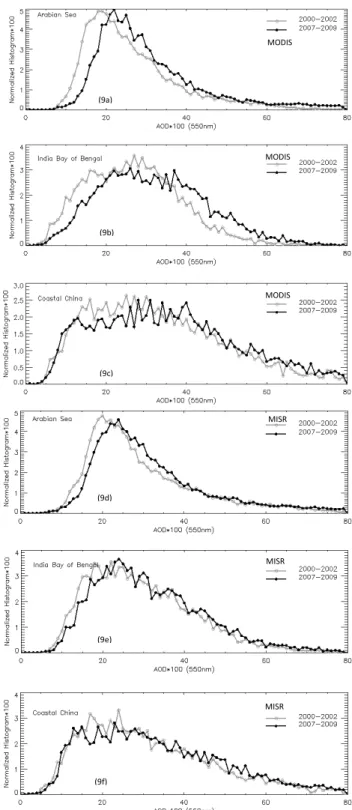
For the first question, we compared AOD histograms from years 2000–2002 to year 2007–2009 for the three selected regions as shown in Fig. 9. The granule level DA quality MODIS aerosol data were first averaged into 6-h, 1x1 degree averages, and then the 6-h averages were used for the his-togram analysis. The 6-hour average datasets, used in our operational aerosol forecasts, were then used to compute 2-year averages. Only relative differences between two peri-ods were studied, and therefore, the averaging process should not affect the analysis. Figure 9 shows the normalized AOD histogram for 2000–2002, and 2007–2009 study periods for the Arabian Sea (Fig. 9a), Indian Bay of Bengal (Fig. 9b), and Coastal China (Fig. 9c) regions. For both the Arabian Sea and Indian Bay of Bengal regions, the whole AOD his-togram shifts to the high AOD range, indicating an increase in aerosol loading for the averaged aerosol events for these two regions. For the Coastal China region, There is a net drop of lower optical depth days (∼0.1–0.25), and the fre-quency for heavy aerosol loading cases (AOD>0.4), also
in-(9a)
(9b)
(9c)
MODIS MODIS MODIS
(9d)
(9f) (9e)
MISR MISR MISR
Fig. 9. (a)Normalized AOD histogram for 2000–2002 and 2007–
2009 periods over the Arabian Sea. The 6-h, 1×1◦(Lat/Lon) DA quality MODIS aerosol product was used.(b)Similar to (a) but for Indian Bay of Bengal.(c)Similar to (a) but for Coastal China.(d–f)
creases from the 2000–2002 to the 2007–2009 period. For comparison, Fig. 9d–f show the similar analysis as Fig. 9a–c but use the over ocean MISR data. Yet remarkably similar histogram shifts were found, suggesting that the increasing AOD trends are consistent between the two sensors. Also note that 2000–2002 is a problematic period with Terra. That is when there was the flipping between Side A and Side B electronics (L. Remer, personal communication, 2010). Yet although not shown here, our study suggested that using the study period of 2002–2004 instead of 2000–2002 shows the similar patterns, suggesting the two year averages are less affected by the electronics changes of the instrument.
To understand the types of the aerosol particles that are responsible for the increasing AOD trends for the three re-gions, we studied fine and coarse mode aerosol optical depth trends. The fine mode aerosol optical depth values (likely of anthropogenic origin) were derived based on an empiri-cal approach lay out by the previous studies of Kaufman et al. (2005) and Yu et al. (2009). Kaufman et al. (2005) de-veloped a method of estimating the fine mode anthropogenic aerosol optical depth (AODa)using the Collection 4 MODIS
fine mode AOD fraction. Yu et al. (2009) updated the algo-rithm using the Collection 5 MODIS aerosol product. AODa is a “combustion” optical depth. And readers need to be aware that some smoke is natural and some dust might be anthropogenic (Lorraine Remer, personally communication, 2010). In these algorithms, the anthropogenic portion of the AOD (AODa) is estimated as:
AODa=((f−fd)×AOD−(fm−fd)×AODm)/(fa−fd) (4) Where f is the fine mode AOD fraction for the total AOD, and fa, fd, and fm are fine mode AOD fractions for anthro-pogenic aerosol, dust aerosol, and marine aerosol compo-nents respectively. The fa, fd, and fm values are estimated to be 0.90, 0.37, and 0.45 for the collection 5 over ocean MODIS aerosol product (Yu et al., 2009). AODm is the
marine AOD, and is estimated to be 0.06 (Kaufman et al., 2005; Yu et al., 2009). Note that as suggested by Yu et al. (2009), the fmis regionally dependent and a 20% uncer-tainty in AODa could be introduced with the use of a fixed
fmvalue. However, the inter-annual variations in fmcould be insignificant (Yu et al., 2009), and a fixed fmvalue is there-fore chosen in this study to avoid additional uncertainties in estimating regional based fmto the inter-annual variations.
Figure 10a shows the regional distribution of the 10-year trend for the deseasonalized AODaestimate based on Eq. (4). The MODIS Collection 5 over water aerosol product was used, instead of the DA quality MODIS aerosol product, be-cause the empirically derived parameters (Yu et al., 2009) in Eq. (4) could be product sensitive. Although Fig. 10a shows similar patterns as Fig. 7a for most regions domi-nated by pollution and smoke aerosols, such as Asia, re-gions that are dominated by dust and sea salt aerosols, such as the west coast of North Africa and high latitude southern
Fig. 10. (a)Similar to Fig. 7a, but the spatial distribution of 10-year trend of the anthropogenic AOD. The 1×1◦(Lat/Lon) aver-aged MODIS Collection 5 aerosol product was used.(b)Spatial dis-tribution of the|ω/σω|values for every 1×1◦(Lat/Lon) estimated using the same data as used in (a).
oceans, show almost no trend for the past 10 years. Similar to Fig. 7b, Fig. 10b shows the|ω/σω|values for the estimates
in Fig. 10a. Regions such as Indian Bay of Bengal, Coastal China, and Arabian Sea have decadal trend signals that are sufficient for|ω/σω|values to be larger than 2. The averaged
trend values for AODafor Coastal China, Indian Bay of
Ben-gal , and Arabian Sea are 0.078, 0.058, 0.034 per 10-year re-spectively. Comparing these values with the total AOD trend values from Table 1, we conclude that the primary influence on trends in total AOD over coastal China and the Bay of Bengal are from anthropogenic fine mode optical depth. In contrast, the trend over Arabian Sea region is partially the result of increased dust aerosol presence. On the global av-erage, the AODa trend is−0.024 per 10-year, with aω/σω
value of |3.40|, indicating that anthropogenic aerosol opti-cal depth could indeed have decreased slightly even though the total AOD pattern shows a slightly increasing trend for the past 10 years. Note that the color scheme for Fig. 10a is set to highlight regions with positive trend numbers, and therefore, although areas of positive trend are illustrated, the overall global average shows a slightly negative trend.
Fu-ture research efforts are necessary to fully understand satel-lite derived aerosol size parameters before we draw definite conclusions from those parameters.
5 Conclusion
Although short and longer term AOD trends have been eval-uated through various studies (e.g. Kishcha et al., 2007; Mishchenko et al., 2007a and b; Remer et al., 2008; Zhao et al., 2008; Herman et al., 2009; Li et al., 2009b; Streets et al., 2009; Yu et al., 2009), unlike previous research ef-forts, using decade of over water MODIS and MISR aerosol products, we carefully examine biases in satellite AOD trend analysis due to radiometric calibration, cloud contamination, and sampling biases (Zhang and Reid, 2009). The statisti-cal significance of the AOD trends estimated from this study, both in regional and global scale, were also evaluated for the data assimilation quality over water Terra MODIS aerosol product. We conclude:
1. Systematic trend differences exist over the 10 year data record between operational MODIS and MISR over wa-ter, MODIS showing a consistent increase in AOD of the rate of 0.01 per decade and MISR shows no such trend.
2. By examining the derived difference between yearly av-eraged AOD and pairwise coastal AERONET data for AERONET AOD less than 0.2, suggest MODIS suffers from a 0.007–0.010 per decade bias for both the Terra and Aqua instruments. Similar results were also found by examining MODIS and MISR AOD data over the very remote oceans. This indicates the existence of a potential systematic bias is MODIS calibration meth-ods.
3. After correcting for the trend biases, a statistically negli-gible trend in AOD of±0.003/per decade was found for the trend analysis using the deseasonalized DA quality Terra MODIS and operational MISR data over global oceans. This is on the order of the standard deviation of the trend, indicating the trend is below the detection limit.
4. Our study finds large AOD increases over Coastal China, Indian Bay of Bengal, and Arabian Sea regions for the past ten years with a 95% confident level. Espe-cially over the coastal India region, the increase in AOD indicates a worsening scenario to the already heavily polluted air, and could have a strong impact on local re-gional climate. Further analysis reveals that the increas-ing trends are caused mostly by the increased intensity of anthropogenic aerosol events for coastal China and the Bay of Bengal regions, whereas the Arabian Sea re-gions experience a stronger influence from dust events. Even after MODIS trend correction, MISR still showed
half the trend as MODIS, possibly due to sampling dif-ferences of the two instruments.
5. Over regions like the East Coast US, a decreasing trend in AOD was found, indicating an improvement in air quality for the last decade. Yet more months of observa-tions are required for the trends to be statistically sound. 6. The finding from this study, a negligible AOD trend over global oceans for the past 10 years, is inconsis-tent with a decreasing trend as reported by Mishchenko et al. (2007b) using the AVHRR data for the year of 2000–2005. Considering that MODIS has much im-proved spatial and spectral resolutions, and includes on-board calibration that the AVHRR visible channels lack, it is plausible that the decreasing AOD trend reported by Mishchenko et al., (2007) for the period of 2000– 2005 could be introduced by the uncertainties in sen-sor calibration, even though some form of external cal-ibrations using stable bright surfaces have been imple-mented (e.g. Rao and Chen, 1996). A carefully analysis of calibration to the AVHRR trend is necessary for a fu-ture study.
Acknowledgements. This research was funded by the Office of Naval Research Code 322, the Office of Naval Research Young Investigator Program, and the NASA Interdisciplinary Science Program. We acknowledge and appreciate the AERONET program and their contributing principal investigators and their staff for establishing and maintaining the coastal and inland sites used in this investigation. We would like to thank reviewers Lorraine Remer and Michael Mishchenko for their thoughtful comments. We would also like to thank Ralph Kahn for his helpful comments and suggestions.
Edited by: R. MacKenzie
References
Cermak, J., Wild, M., Knutti, R., Mishchenko, M. I., and Heidinger, A. K.: Consistency of global satellite-derived aerosol and cloud data sets with recent brightening observations, Geophys. Res. Lett., L21704, doi:10.1029/2010GL044632, 2010.
Giglio, L., Csiszar, I., and Justice, C. O.: Global distribu-tion and seasonality of active fires as observed with the Terra and Aqua Moderate Resolution Imaging Spectrora-diometer (MODIS) sensors, J. Geophys. Res., 111, G02016, doi:10.1029/2005JG000142, 2006.
Herman, J. R., Labow, G., Hsu, N. C., and Larko, D.: Changes in cloud and aerosol cover (1980–2006) from reflectivity time series using SeaWiFS, N7-TOMS, EP-TOMS, SBUV-2, and OMI radiance data, J. Geophys. Res., 114, D01201, doi:10.1029/2007JD009508, 2009.
Kahn, R. A., Garay, M. J., Nelson, D. L., Yau, K. K., Bull, M. A., Gaitley, B. J., Martonchik, J. V., and Levy, R. C.: Satellite-derived aerosol optical depth over dark water from MISR and MODIS: Comparisons with AERONET and implica-tions for climatological studies, J. Geophys. Res., 112, D18205, doi:10.1029/2006JD008175, 2007.
Kahn, R. A., Nelson, D. L., Garay, M., Levy, R. C., Bull, M. A., Diner, D. J., Martonchik, J. V., Paradise, S. R., and Hansen, E. G., and Remer, L. A.: MISR Aerosol product attributes, and sta-tistical comparisons with MODIS. IEEE Trans. Geosci. Remt. Sens, 4095–4114, 2009.
Kahn, R. A., Gaitley, B. J., Garay, M. J., Diner, D. J., Eck, T., Smirnov, A., and Holben, B. N.: MISR aerosol product assess-ment by comparison with AERONET. J. Geophys. Res., in press, 2010.
Intergovernmental Panel on Climate Change (IPCC): The scientific basis, Cambridge University Press, Cambridge, UK and New York, NY, USA, 996 pp., 2007.
Kahn, R. A., Gaitley, B., Martonchik, J., Diner, D., Crean, K., and Holben, B.: MISR Global Aerosol Optical Depth Valida-tion based on Two Years of Coincident AERONET observaValida-tions, J. Geophys. Res., doi:10:1029/2004JD004706, 2005.
Kaufman, Y. J., Koren, I., Remer, L. A., Tanr´e, D., Ginoux, P., and Fan, S.: Dust transport and deposition observed from the Terra-Moderate Resolution Imaging Spectroradiometer (MODIS) spacecraft over the Atlantic Ocean, J. Geophys. Res., 110, D10S12, doi:10.1029/2003JD004436, 2005.
Kishcha, P., Starobinets, B., and Alpert, P.: Latitudinal vari-ations of cloud and aerosol optical thickness trends based on MODIS satellite data, Geophys. Res. Lett., 34, L05810, doi:10.1029/2006GL028796, 2007.
Lallart, P., Kahn, R., and Tanr´e, D.: POLDER2/ADEOSII, MISR, and MODIS/Terra reflectance comparisons. J. Geophys. Res., 113, D14S02, doi:10.1029/2007JD009656, 2008.
Lau K.-M., K.-M. Kim, Observational relationships between aerosol and Asian monsoon rainfall, and circulation, Geophys. Res. Lett., 33, L21810, doi:10.1029/2006GL027546, 2006. Levy, R. C., Leptoukh, G. G., R. Kahn, V. Zubko, A. Gopalan,
and L.A. Remer, A Critical Look at Deriving Monthly Aerosol Optical Depth From Satellite Data. IEEE Transacations on Geo-science and Remote Sensing, 47(8), 2942–2956, 2009.
Levy R. C., Remer, L. A., Kleidman, R. G., Mattoo, S., Ichoku, C., Kahn, R., and Eck, T. F.: Global evaluation of the Collection 5 MODIS dark-target aerosol products over Land, Atmos. Chem. Phys. Discuss., 10, 14815–14873, doi:10.5194/acpd-10-14815-2010, 2010.
Li, J., Carlson, B. E., and Lacis, A. A.: A study on the tem-poral and spatial variability of absorbing aerosols using To-tal Ozone Mapping Spectrometer and Ozone Monitoring In-strument Aerosol Index data, J. Geophys. Res., 114, D09213, doi:10.1029/2008JD011278, 2009a.
Li, Z., Zhao, X., Kahn, R., Mishchenko, M., Remer, L., Lee, K.-H., Wang, M., Laszlo, I., Nakajima, T., and Maring, H.: Un-certainties in satellite remote sensing of aerosols and impact on monitoring its long-term trend: a review and perspective, Ann. Geophys., 27, 2755–2770, 2009b,
http://www.ann-geophys.net/27/2755/2009/.
Lyapustin, A., Wang, Y., Kahn, R., Xiong, J., Ignatov, A., Wolfe, R., Wu, A., Holben, B., and Bruegge, C.: Analysis
of MODIS–MISR calibration differences using surface albedo around AERONET sites and cloud reflectance, Remote Sens. En-viron.,107, 12–21, 2007.
Massie, S. T., Torres, O., and Smith, S. J.: Total Ozone Mapping Spectrometer (TOMS) observations of increases in Asian aerosol in winter from 1979 to 2000, J. Geophys. Res., 109, D18211, doi:10.1029/2004JD004620, 2004.
Mishchenko, M. I., Geogdzhaev, I. V., Rossow, W. B., Cairns, B., Carlson, B. E., Lacis, A. A., Liu, L., and Travis, L. D.: Long-term satellite record reveals likely recent aerosol trend, Science, 315, 1543, doi:10.1126/science.1136709, 2007a.
Mishchenko, M. I. and Geogdzhayev, I. V.: Satellite remote sensing reveals regional tropospheric aerosol trends, Opt. Exp. 15, 7423– 7438, 2007b.
Mishchenko, M. I., Geogdzhayev, I. V., Liu, L., Lacis, A. A., Cairns, B., and Travis, L. D.: Toward unified satellite climatol-ogy of aerosol properties: what do fully compatible MODIS and MISR aerosol pixels tell us?, J. Quant. Spectrosc. Radiat. Trans-fer, 110, 402–408, 2009.
Montgomery, H., Che, N., Parker K.,, and Bowser, J.: The al-gorithm or MODIS wavelength on-orbit calibration suing the SRCA, IEEE Trans. Geosci. Remote Sens., 38, 877–884, 2000. O’Neill, N. T., Eck, T. F., Smirnov, A., Holben, B. N.,
and Thulasiraman, S.: Spectral discrimination of coarse and fine mode optical depth, J. Geophys. Res., 108(D17), 4559, doi:1029/2002JD002975, 2003.
Rao, C. R. N. and Chen, J.: Post launch calibration of the visible and near-infrared channels of the Advanced Very High Resolution Radiometer on the NOAA-14 spacecraft, Int. J. Remote Sens., 17, 2743–2747, 1996.
Remer, L. A., Kaufman, Y. J., Tanr´e, D., Mattoo, S., Chu, D. A., Martins, J. V., Li, R.-R., Ichoku, C., Levy, R. C., Kleidman, R. G., Eck, T. F., Vermote, E., and Holben, B. N.: The MODIS aerosol algorithm, products and validation, J. Atmos. Sci., 62, 947–973, 2005.
Remer, L. A., Kaufman, Y. J., and Kleidman, R. G.: Comparison of three years of Terra and Aqua MODIS Aerosol Optical Thickness Over the Global Oceans. IEEE, Geosci. Remote Sens. Lett., 3(4), 537–540, 2006.
Remer, L. A., Kleidman, R. G., Levy, R. C., Kaufman, Y. J., Tanr´e, D., Mattoo, S, Martins, J. V., Ichoku, C., Koren, I., Yu, H., and Holben, B.: Global aerosol climatology from the MODIS satellite sensors, J. Geophys. Res., 113, D14S07, doi:10.1029/2007JD009661, 2008.
Shi, Y., Zhang, J., Reid, J. S., Holben, B. N., Hyer, E. J., and Curtis, C.: An analysis of the collection 5 MODIS over-ocean aerosol optical depth product for its implication in aerosol assimilation, Atmos. Chem. Phys., submitted, 2010.
Streets, D. G., Yan, F., Chin, M., Diehl, T., Mahowald, N., Schultz, M., Wild, M., Wu, Y., and Yu, C.: Anthropogenic and natural contributions to regional trends in aerosol op-tical depth, 1980–2006, J. Geophys. Res., 114, D00D18, doi:10.1029/2008JD011624, 2009.
Sun, J.-Q., Xiong, X., Barnes, W. L., and Guenther, B.: MODIS reflective solar bands on-orbit lunar calibration, IEEE Trans. Geosci. Remote Sense, 45, 2383–2393, 2007.
Aerosol Optical Depth: Development and Application, Environ. Health Pers., 118, 847–855, doi:10.1289/ehp.0901623, 2010. Weatherhead, E. C., Reinsel, G. C., Tiao, G. C., Meng, X.-L., Choi,
D., Cheang, W.-K., Keller, T., DeLuisi, J., Wuebbles, D. J., Kerr, J. B., Miller, A. J., Oltmans, S. J., and Frederick, J. E.: Factors affecting the detection of trends: Statistical considerations and applications to environmental data, J. Geophys. Res., 103(D14), 17149–17161, 1998.
Young, P. C. Pedregal D. J., and Tych, W.: Dynamic Harmonic Re-gression, J. of Forecast., 18, 369–394, 1999.
Yu, H., Chin, M., Remer, L. A., Kleidman, R. G., Bellouin, N., Bian, H., and Diehl, T.: Variability of marine aerosol fine-mode fraction and estimates of anthropogenic aerosol component over cloud-free oceans from the Moderate Resolution Imaging Spectroradiometer (MODIS), J. Geophys. Res., 114, D10206, doi:10.1029/2008JD010648, 2009.
Zhang, J. and Reid, J. S.: MODIS Aerosol Product Analysis for Data Assimilation: Assessment of Level 2 Aerosol Op-tical Thickness Retrievals, J. Geophys. Res, 111, D22207, doi:10.1029/2005JD006898, 2006.
Zhang, J. and Reid, J. S.: An analysis of clear sky and contextual biases using an operational over ocean MODIS aerosol product, Geophys. Res. Lett., 36, L15824, doi:10.1029/2009GL038723, 2009.
Zhang, J., Reid, J. S., and Holben, B. N.: An analysis of potential cloud artifacts in MODIS over ocean aerosol op-tical thickness products, Geophys. Res. Lett., 32, L15803, doi:10.1029/2005GL023254, 2005.
Zhang, J., Christopher, S. A., and Holben, B. N.: Intercomparison of aerosol optical thickness derived from GOES-8 Imager and Ground-Based Sun Photometers, J. Geophys. Res, 106, 7387– 7398, 2001.